Åland, Finland · 6,757 islands over a quarter hectare
Åland rose out of the sea. Scroll back and watch it come up.
A sea 64 metres higher, when less than 1 % of today’s Åland was dry. Scroll forward as the islands rise.
Scroll
5300 BC · sea +64 m
Almost none of it existed.
The sea stood about 64 metres above today’s. Only about 14 km² were dry, against 1,583 km² of land and lakes now: the tops of the highest hills.
The oldest lake in our record sits at 65 m on today’s land. It was cut off from the larger water around 5300 BC.
4000 BC · sea +49 m
The sea was still 49 metres higher.
By 4000 BC the sea had fallen to 49 m and about 51 km² were dry, 3 % of the present land.
The Åland register mentions Comb Ware (a Stone Age pottery) at 12 monuments. On this map they stand at a median of 56 m, and 10 of the 12 stand above even the lowest sea of 3900 to 3300 BC (42 m). The other 2 are within five metres of it.
2000 BC · sea +29 m
The sea fell a metre a century.
The sea stood 29 m above today’s and about 240 km² were dry, 15 % of the present land. Between 4000 and 2000 BC it fell about 10 mm a year.
AD 1 · sea +13 m
Half of today’s land.
At the start of the calendar the sea stood 13 m above today’s. About 780 km² were dry, 49 % of the present land. From 2000 BC to now the fall averaged 8 mm a year.
AD 1050 · sea +6 m
Six metres left to fall.
Ekman’s 2017 calculation puts the shore at 6.0 ± 0.3 m at Saltvik in AD 1050, and between 5.5 and 6.4 m across main Åland. About 1,230 km² were dry, 78 % of the present land.
Today · sea at 0 m
The land still rises 5.7 mm a year.
On this map, land and lakes cover about 1,570 km². The official figure is 1,583 km².
The Nordic uplift model NKG2016LU gives 5.7 mm a year at Degerby, and the tide gauge there shows the sea 35 cm lower against the land than in the 1920s.
Today · 30,836 people
Each dot is a home.
7,456 buildings tagged as homes in OpenStreetMap. Most of the other 26,116 buildings on Åland are sheds, boathouses, cabins and buildings with no tag.
30,836 people live in 16 municipalities. 11,957 of them live in Mariehamn.
Where people live
Ålanders do not live on the newest ground.
We expected people to prefer low, young ground near the shore. They do not. Half of Ålanders live on ground the sea left around 250 BC, and half of all the land on Åland is almost exactly as old (about AD 1). Roofs and trees lift the surface model, so the true median is somewhat younger: AD 300 on the strictest correction.
Explore
Tap any place.
Tap any spot to read the year it left the sea, with its error. Drag the slider to move the sea.
Or pick a place
Tap the map
Since you were born
Type a birth year. The gauge at Degerby gives the change in sea level against the land since then, as five-year averages.
Åland in 2100
At today’s uplift of 5.7 mm a year the land rises about 43 cm by 2100. What the sea does is not known; set it yourself.
Where Ålanders live, and on what ground
We spread each municipality’s population over its homes and read the age of the ground under every one, the same way the map dates ground for you. The answer is the median: half of all residents live on older ground, half on younger. We wrote three predictions down before looking: that people live at least 5 m lower than the land average, that Mariehamn has the youngest ground of the 16 municipalities, and that more than half of residents live on ground younger than 1500 BC.
Two of the three failed. The median resident’s ground left the sea at a level of 15 m above today’s sea, against 13 m for the median square metre of land: people are not lower, they live 2 m higher. Mariehamn ranks 11 of 16, not first. The third held (80 % of residents against 78 % of the land), but it says little, because most of Åland is that young.
Median ground age under homes (dot) against the median for all land in the same municipality (bar end). Year the sea left, from the shore curve.
The pattern is geography, not preference. In the outer islands (Kökar, Sottunga, Brändö, Kumlinge, Föglö) the median home stands on ground that left the sea between AD 650 and AD 900. On the main island’s farming parishes (Sund, Hammarland, Finström, Jomala) it is between 800 BC and 500 BC. The farther out you go, the younger the ground under the houses.
Method guards. Buildings come from OpenStreetMap, and only 7,456 of the 33,572 buildings on Åland are tagged as homes; counting every building except sheds, garages and similar would give about 30,900 buildings. Both versions give the same answer: people are not on younger ground than the land. The surface model includes roofs and trees; taking the lowest of each cell’s 5 × 5 neighbours moves the median by about 4 m, to AD 300.
Who lives here
Åland’s land still rises 5.7 mm a year, but the number of residents born on Åland has not moved since 2000: 18,682 then, 18,685 now. Nearly all of the 5,060 extra people moved in. From 25,776 in 2000 to 30,836 now, births minus deaths account for 143 of them, migration for 4,792 and a register correction for 125. In 2025 there were more deaths (317) than births (251).
Residents by birthplace in 2000 and 2025 (Statistics and Research Åland, table BE010).
Mariehamn, founded in 1861, grew from 1,015 people in 1910 to 11,957. Outside Mariehamn the population fell from 20,341 in 1910 to a low of 12,107 in 1971, 40 % less, and has since recovered to 18,879. Mariehamn’s borders may have moved since 1910; the total for Åland does not depend on them.
Population of Åland, 1910 to 2025: Mariehamn and the rest.
Swedish is the mother tongue of 84.4 % of residents, down from 93.8 % in 2000. Finnish barely moved, from 4.8 % to 4.5 %. The fall comes from other languages: 1.4 % in 2000, 11.1 % now. The table names eight languages and lumps the rest together, so the page does not rank them. Language here is the mother tongue in the population register.
How Åland became autonomous, 1809 to 1921
Åland’s status was decided between 1917 and 1921. The table starts with what led there, and each row links its source.
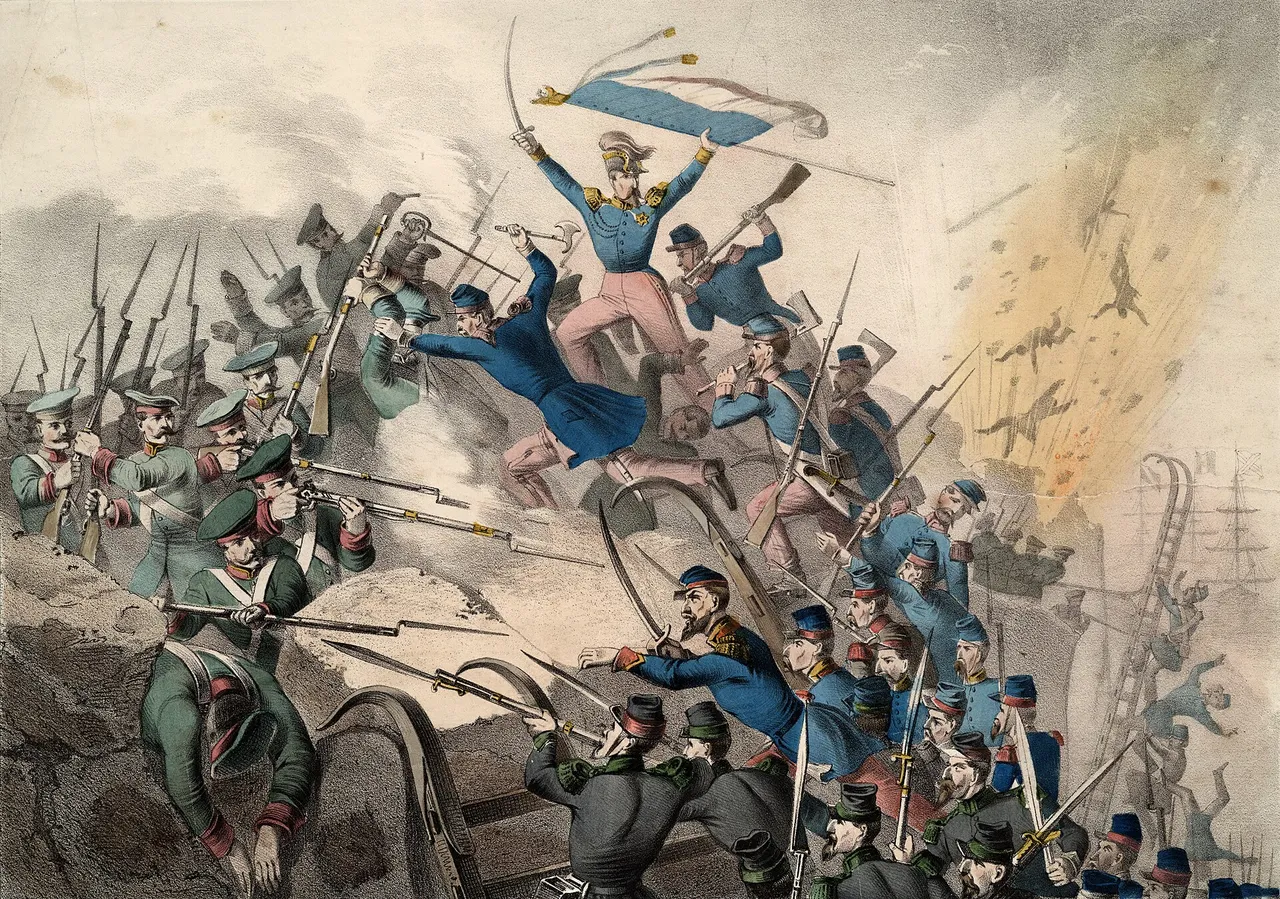
The storming of Bomarsund, 1854. Lithograph published by Joseph Scholz, Mainz. Public domain, Wikimedia Commons.
Date
What happened
Source
17 Sep 1809
Sweden gives Finland and Åland to Russia in the Treaty of Fredrikshamn.
Ten states sign the Geneva convention on the non-fortification and neutralisation of the islands. Sweden, Germany, Denmark, Finland, France and the United Kingdom deposit their ratifications on 6 April 1922.
The 95.48 % is the share of the signatures cast, not of Ålanders. The source gives no count of eligible voters for 1919, so 95.48 % describes the signatures cast and nothing larger.
Ålanders asked for Sweden and got autonomy under Finland. The League Council left sovereignty with Finland. According to a published transcription of the decision, it required guarantees: Swedish in schools, land kept in the inhabitants’ hands, limits on the voting rights of people who move in and a governor the population trusts. The next table shows the present rules in today’s Act.
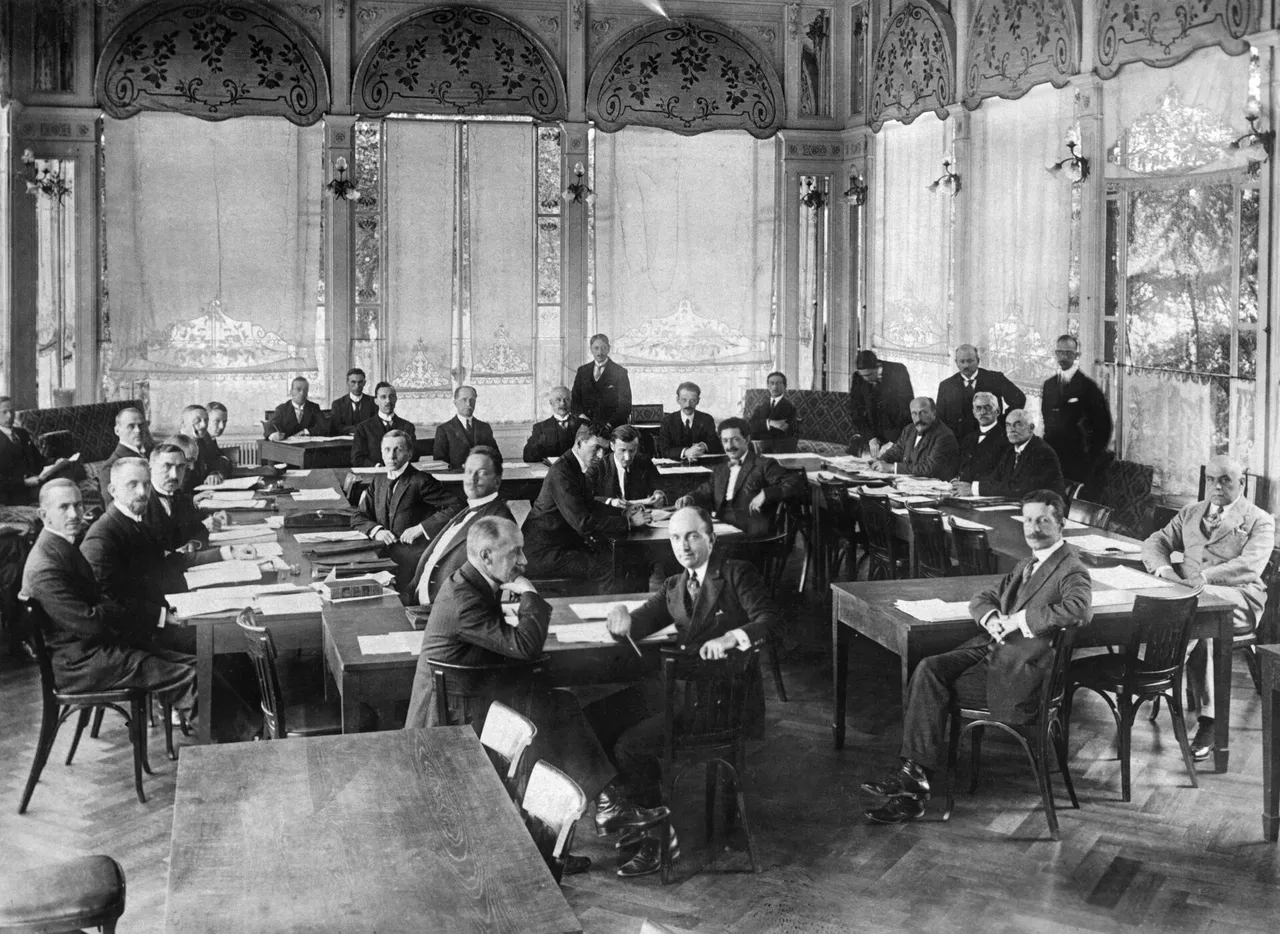
The conference on the neutralisation of the Åland Islands, Geneva, October 1921. Photo: Atlantic, Finnish Heritage Agency (JOKA), CC BY 4.0, via Wikimedia Commons.
What autonomy is, by statute
Åland is part of Finland with its own parliament, the Lagting, and its own legislation in the fields the Autonomy Act gives it. The rules that shape who lives here are in a few sections of the 1991 Act (Finlex 1144/1991) and one protocol to Finland’s EU accession treaty. This table summarises what they say.
Rule
What the text says
Where
Language
The region is monolingually Swedish.
§36, Autonomy Act 1144/1991
Regional citizenship (hembygdsrätt)
A Finnish citizen who moves in can get it, on application, after at least five years of unbroken residence and satisfactory Swedish.
§7
Elections
Only holders vote in or stand for the Lagting. Municipal elections: holders, and others in the cases §67 provides for.
§9, §67
Land
Limits on buying land are set in the land acquisition act and do not apply to holders.
§10; Land Acquisition Act 3/1975
Military service
Holders have the right to serve instead in the pilot and lighthouse service or other civil administration, and are exempt from conscription until that service is arranged. This does not apply to anyone who moved in after age 12.
§12
EU
Provisions in force on 1 January 1994 may limit the buying of property and the right to run a business for people without regional citizenship. Åland is a third territory for EU VAT and excise. All EU nationals must be treated equally.
Protocol 2 to the 1994 Act of Accession, arts. 1, 2(a), 3
In 2025, 24,316 people with regional citizenship lived on Åland and 1,700 lived elsewhere (Statistics and Research Åland, table BE052).
Five things people say about Åland, checked
Claim
Verdict
What the source says
“Åland is a country.”
✕ False
The 1921 League of Nations decision recognised Finland’s sovereignty over the islands; Åland is autonomous within it.
“Åland has been demilitarised since 1856.”
~ Misleading
The 1856 convention bound Russia, which fortified the islands in the First World War. Finland fortified them in the Winter War and in 1941 to 1944. The 1921 convention made them non-fortified and, for the first time, neutral, with named exceptions.
“Åland is outside the EU VAT area.”
✓ True
Protocol 2, art. 2(a): Åland is treated as a third territory for VAT and excise.
“Åland has 6,500 islands.”
✕ Wrong figure
The statistics office counts 6,757 islands of 0.25 ha or more, about 20,000 smaller ones, and about 60 inhabited. Our own map count fails against that; see the limits below.
“Ålanders do not do military service.”
✓ True, with conditions
§12: holders may serve in the pilot and lighthouse service or other civil administration instead, and are exempt from conscription until that service is arranged. It does not apply to anyone who moved in after age 12.
Send it
A link, or a picture of the place you tapped.
Share this page
How a lake dates a shoreline
Each dot is a lake. Every one was joined to the sea (the oldest to its freshwater predecessor, the Ancylus Lake) until the land under its outlet rose above the water, and the mud on its floor changes from open water to lake at that moment. Glückert dated 19 such basins on Åland in 1978; Vuorela and colleagues recalibrated them in 2009. Add two shore heights at Saltvik from Ekman’s 2017 calculation, AD 550 and AD 1050, and one curve of exponential decay runs through all 21 points.
Shore height above today’s sea against calendar year. Dots are dated lakes (green) and Ekman’s two shores at Saltvik (rose); the line is the fitted curve and the band is the root-mean-square miss of its age band.
To measure the curve, take one point out, fit the rest, and see how far the missing point lands from the line. Before 3500 BC the miss averages 1.1 m (5 points). From 3500 to 1500 BC it is 3.2 m (7), from 1500 BC to AD 500 it is 4.2 m (6), and after AD 500 it is 0.4 m (3, one lake and Ekman’s two shores). The worst single miss is 8.5 m. The shore on the map is right to a few metres, not to centimetres. The lakes lie in different parts of Åland, and the NKG2016LU model gives land rising anywhere from 5.1 to 6.5 mm a year across the islands, so one curve is an average.
Is the land really still rising? A test that could have failed.
The uplift model NKG2016LU was built without a single tide gauge. We asked it, together with the gauges at Turku, Hanko, Rauma and Stockholm (and Forsmark where its record covers the whole window), to predict the one gauge on Åland itself, at Degerby in Föglö, which the model never saw. The pass mark was fixed in advance: within 0.3 mm a year.
Years
Predicted
Measured
Miss
1933–2024
−3.33
−3.36 ± 0.25
0.03
1976–2024
−2.68
−2.76 ± 0.71
0.08
1993–2024
−1.43
−1.64 ± 1.21
0.22
Trends in millimetres of sea level against land per year; negative means the sea is falling against the land. Measured values carry ± one standard error of the plain regression.
All three windows pass, but the test is strong only for 1933 to 2024: in 1993 to 2024 the measured error (± 1.21) is four times the pass mark, so passing proves little there. Start the same test in 1960 and the miss is 0.31 mm a year, just over the line. Start it in 1965 and it is 0.38. Both fail.
Annual mean sea level at Degerby against the land, 1924 to 2025, from the gauge record. It fell 35 cm between the first five years and the last five.
A slowdown we could not confirm
The sea is rising too, and it looks as if the net gain in land slowed around 1993. The answer changes with where the record is split and which years are compared, and at no split does any gauge show a significant slowdown, meaning a difference larger than twice its standard error. The sea-rise term itself reads 2.4 mm a year over 1933 to 2024 and 4.3 mm a year over 1993 to 2024, but a record this short cannot say whether that is acceleration. So the page does not claim a slowdown, and it draws no future coastline.
Where this map is wrong
Land area matches, island count does not. The map’s land and lakes cover about 1,570 km² against the official 1,583 km². Counting islands of 0.25 ha or more, it finds 5,013 against the official 6,757, 26 % fewer, almost all of the gap among islets under five hectares. A satellite surface of 30 m cells merges neighbouring rocks. So the page shows land area and never an island count.
Islands by size, model against the official table (hectares).
The surface includes trees. Forest makes low ground look higher, so the map dates it older than it is. Below about three metres of height it does not date ground at all. There is no seabed: today’s sea is drawn flat, which is why the future coast is not drawn.
A prediction of ours failed. Before reading any monument height we wrote that Bronze Age monuments would stand between 15 and 25 m. The median of the 18 monuments whose register entry names the Bronze Age is 36 m. The prediction was badly framed: a monument stands above the shore, not on it. The sharper test is that no dated monument stands below the sea of its own time. Of 102 monuments whose entry names a period, 3 stand below the shore of the period’s end, none by more than five metres.
Sources and method
Everything printed here comes from one file of computed values; the release check recomputes each from the data. Heights are in metres on today’s land, the dating curve is an exponential fit, and none of it is a forecast.
Copernicus GLO-30 digital surface model (ESA, free with attribution), six tiles around 60° N 20° E. Heights in EGM2008; the sea is flat at zero.
Land uplift: Vestøl et al. 2019, NKG2016LU, Journal of Geodesy 93. Built without tide gauges.
Statutes and treaties: Autonomy Act 1144/1991 (Finlex); the 1920 and 1951 Acts, the Åland Agreement and the League decision in the Åland government compendium; Convention on the non-fortification and neutralisation of the Åland Islands, 20 October 1921, with the 1856 convention, Swedish treaty series SÖ 1921:26; Protocol 2 to the 1994 Act of Accession (EUR-Lex).