Earth science · ten sourced facts
Thunderstorms make antimatter
Lightning that makes antimatter, an earthquake that shortened the day, a sea surface that dips 106 metres below its reference. Ten things about the Earth that sound wrong and are in the scientific literature. Where a number is a model result, the page says so.
- 0.511 MeVflash that marks antimatter in a storm
- 1.8 µsoff the day, one quake
- −106 mgeoid low, Indian Ocean
- −50 °Ca pond can stay liquid
Thunderstorms make antimatter
Lightning fires gamma rays energetic enough to knock neutrons out of air, and the debris emits positrons, the antimatter twin of the electron.
Thunderstorms are natural particle accelerators. Strong electric fields inside the clouds hurl electrons to near light speed, and when air brakes those electrons they emit gamma rays. Satellites have recorded these terrestrial gamma-ray flashes since the early 1990s; the first report, from NASA’s Compton Gamma Ray Observatory, dates from 1994.
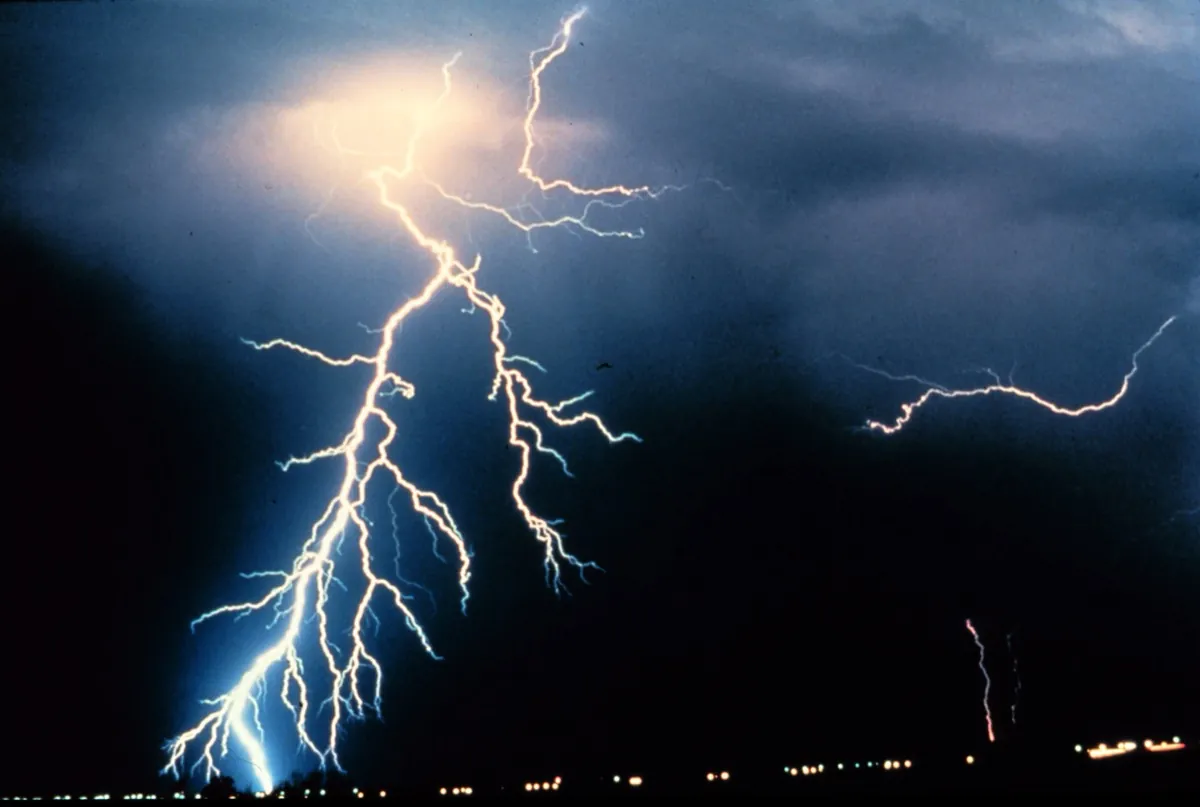

On 6 February 2017, during a thunderstorm in Japan, a team led from Kyoto University caught a gamma-ray flash with ground detectors 0.5 to 1.7 kilometres from the lightning. The flash lasted under a millisecond. An afterglow faded with a decay time of 40 to 60 milliseconds, as neutrons were captured by nuclei in the air. After that came a line at 0.511 MeV that lasted about a minute, the energy of each of the two photons released when an electron meets a positron and both vanish. The gamma rays had struck nitrogen-14 nuclei in the air and knocked a neutron out of each. The resulting nitrogen-13 is unstable and decays by emitting a positron.
The authors called the neutrons and positrons unequivocal evidence that natural lightning triggers photonuclear reactions, nuclear reactions started by gamma rays. In their original 2017 preprint they placed lightning in a short list: as a natural atmospheric route to photonuclear reactions it was only the second known, after cosmic-ray interactions, which make isotopes including carbon-14, the one radiocarbon dating measures. The reaction is real, and it happens in the sky above you.
Enoto et al., “Photonuclear reactions triggered by lightning discharge”, arXiv:1711.08044, published in Nature 551, 481 (2017). The cosmic-ray statement and the 6 February date are in the arXiv abstract; the Nature abstract gives the minute-long line. First flashes: Fishman et al., Science 264, 1313 (1994).
An earthquake may have shortened the day
NASA’s Jet Propulsion Laboratory calculated that the 2011 Japan earthquake should have shortened the day by about 1.8 microseconds, and that the 2004 Sumatra earthquake should have shortened it by about 6.8.
A quake moves rock, and moving rock changes how the planet’s mass is spread. Angular momentum is conserved, as with a skater who pulls in their arms, so a more compact Earth turns a touch faster. In March 2011 Richard Gross at JPL modelled the magnitude 9.0 Tōhoku earthquake and calculated that the day got shorter by about 1.8 microseconds. His model also predicted that the Earth’s figure axis, the line round which its mass balances, shifted about 17 centimetres towards 133 degrees east. USGS has since revised the quake’s magnitude to 9.1.
The same JPL article ran the numbers for two earlier quakes. The 2004 Sumatra earthquake, magnitude 9.1, should have shortened the day by 6.8 microseconds and shifted the figure axis about 7 centimetres, roughly four times Japan’s effect on the day. The 2010 Chile earthquake, magnitude 8.8, gave 1.26 microseconds and 8 centimetres.
These numbers come from fault-slip models, not a stopwatch, and NASA called the 2011 figures preliminary. They also move when the model changes. JPL’s own January 2005 article on Sumatra gave 2.68 microseconds and a 2.5 centimetre shift of what it called the mean North Pole; the 2011 article gives a figure-axis shift of about 7 centimetres, and neither article explains the difference. This page uses the 2011 set for all three quakes so they are compared like for like. The axis shift happens inside the planet’s wobble; it does not tilt the Earth in space.
- 1.8 µsshorter day, Japan 2011 (M9.0)
- 6.8 µsshorter day, Sumatra 2004 (M9.1)
- 1.26 µsshorter day, Chile 2010 (M8.8)
- 17 cmfigure-axis shift, Japan 2011
NASA JPL, “Japan quake may have shortened Earth days, moved axis” (14 March 2011); earlier estimate: NASA JPL, “NASA details earthquake effects on the Earth” (10 January 2005).
Most of the Mediterranean may have refilled in under two years
About 5.33 million years ago the Atlantic broke through at Gibraltar and refilled a largely dried-out Mediterranean. A model puts 90% of the water in a window of a few months to two years.
The Mediterranean became cut off from the world’s oceans and mostly dried by evaporation about 5.6 million years ago, in the Messinian salinity crisis. Tectonic activity restricted the Atlantic connections, which had crossed southern Spain and northern Morocco, the Betic and Rifian corridors; the exact order in which they closed is still researched. The sea left thick salt layers that still lie under the Mediterranean. When the barrier failed, the Atlantic poured back in.
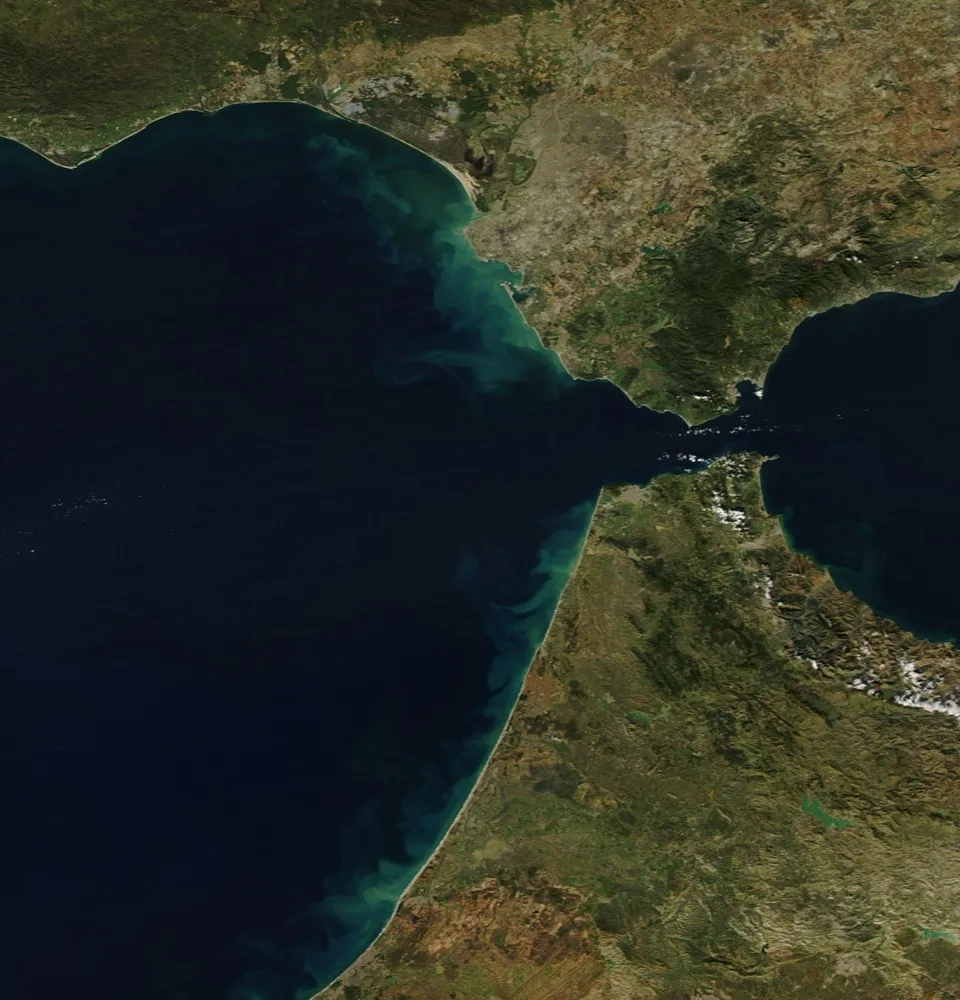

Daniel Garcia-Castellanos and colleagues traced a 200-kilometre-long channel, more than 250 metres deep in places, across the Gibraltar strait and explained it as the work of the flood itself, not of a river. Their erosion model has the flood start at low discharge, perhaps for up to several thousand years, then grow by feedback: faster water cut the channel deeper, which let in more water. At its height the flow reached about 10⁸ cubic metres a second, three orders of magnitude more than the present Amazon, with the channel deepening by more than 0.4 metres a day. They estimate that 90% of the water entered over a period ranging from a few months to two years, and that the Mediterranean’s level may briefly have risen by more than ten metres a day.
These rates are model outputs, and the authors describe the available data as limited. The salt layers and the date are well established. How far the sea fell before the flood is still argued.
Garcia-Castellanos et al., “Catastrophic flood of the Mediterranean after the Messinian salinity crisis”, Nature 462, 778 (2009), abstract; corridors and tectonic closure: Messinian salinity crisis (reference article); Amazon River (reference article).
A ship can be held back by a wave it makes itself
On a layer of fresh water over salt water, a ship can lose most of its speed to waves that exist only below the surface.
In August 1893 the polar ship Fram, off the Taymyr Peninsula in the Arctic Ocean, stalled in calm water. The expedition’s leader, Fridtjof Nansen, wrote that the ship seemed held back by some mysterious force and did not always answer the helm. In calm weather with a light cargo Fram could do 6 to 7 knots; in what sailors called dead water she could not make 1.5. Fresh water from rivers and melting ice lay as a thin layer on top of heavier salt water, and the ship’s motion stirred internal waves along the boundary between the two. Those waves carry away the ship’s energy.
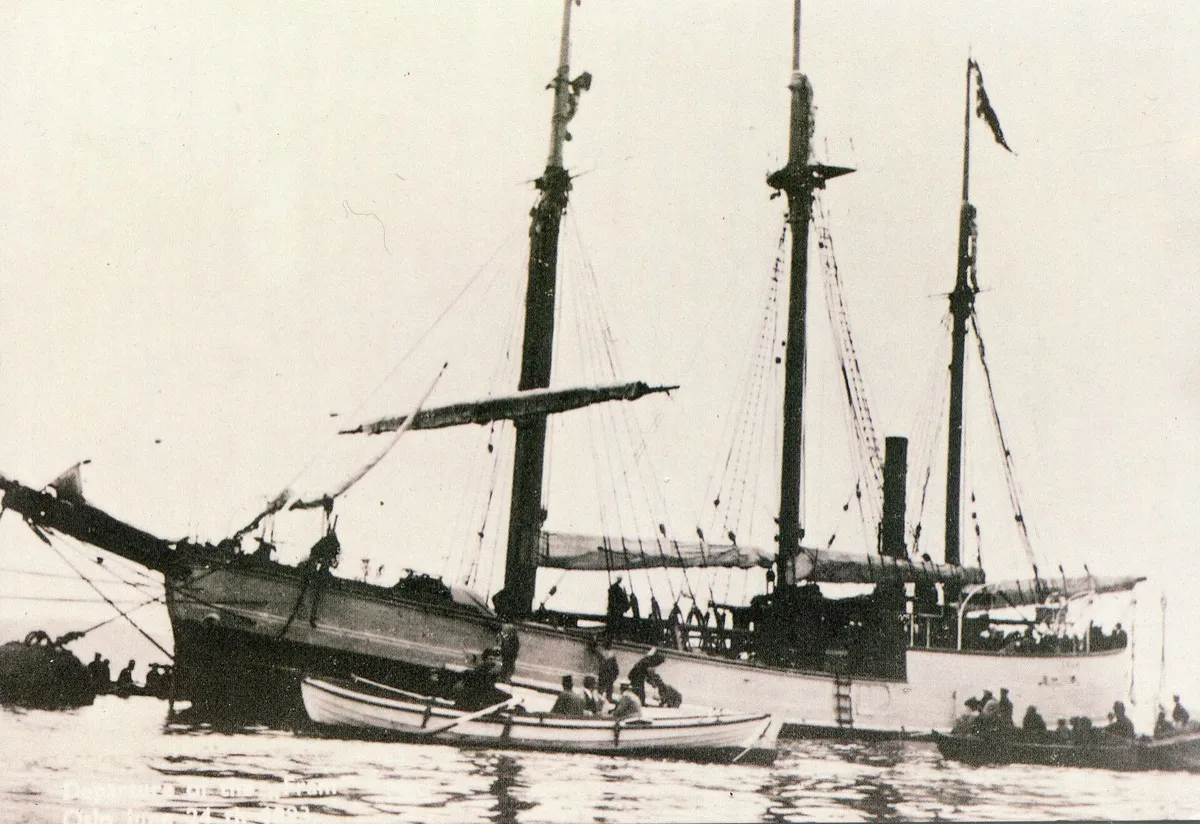

The Swedish oceanographer Vagn Walfrid Ekman reproduced the effect in a laboratory tank in 1904, towing a model over layered fresh and salt water. French physicists revived the experiments in 2011. Ekman’s tank showed a second effect: the model’s speed oscillated. Its cause stayed unclear for more than a century, until a 2020 study by Johan Fourdrinoy and colleagues showed that the speed swings come from a wave the ship makes itself, an internal undulating depression produced as it first accelerates. The ship rides back and forth on that wave like a treadmill, and with steady propulsion it eventually escapes it.
Nansen’s log as quoted in Dead water (reference article); Mercier, Vasseur and Dauxois, “Resurrecting dead-water phenomenon”, Nonlinear Processes in Geophysics 18, 193 (2011); Fourdrinoy, Dambrine, Petcu, Pierre and Rousseaux, PNAS 117, 16770 (2020). Fram’s captain on that voyage was Otto Sverdrup (Nansen’s Fram expedition).
Life has a hand in nearly half of all minerals
Of 5,659 mineral species surveyed in a 2022 study, 2,707 (47.8%) have at least one formation route that involves living things, and about a third have no other route.
Magma, volcanoes and water-rock reactions had already diversified Earth’s minerals before life began to pump oxygen into the air, a process often dated to about 2.4 billion years ago, though some researchers see traces of oxygen earlier. Oxygen reacted with rock and produced new weathered minerals, many of them copper, uranium and iron minerals, that need an oxygen-rich surface. Robert Hazen and Shaunna Morrison of the Carnegie Institution estimate that the rise of oxygen introduced more than 2,300 new species, and that 1,119 of them, 20% of all minerals, form only by oxidative weathering.
Their survey counted the formation routes of every mineral species the International Mineralogical Association had approved, using its list as of November 2020. “Biological” here is a wide net. The authors attribute more than 2,000 of the 2,707 species to near-surface oxidative weathering or alteration, alongside 597 coal-related and other taphonomic species and 603 anthropogenic species, such as by-products of mining. These groups overlap, and the paper notes that most of the mine-related minerals also form by natural processes. Only about 34%, more than 1,900 species, form exclusively through biological processes. The authors present that as lower than the estimate of two thirds, for about 4,300 species, in 2008. The only mineral they name as forming purely by biomineralization is hazenite, excreted by microbes in Mono Lake, California.
So “half” depends on what counts. Water matters more: the paper finds that 81% of species have a route through water-rock reactions, and proposes, from a timeline of mineral-forming events, that much of Earth’s mineral diversity was established within its first 250 million years, before life’s largest effects. But a large share of the variety in a museum’s mineral cabinets is a record of biology.
Hazen and Morrison, “On the paragenetic modes of minerals: A mineral evolution perspective”, American Mineralogist 107, 1262–1287 (2022) (full text on NASA NTRS). Counts, the 2,707, 34%, 603, 597, 1,119, 2,300 and the two-thirds comparison are from the abstract and conclusions. The IMA list has grown since 2020; its September 2026 edition has 6,239 valid species (IMA master list). The 2008 estimate: Hazen et al., American Mineralogist 93, 1693 (2008), about two thirds of 4,300 species.
Sea level is not level
Over the Indian Ocean, southwest of India, the geoid, the surface the sea would follow without tides, winds or currents, dips up to 106 metres below a smooth reference ellipsoid.
The sea surface is not flat, because gravity is not the same everywhere. Mass is unevenly spread inside the planet, and water piles up where gravity is stronger and sinks where it is weaker. The geoid has hills and hollows that, measured against the reference ellipsoid, run from 85 metres above it near Iceland to 106 metres below it off southern India, less than 200 metres in all.
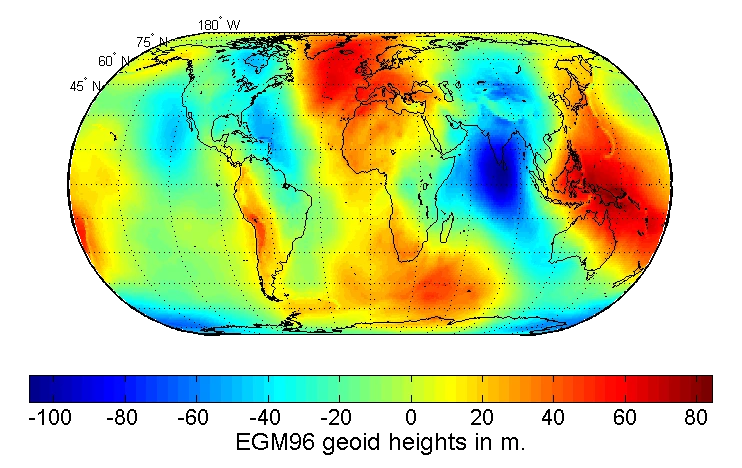

The deepest hollow, the Indian Ocean Geoid Low, covers about 3 million square kilometres, centred southwest of Sri Lanka and the southern tip of India. A Dutch geophysicist, Felix Vening Meinesz, found it in 1948 during a ship-borne gravity survey, and satellites have mapped it since. A 2023 study linked it to low-density material deep in the mantle, in a region where the floor of an ancient ocean sank. That cause is a proposal, not settled.
No ship feels the hollow as a downhill slope: the geoid is locally level, perpendicular to the direction of gravity, and the hollow is spread over thousands of kilometres. The hollow is measured against a smooth reference ellipsoid. It is not a hole in the sea, and the sea is not lower than it “should” be.
Indian Ocean Geoid Low (reference article); geoid range: Geoid (reference article); 2023 study as reported by Scientific American.
Two billion years ago, a nuclear reactor ran itself in Gabon
In what is now Gabon, uranium ore went critical on its own and ran for hundreds of thousands of years, switching on and off like a geyser.
Natural uranium today is 0.72% uranium-235. That is too little for a chain reaction in ordinary water, though reactors moderated with heavy water can run on natural uranium. But uranium-235 decays faster than uranium-238, so about two billion years ago it made up about 3.6% of natural uranium, comparable to the fuel in some modern reactors. Where rich ore sat in water, which slows neutrons and so lets the chain reaction run, the ore started fissioning.
In 1972 French chemists noticed that uranium from Oklo was missing a little uranium-235. The deficit had been burnt. Sixteen reaction sites were later mapped. In 2004 Alex Meshik and colleagues read the trapped xenon in the rock and found the reactor was pulsing: active for about 30 minutes, then dormant for about 2.5 hours while water seeped back. Their abstract calls it a cycling operation with 30-minute active pulses separated by 2.5-hour dormant periods. Live Science, reporting the work, put the average output at about 100 kilowatts, the heat output of a hundred 1-kilowatt electric heaters. Estimates of how long it ran span 150,000 years to a few hundred thousand.
Meshik, Hohenberg and Pravdivtseva, “Record of cycling operation of the natural nuclear reactor in the Oklo/Okelobondo area in Gabon”, Phys. Rev. Lett. 93, 182302 (2004), abstract; Live Science on the geyser-like cycle; discovery, sixteen sites and the 3.65% figure: Natural nuclear fission reactor (reference article); natural-uranium reactors: IAEA technical publication. A 2022 conference abstract by Meshik, Pravdivtseva and Groopman reviews the field (PDF).
The Earth hums all the time
Even on days without an earthquake, the planet rings at periods of about 2 to 8 minutes, and ocean waves are the likely cause.
A big earthquake makes the whole Earth ring like a bell, and the ringing dies away only slowly. These free oscillations had generally been treated as transient signals that follow large earthquakes. In 1998 Naoki Suda, Kazunari Nawa and Yoshio Fukao in Japan showed that it is not. Free oscillations, at frequencies between 2 and 7 millihertz, show up in seismograph records on days without any significant earthquake. That is a period of roughly 2.4 to 8.3 minutes. Their modelling indicated that the signal cannot come from adding up many small earthquakes.
In 2004 Junkee Rhie and Barbara Romanowicz at Berkeley used arrays of seismometers in California and Japan to locate the sources: the North Pacific in northern winter and the southern oceans in southern winter. The daily excitation matches an earthquake of magnitude 5.75 to 6.0, yet no summing of small earthquakes explains it. They concluded that the hum arises from interaction between atmosphere, ocean and sea floor, probably through storm energy converted into ocean infragravity waves that interact with the sea-floor topography. A 2007 study by Spahr Webb concluded that ocean waves, rather than atmospheric turbulence, drive the hum, with the strongest source waves over shallow continental shelves. An atmospheric cause had been proposed in 1998 (Kobayashi and Nishida).
You cannot hear it. It is a ground motion, far below what any person can feel.
Suda, Nawa and Fukao, “Earth’s background free oscillations”, Science 279, 2089 (1998); Rhie and Romanowicz, Nature 431, 552 (2004) and the authors’ abstract on the Berkeley Seismology Lab page; Webb, Nature 445, 754 (2007); Kobayashi and Nishida, Nature 395, 357 (1998).
Sweden is still rising from the ice age
The land around the Gulf of Bothnia is rising by up to nearly one centimetre a year, because the ice sheet that pressed it down is gone.
At the Last Glacial Maximum, about 20,000 years ago, an ice sheet as much as 3,000 metres thick lay over the Baltic region. NASA’s Earth Observatory notes scientists estimate it pressed the land down by more than 500 metres. The ice has gone, but the mantle flows back slowly, so the land rises like a mattress after you stand up. The rise has not finished, and it is among the fastest on Earth: by one estimate about 700 hectares of new land emerge from the sea each year along the Gulf of Bothnia.
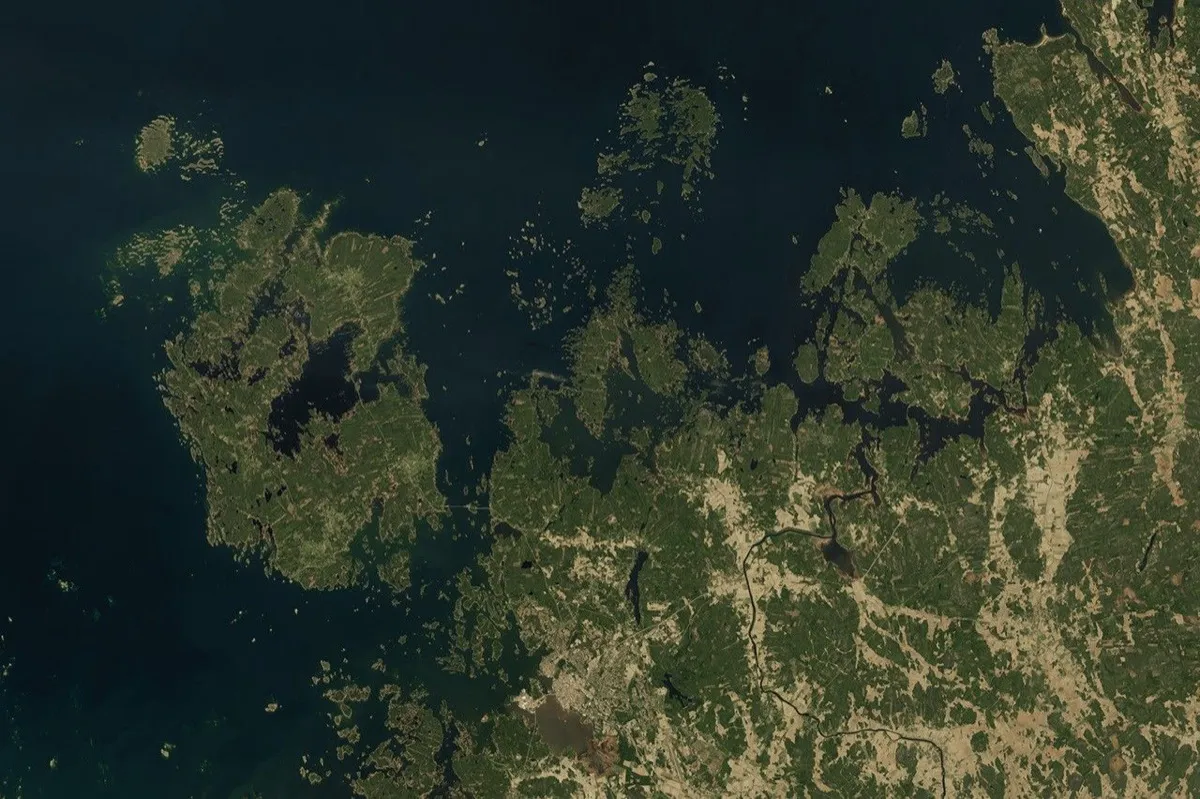

The Swedish weather service SMHI gives the maximum as just under 10 millimetres a year in the northern Kvarken area, from the Nordic model NKG2016LU, which Lantmäteriet provides. On the High Coast the land has risen almost 300 metres since the last ice age. In the far south of Sweden, where the ice was thinner, uplift is about 0.8 millimetres a year. Where it is greatest the land has risen almost a metre in the last 100 years, while global mean sea level rose just over 20 centimetres, so the sea appears to fall along that coast even as the ocean rises.
Try it: pick a place, set the years, and see how much the land rises.
SMHI, “Landhöjning och vattenstånd”; NASA Earth Observatory, “Uplift Underway in Finland’s Kvarken Archipelago” (26 December 2024); Lantmäteriet, NKG2016LU presentation.
In Antarctica, a pond that stays liquid down to −50 °C
Don Juan Pond, in a valley where the air ranges from −50 °C to +10 °C, is nearly half salt by weight and can remain liquid to −50 °C.
Don Juan Pond sits in Wright Valley, part of the McMurdo Dry Valleys, one of the driest and coldest places on Earth. It is about 100 by 300 metres and about 10 centimetres deep on average. First visited in 1961, it was named after the expedition’s helicopter pilots, Donald Roe and John Hickey. The water is a dense, syrupy brine rich in calcium chloride, almost 45% salts by weight. The unique salts lower the freezing point, so a pond can exist where the air runs from −50 °C to +10 °C. Seawater, by comparison, freezes at about −1.8 °C.
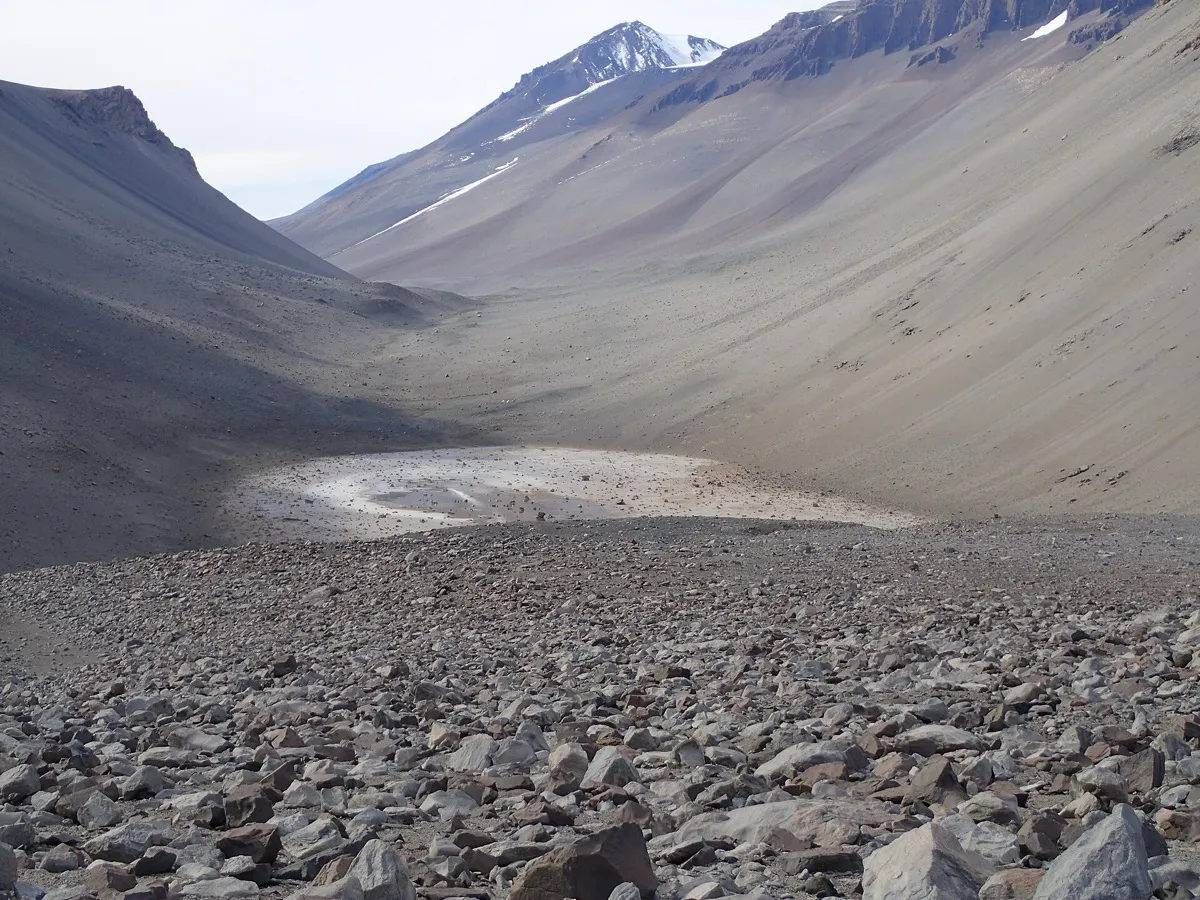

Where the water comes from has been argued for decades. The pond was long believed to be fed by deep groundwater. A high-profile 2013 paper suggested instead that shallow moisture seeps on the valley slopes, like the recurring slope lineae seen on Mars, carried salts downhill. In 2017 a University of Washington study led by Jonathan Toner used a model of how salty water changes during evaporation, freezing and different water and salt inputs, and concluded that the pond is fed by deep groundwater. His calculations also give a turnover of the pond’s water about every six months, so it must leave by an unseen underground outflow. It is a modelling result, and Toner said that after 60 years of study nobody knew exactly where the water comes from.
The pond matters for Mars. The University of Washington release quotes Toner saying that if there is water on Mars it will probably look a lot like this pond, and NASA Astrobiology presents it as a clue to what stores of liquid water on Mars might look like.
University of Washington, “Salt pond in Antarctica, one of saltiest waters on Earth, is fed from beneath” (2017); NASA Astrobiology (2017); seawater: NSIDC, “Science of sea ice”.
Where each claim comes from
Every fact above ends with its references. Primary papers and agency pages are linked where they open to read; where a figure comes from a reference article, the line says so. Photographs are public domain or licensed as stated under each one.
What is estimated or still open
- Quakes and day length. The microsecond figures are modelled from fault slip and were revised between JPL’s 2005 and 2011 articles (Sumatra: 2.68 then 6.8 microseconds). Treat them as “about”.
- Mediterranean flood. The flow, duration and daily rise are model results, and the authors call the available data limited. The 90% figure applies to the main flood, which may have followed thousands of years of slow inflow.
- Minerals and life. The share depends on how “involves life” is counted: about two thirds in 2008, 47.8% with some biological route and about 34% with only biological routes in 2022. The 603 anthropogenic minerals are inside the larger figure, and most also form naturally.
- Oklo. How long the reactors ran is estimated at between about 150,000 and a few hundred thousand years. The uranium-235 share of 3.6% is worked out from decay rates and the 2-billion-year age; other dating gives about 1.7 billion years and about 3.1%.
- Dead water. The Nansen drag is established. The oscillating drag named after Ekman was explained in 2020 by a transient wave the ship generates; that explanation rests on a model and laboratory experiments.
- Indian Ocean low. The size is measured. The mantle explanation from 2023 is a proposal.
- The hum. Ocean waves are the leading explanation of what drives it. Atmospheric forcing was proposed in 1998; the 2007 study found waves, not air turbulence, to be the driver.
- Uplift. SMHI gives the peak as just under 10 millimetres a year. The slider holds today’s approximate rates constant. The postglacial component slows at an exponentially decreasing rate, while ongoing ice loss can also change uplift (SMHI), so the results are illustrations, not forecasts (Post-glacial rebound, reference article).
- Don Juan Pond. Its source is argued; the 2017 study is a model. The University of Washington gives the salt share as almost 45% by weight.