mariuscomper.ukRO
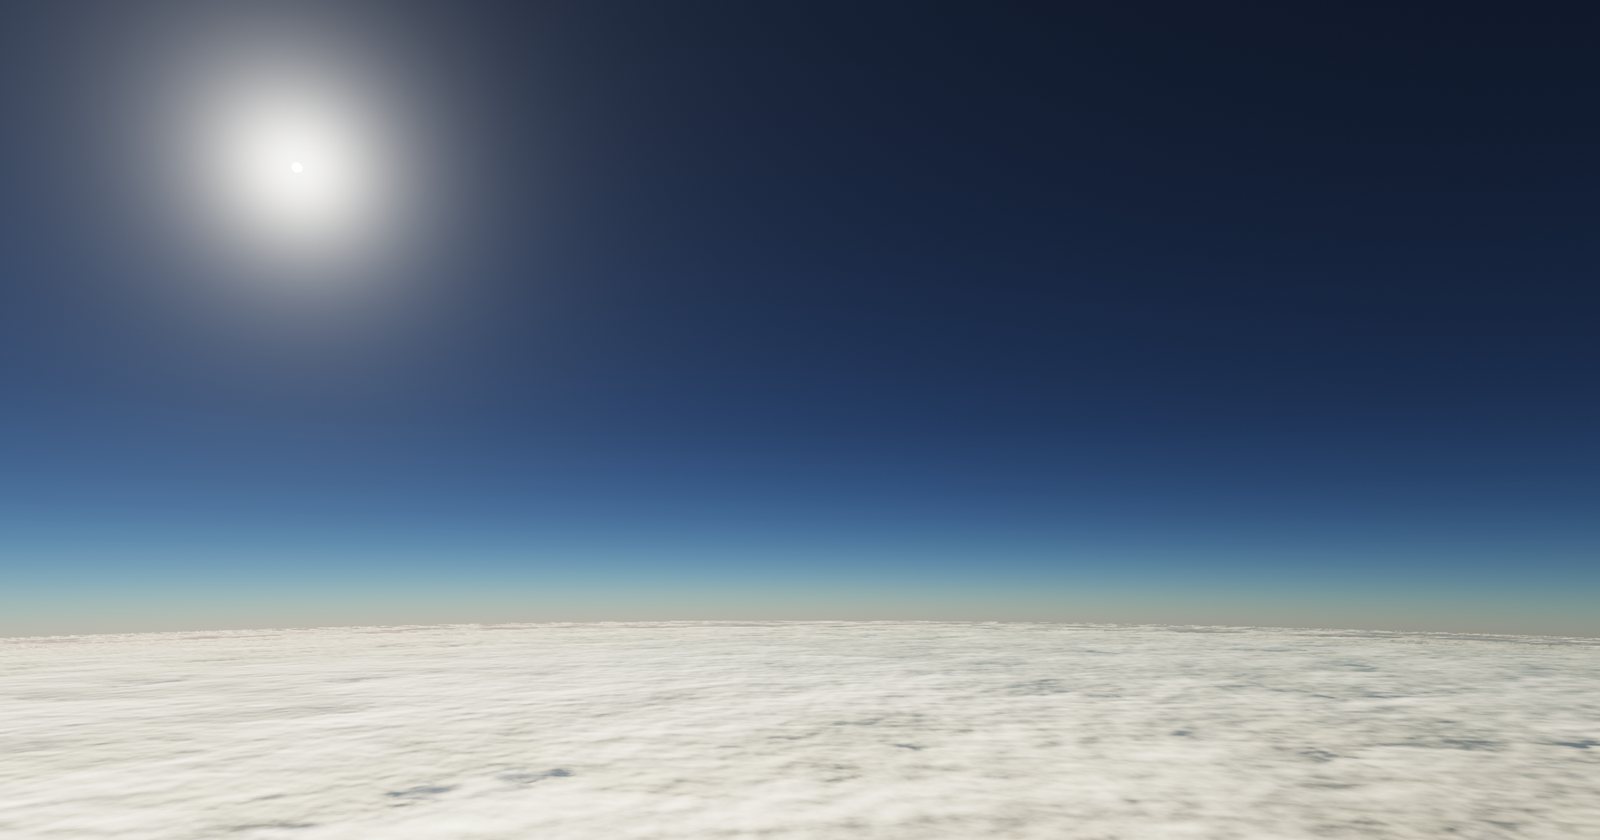
The sky seen from a weather balloon above Bucharest: a curved horizon, a cloud deck below, dark blue sky above.
Weather balloon · Bucharest-Băneasa · 44.51° N

The Băneasa balloon: the air above Bucharest

10 January 2021: a balloon rose from Băneasa to 27.9 km. The wind reached 67 m/s at 10.8 km, and at 11 km the air was −62 °C. The sky below is drawn from the data of that flight. Scroll to climb, then pick another day.

Since 1950, balloons with measuring instruments have been released at Băneasa: almost daily from 1957, twice a day from 1965, with gaps in the 1990s. The NOAA archive has 58,748 releases; 50,003 are drawn here (temperature and usually humidity and wind), up to 20–30 km in recent years.

Climb Another day

The launch site: Băneasa, 90 m

10 January 2021, released at 11:03 UTC. At the ground: 2.0 °C and 1,013 hPa. From here to the top the radiosonde sends at each level the pressure with temperature and humidity, the wind, or both; this flight has 104 records.

The clouds of the day

Layers where relative humidity passes 90% (air close to saturation, often cloud): from 90 to 3,125 m; from 3,750 to 4,125 m. In the picture each one is a cloud deck; where it sits and how thick it is come from the measurement, its shape is drawn.

Wind: 67 m/s at 10.8 km

The strongest wind below 16 km: 67 m/s (242 km/h), from the west, at 10.8 km. Clouds at different altitudes slide past each other at the measured speed, and the balloon is carried along with the wind. The median of the strongest wind in a flight, among the flights with full data in 2000–2025: 31 m/s in January, 26 m/s in July.

The tropopause: 11 km, −62 °C

Up to here the air cools with altitude; above it the temperature stops falling or even rises. The World Meteorological Organization rule, searched here only above 5 km: the first level from which cooling does not exceed 2 °C per kilometre, on average, over the next 2 km. The median, among the flights with full data in 2000–2025: 10.8 km and −61 °C in January, 11.5 km and −53 °C in July.

At 20 km: 6.8% of the density at the ground

The pressure is 52 hPa. The sky is blue-black because the air is thin: few molecules are left to scatter sunlight. Pressure and density are computed from the ground pressure and the measured temperature; the colours come from a light-scattering calculation on the density of this flight.

The last measurement: 27.9 km

The record stops here: 14 hPa, −57 °C. The archive does not keep the balloon's position; from the wind it follows (a calculation, assuming a climb of 5 m/s) that it had drifted about 208 km to the east of Băneasa.

Pick a day

From January 1950 to November 2026. Try the day you were born, or the day of a storm; then pick the night or the midday release. If the chosen day has no flight, the nearest day that has one appears; before 1965 most flights are night flights.

Release

The flight of 10 January 2021, released at 11:03 UTC: it climbs to 27.9 km.

The year seen from the balloon

The median of the 2000–2025 measurements, by month and altitude, in the 00 and 12 UTC flights with at least 40 levels each of temperature, wind and humidity (about half of the flights). The dashed line is the median tropopause. Dark cells have fewer than 150 measurements.

Move the cursor or touch the figure.
−70 °C+15 °C

In winter the wind below 16 km is stronger (median of the strongest wind in a flight: 31 m/s in January, 26 m/s in July), and the tropopause is lower and colder (10.8 km and −61 °C in January, 11.5 km and −53 °C in July).

The balloons climb higher and higher

The median altitude reached was 16.5 km in the 1980s, 25.2 km in the 2010s and 23.5 km in 2020–2026. The records in a flight rose from 23 to 117 (levels with a temperature: from 18 to 41). The difference most likely comes from instruments and procedure, not from climate. The yearly median falls to 20–22 km in 2023–2025 and to about 16 km so far in 2026; the archive does not say why.

1020301950: 9.2 km, 15919501951: 9.0 km, 1481952: 12.3 km, 1061953: 13.8 km, 1661954: 11.4 km, 571955: 13.3 km, 1051956: 14.2 km, 2871957: 19.0 km, 2461958: 18.6 km, 3161959: 16.9 km, 3301960: 17.6 km, 34319601961: 17.4 km, 3281962: 16.5 km, 3431963: 18.4 km, 3101964: 16.6 km, 3411965: 16.7 km, 2551966: 16.4 km, 2631967: 16.6 km, 4841968: 18.2 km, 5781969: 16.7 km, 5741970: 16.7 km, 66219701971: 18.7 km, 10641972: 16.6 km, 8001973: 19.3 km, 12531974: 18.4 km, 13371975: 18.4 km, 13451976: 16.6 km, 13071977: 16.6 km, 10871978: 16.5 km, 9961979: 16.5 km, 11571980: 16.4 km, 135919801981: 16.6 km, 14171982: 18.2 km, 12841983: 17.9 km, 10601984: 18.2 km, 10601985: 16.6 km, 10581986: 16.5 km, 10021987: 16.4 km, 10421988: 16.3 km, 9341989: 16.3 km, 8891990: 16.0 km, 25819901991: 16.3 km, 2351992: 12.1 km, 1761993: 23.9 km, 2781994: 21.6 km, 3201995: 23.6 km, 4621996: 16.5 km, 3301997: 16.6 km, 3041998: 19.0 km, 3231999: 22.6 km, 3622000: 22.8 km, 35920002001: 22.9 km, 7252002: 23.0 km, 7262003: 23.2 km, 7222004: 23.6 km, 7262005: 23.9 km, 7292006: 23.1 km, 7282007: 23.6 km, 7292008: 23.4 km, 7292009: 23.4 km, 7282010: 23.5 km, 72920102011: 24.0 km, 7302012: 24.4 km, 6442013: 26.0 km, 7302014: 26.1 km, 7302015: 25.3 km, 7282016: 25.0 km, 7282017: 25.8 km, 7292018: 25.7 km, 7272019: 25.6 km, 7252020: 25.1 km, 73120202021: 26.8 km, 7282022: 26.1 km, 7302023: 20.5 km, 7282024: 20.1 km, 7302025: 22.0 km, 7292026: 16.1 km, 626

Median altitude reached, by year (km). Orange: years under 10,000 m. 2026: up to 11 November.

What the picture shows and what it does not

  • Measured: the ground pressure, temperature, humidity and wind at each level, and the release time (when the archive has it). Computed: the heights (from temperature, anchored to the reported heights, which they reproduce to a median of 10–37 m per flight depending on the year), the density, the drift and the position of the Sun. Drawn: the shape of the clouds, the stars, the colour of the ground (chosen by season) and Bucharest, as a grey disc by day and a glow at night; it is not a map.
  • The climb is assumed to be 5 m/s; for most levels the archive does not keep the time since release. The position of the Sun and the drift are therefore estimates.
  • A cloud deck appears where relative humidity passes 90% below 14 km. Humidity sensors are less reliable in cold air, and a moist layer is not a cloud observation.
  • In the 1950s a flight has a median of 15 records, in 2020–2026 117; the picture of an old day has less detail and a lower top.
  • Of the 58,748 flights, 50,003 are used. The rest lack even three temperature levels (mostly the wind-only flights at 06 UTC) or lack a ground level or have computed heights more than 250 m from the reported ones (more than half of the flights of 1965–66).
  • The Moon is absent, and the stars are drawn at random: they are not the real sky of the chosen day.

Sources

  • The flights: Integrated Global Radiosonde Archive v2, station ROM00015420 (Bucharest-Băneasa), NOAA NCEI, file downloaded on 14 November 2026. ncei.noaa.gov. Durre, Vose and Wuertz, “Overview of the Integrated Global Radiosonde Archive”, Journal of Climate 19 (2006), 53–68.
  • Tropopause: the World Meteorological Organization lapse-rate definition (1957). Solar position: the NOAA solar algorithm (after Meeus). Station height: 90 m, from the IGRA station list.
  • The sky: Rayleigh scattering (coefficients 5.8, 13.5 and 33.1 ×10⁻⁶ m⁻¹ at sea level) and an aerosol layer of 21×10⁻⁶ m⁻¹ with a 1.2 km scale height, values common in sky rendering. The aerosols are assumed, not measured; the air density is that of the flight.