mariuscomper.uk Română
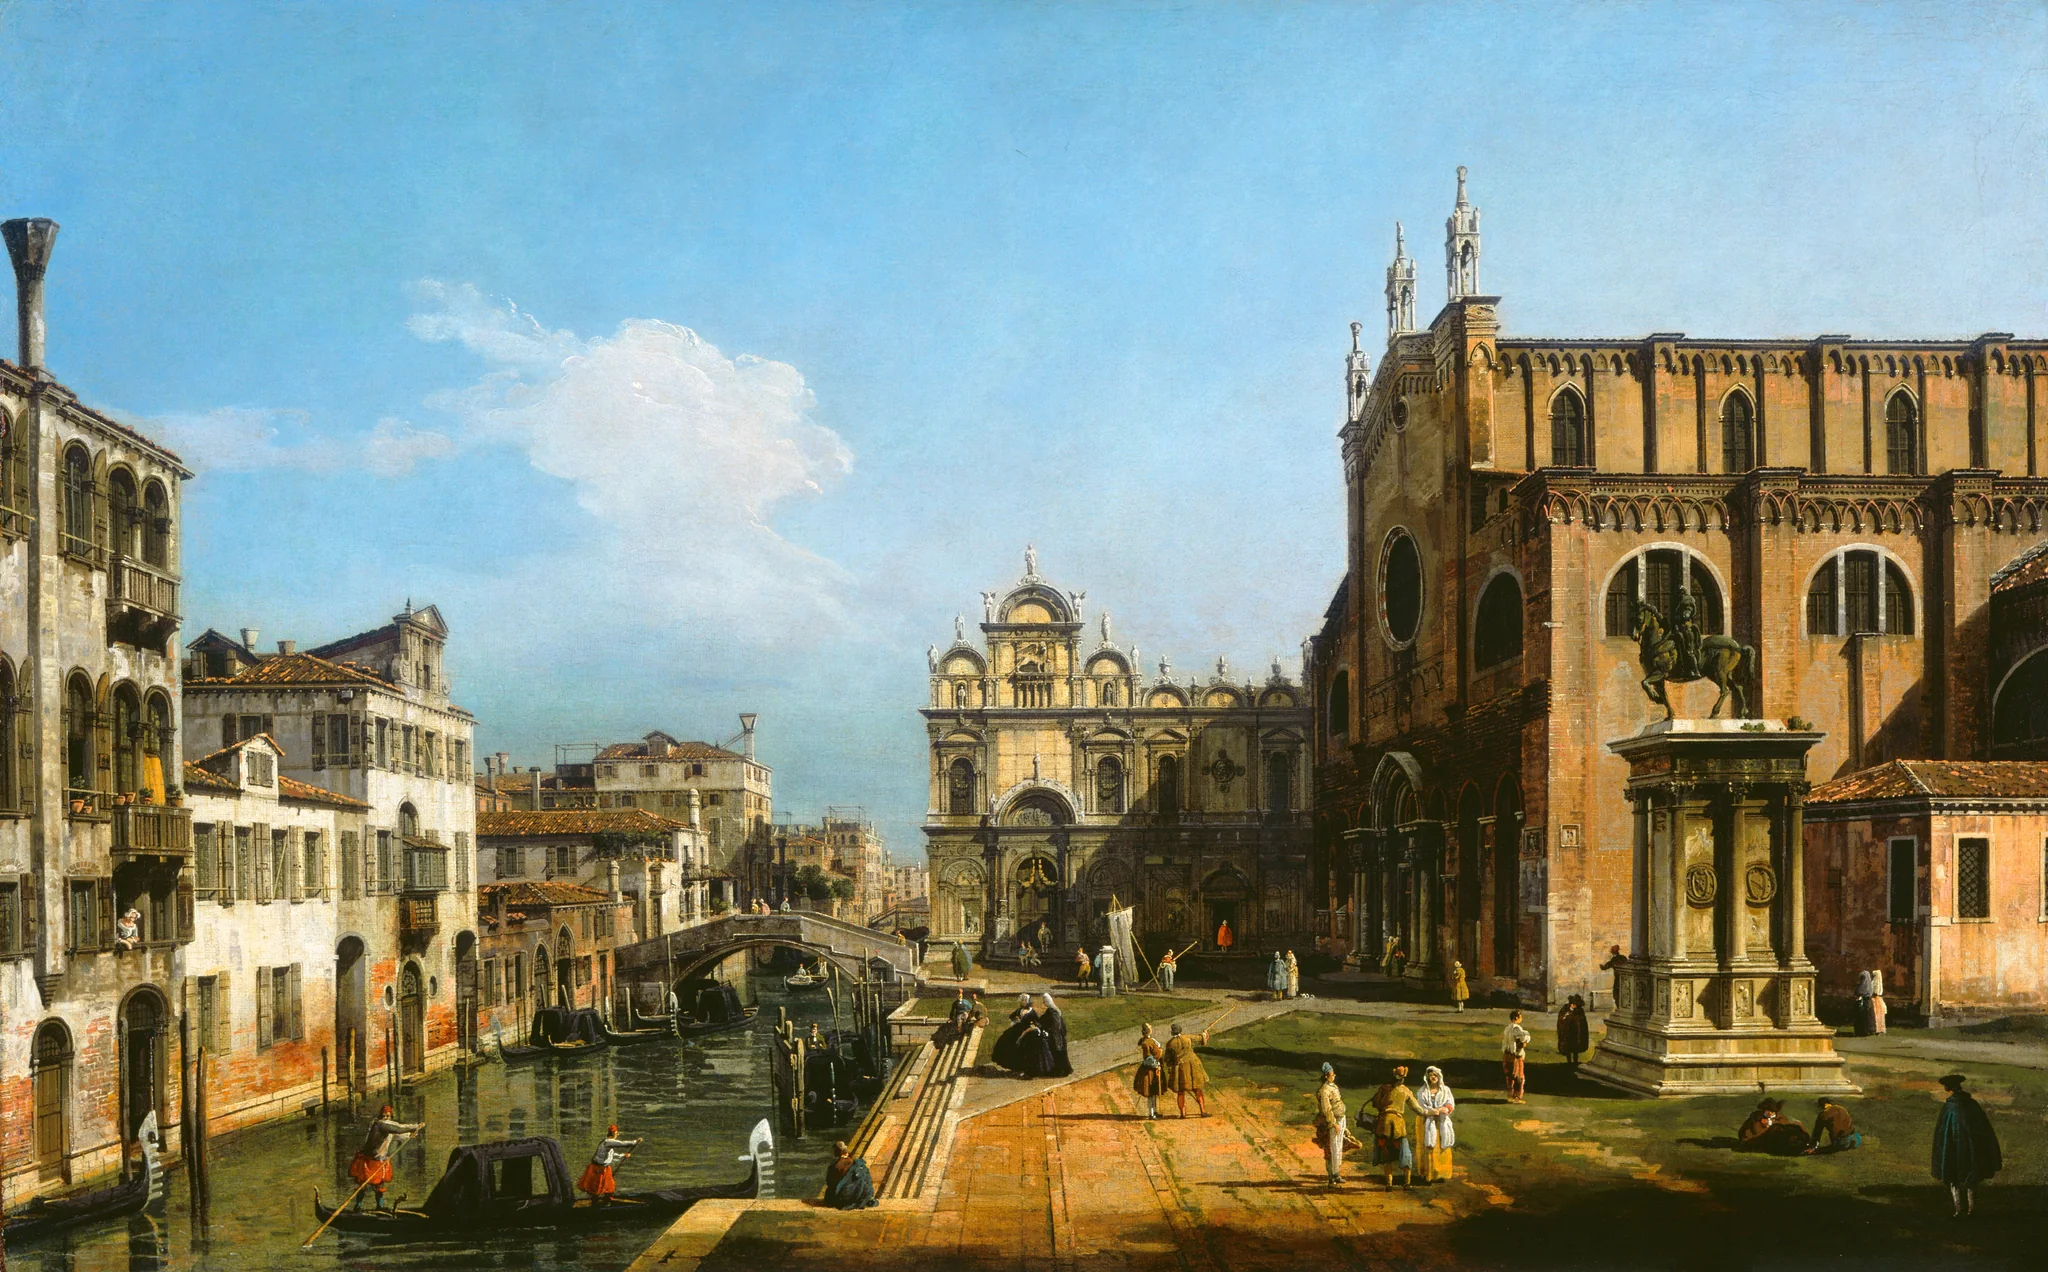
Bellotto’s painting of Campo Santi Giovanni e Paolo.
Bernardo Bellotto, The Campo di SS. Giovanni e Paolo, Venice, 1743/1747 · National Gallery of Art, Washington · CC0

The painting as an instrument

A painting from about 1745 shows how high the sea reached in Venice

The green-brown band at the foot of the walls, painted by Canaletto and Bellotto, shows how high the tide and small waves wet the stones in the 1700s. Dario Camuffo and Giovanni Sturaro compared it on 12 paintings with the same buildings today. Brought up to 2025 with the tide gauge, their measurement shows the sea has risen relative to the city by about 74 ± 12 cm.

#The band at the foot of the walls

Between 1743 and 1747 Bernardo Bellotto, Canaletto’s nephew and pupil, painted Campo Santi Giovanni e Paolo, a square (campo) in the Castello district. Like his uncle he probably worked with a camera obscura: a box with a lens that projected the scene onto paper so the painter could trace it. At the foot of the houses on the Rio dei Mendicanti, the small canal (rio) beside the square, he left a thin green-brown band.

Venetians called it the comune marino, the “common sea level”. It is algae that grow as high as the ordinary high tide and its small waves wet the wall. The city used its upper edge as a reference for building and for digging canals, and sometimes carved it into the stone with the letters CM.

#One water door, then and now

Bellotto, 1743/1747Photograph, 17 May 2015
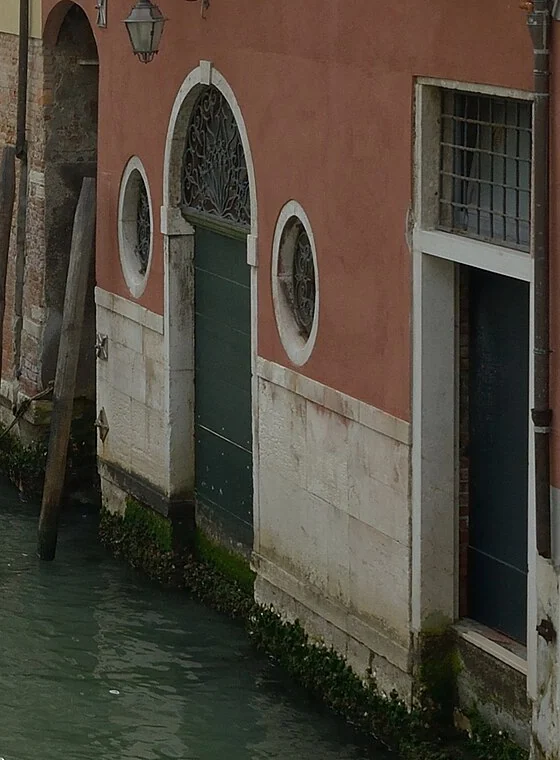
Bellotto, 1743/1747Photograph, 17 May 2015 · W. Moroder, CC BY-SA 3.0

In the painting, the door between the two round windows has two dry steps between its sill and the algae band. In Wolfgang Moroder’s photograph of 17 May 2015, the same door has its sill under water and algae growing on the door itself. Today’s stone base is taller than the one Bellotto painted: the house has been refaced since.

If the steps had the usual Venetian height of 17.5 cm, the sill stood about 35 cm above the band: +38 cm on Venice’s tide-gauge zero (the mean sea of 1885–1909). Today’s algae line, around +84 cm, would sit above it, if the sill has not been moved. Camuffo and Sturaro report a door with two steps above the band on a Bellotto view of the same campo dated 1741; on the building, around 2000, the algae line sat 77 ± 10 cm higher.

#The algae mark the tide and its waves

The lagoon rises and falls twice a day. Algae grow as high as the tide and its small waves regularly reach; above that the stone dries out. Today their upper edge sits 47 ± 2 cm above mean sea level and 17 ± 2 cm above average high tide, according to Camuffo, Bertolin and Schenal (2017).

On the canvas the water now shows the average tide of 2025. The gold line shows where the algae stop today; the pale line below it is the band Bellotto painted.

#Twelve paintings out of two hundred

Camuffo and Sturaro looked for the band in about 200 views by Canaletto and Bellotto. They found 17 that could be used and kept 12, those whose buildings have stayed unchanged since the 18th century, painted between 1727 and 1758. On each building they measured on site how far today’s algae line sits above the painted one.

On average by 69 ± 11 cm. After taking off 8 cm added by motorboat wakes and by the higher tide since the deep channels were dug, 61 ± 12 cm of sea rise remain up to about 2000: 2.3 ± 0.4 mm a year. The tide gauge at Punta della Salute, started in 1872, gives 2.4 ± 0.1 mm a year for 1872–2000. The chart sets their measurement beside the gauge.

#From Bellotto to today: 74 cm

The gauge mean for 2025 is 12.6 cm above the 1993–2002 mean, the period Camuffo and Sturaro use as “today”. Added to their measurement, the sea now stands about 74 ± 12 cm higher relative to the city than in 1727–1758. The algae line, which also climbs with motorboat wakes, would sit about 82 cm above the painted one. On the canvas the water is at the average high tide of 2025.

For the tide-gauge period, 1871–2014, Camuffo, Bertolin and Schenal estimate that the city sank by 1.5 ± 0.3 mm a year and the sea rose by 1.0 ± 0.3 mm a year. That sinking includes about 10 cm in 1950–1970, when industry pumped water out of the ground.

#In 2100

Zanchettin and colleagues (2021) give for Venice, against the 1986–2005 mean and with subsidence of 1 mm a year: +47 cm (32–62) with low emissions (RCP2.6), +81 cm (58–110) with high emissions (RCP8.5) and, in an extreme and unlikely case of fast ice-sheet melt, about 180 cm. On Venice’s tide-gauge zero that is a mean level of +70, +104 and +203 cm.

With high emissions, average high tide would reach about +134 cm: above the canal-side edge of the campo (+107 cm) and above the level of about +110 cm usually taken as the reference for raising the MoSE barriers, which first protected the city on 3 October 2020. The canvas shows the water without the barriers.

#Move the year and tap the buildings

The water on the canvas is the average high tide of the year you choose. Up to 1871 the level is a straight line between the paintings and the gauge’s first year; from 1872 to 2025 it is each year’s gauge mean; after 2025, a curve that starts at today’s rate and ends at the 2100 value. Tap a building to see how high it stands against today’s high tide and that of 2100.

Tide

#Questions

How precisely could Canaletto paint?

The camera obscura helped him get the outlines, but the paintings were finished in the studio and some views were repeated. Camuffo and Sturaro preferred the first version of each view and compared façade proportions with the buildings today. The scatter of the 12 measurements stayed under 12 cm, including the year-to-year wander of the algae level itself (3.8 cm).

Is it the sea, or is Venice sinking?

Both. The algae and the tide gauge measure the sea relative to the city. For 1871–2014, subsidence is put at 1.5 ± 0.3 mm a year and the sea’s own rise at 1.0 ± 0.3 mm a year. Satellite radar for 2008–2011 gave a subsidence of 1.1 ± 1.0 mm a year for the city (Tosi and colleagues, 2015).

Doesn’t MoSE protect the city?

The barriers rise for storm tides, at around +110 cm, and close the lagoon for a few hours. They cannot keep it closed at every high tide: if mean sea level rises far enough, they would have to rise twice a day. Since 2020 ISPRA publishes two series for Venice; this page uses the one that fills closure days with the level of the open sea.

Why this painting?

It shows buildings that still stand, a visible algae band and a water door that can be found in a dated photograph. Camuffo and Sturaro worked on a Bellotto view of the same campo dated 1741. The National Gallery of Art image is free (CC0) and large enough to show the stones.

#How this page was made

The measurement from the paintings is Camuffo and Sturaro’s, taken on site on 12 buildings. Their arithmetic is redone here: the points in their figure give a mean level of about -36.2 cm on Venice’s tide-gauge zero; the gauge mean for 1993–2002 is +24.8 cm, and the difference, 61 cm, is their corrected value. A further 12.6 cm up to 2025 gives about 74 cm; the ± 12 cm margin is their study’s.

An independent measurement was also attempted, on paintings and Wikimedia Commons photographs, with a protocol written down beforehand. It did not work: on the 11 paintings examined, the water steps are covered by gondolas or lie in shadow, and the painted proportions are not accurate enough to turn pixels into centimetres. One bound survived: at the door between the round windows, the band has climbed more than two painted steps, which agrees with Camuffo’s measurement.

The water on the canvas is a reconstruction, not a measurement. Each pixel gets a height: the painted canal sits 8 cm below the painted band, and walls and people are measured upward from where they meet the water or the pavement, with an assumed perspective (the painting’s horizon and the painter’s eye about 3.6 m above the campo, chosen so that the painted figures stand 171 cm tall near and far). The campo has its 2010 surveyed heights; it has been raised gradually since the 18th century, so this is today’s campo.

Average high tide is taken as 30 cm above mean level (47 − 17 cm, Camuffo and colleagues, 2017). Before 1872, the level is a straight line from the paintings to the gauge’s first year. The curves after 2025 are not a year-by-year forecast: they start at today’s rate and end at Zanchettin and colleagues’ 2100 values.
#Sources

Images

Every number on the page is generated from these sources; none is typed in by hand.