The colours of Bucharest, from space
How blue is Bucharest?
Barely: 0.15% of the city's pixels are blue in the 22 August 2026 image. The lakes look green or dark teal; the blue identified on the map is on roofs and in swimming pools. The colour wheel shows the city in every other hue.
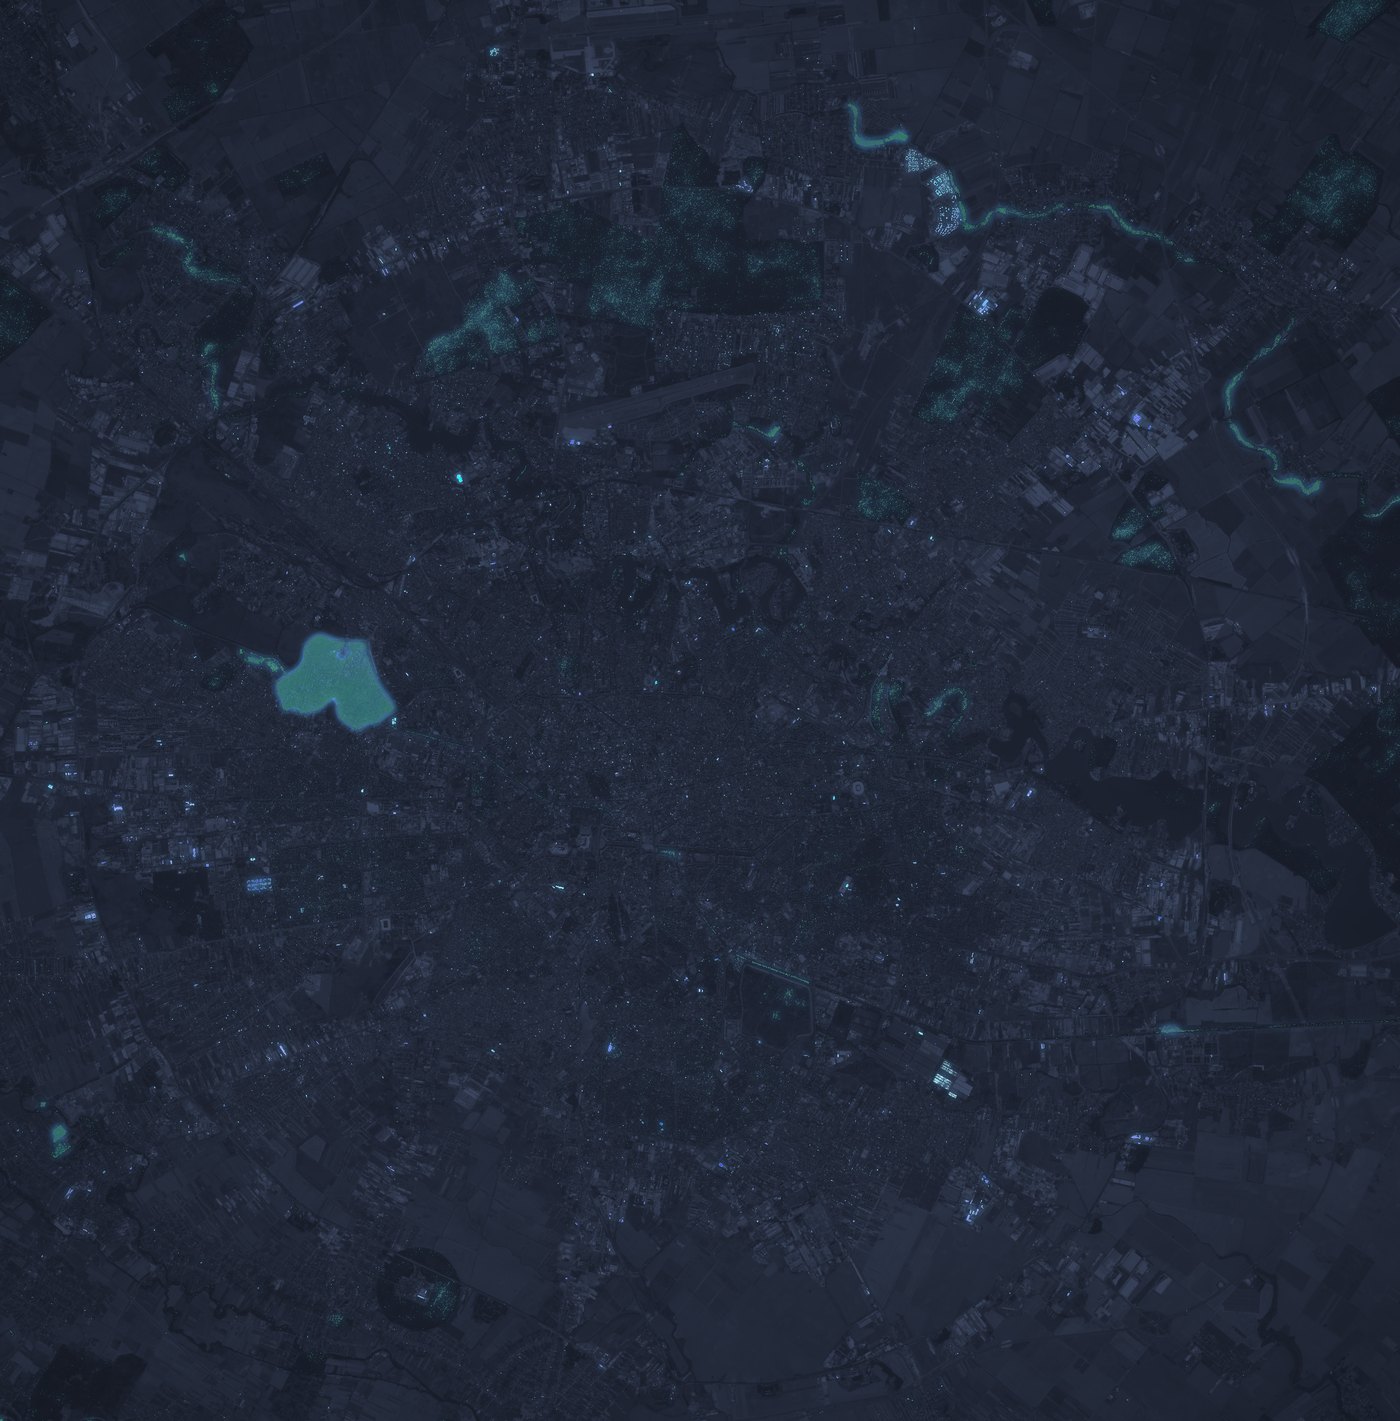
The bars around the wheel show how many of the city's pixels have each hue (log scale). Drag the wheel, or tap the map to pick the colour of a pixel. On a touch screen, two fingers move and zoom the map.
0.15% of the city's pixels are blue.
Places where the colour appears
Are Bucharest's lakes blue?#
No, not in these ten images. On 22 August, lakes Floreasca, Tei, Plumbuita, Străulești and Pantelimon are green (hues from 131° to 141°). The closest to blue is Lake Morii: dark grey-teal, 184°. Hue is measured in degrees on the colour wheel: 0° red, 120° green, 240° pure blue; here, blue starts at 205°. The hue of the mean colour of none of these eight lakes goes above 184° in any image.
| Lake | Area | 22 August 2026 | 3 February 2026 |
|---|---|---|---|
| Lacul Morii | 236.7 ha | hue 184° | hue 161° |
| Lacul Herăstrău | 77.8 ha | hue 93° | hue 167° |
| Lacul Floreasca | 50.9 ha | hue 135° | hue 165° |
| Lacul Tei | 48.7 ha | hue 134° | hue 165° |
| Lacul Plumbuita | 40.1 ha | hue 131° | hue 160° |
| Lacul Străulești | 32.7 ha | hue 141° | — |
| Lacul Pantelimon | 14.2 ha | hue 137° | hue 182° |
| Lacul Cișmigiu | 2.0 ha | hue 117° | — |
Herăstrău looks grey-green on 22 August; the image does not show why.
In the 3 February image, 91% of the city's pixels are classified as snow and the lakes look dark teal. The colour of water seen from space can be influenced by algae, sediment and depth; the table shows the hues in each image, not their cause.
Where is the blue in Bucharest?#
In small patches: inside the city boundary, no patch of blue pixels sharing an edge is larger than 0.87 hectares, and the largest is at the Valrom hall. As far as OpenStreetMap shows, the places below are a market, an industrial hall and apartment blocks, plus one swimming pool; the colour of roofs is read from the image. Turquoise (blue-green) is mostly found in one place: on 22 August, 72% of the city's turquoise pixels are in Lake Morii.
Blue
- Piața Progresul market. Blue patches on the roofs around the market, in Sector 4. 0.46 ha of blue pixels around the spot · On the map · Open in OpenStreetMap
- Ștrand Berceni pool complex. A swimming pool of the complex, tagged as a pool in OpenStreetMap, in Sector 4. 0.17 ha of blue pixels around the spot · On the map · Open in OpenStreetMap
- The Valrom hall. The industrial building tagged Valrom in OpenStreetMap, in the west of the city, in Sector 6: the largest blue patch in the city. 0.87 ha of blue pixels sharing an edge · On the map · Open in OpenStreetMap
- Blocks on Aleea Masa Tăcerii. A residential estate in Sector 6; the blocks' roofs look blue in the image. 0.59 ha of blue pixels around the spot · On the map · Open in OpenStreetMap
Turquoise
- Lake Morii. The city's largest lake looks dark grey-teal in the 22 August image. Of the eight lakes measured, its mean hue is the closest to blue. It holds 72% of the city's pixels classified as turquoise. 236.7 ha · mean hue 184° · On the map · Open in OpenStreetMap
- Lagoon Park. The pool of a leisure complex in the north of the city, in Sector 1, shows up bright turquoise. 0.76 ha of turquoise pixels around the spot · On the map · Open in OpenStreetMap
- Dinamo open-air pool. The open-air swimming pool at Dinamo, in Sector 2. 0.17 ha of turquoise pixels around the spot · On the map · Open in OpenStreetMap
Red
- The hall near CFR Grivița. A red area of 2.52 hectares on the industrial building in the Grivița area, in Sector 1. 2.52 ha of red pixels around the spot · On the map · Open in OpenStreetMap
- Tennis courts. A group of tennis courts (numbered 3–8 in OpenStreetMap), in Sector 2, which the image shows red. 0.77 ha of red pixels around the spot · On the map · Open in OpenStreetMap
If every pixel where blue exceeds red (with blue-band reflectance above 0.04) is counted, the share rises to 7.3%. That total mostly consists of near-grey pixels and green or green-cyan ones (vegetation, bare ground, water) where blue is only slightly above red; only about 2.0% of these pixels are blue.
The areas in the lists, except the one for the Valrom hall, are computed from pixels with the stated hue, a chroma of at least 0.14 and brightness above 0.25, within 60–140 m of the spot. For Valrom a single patch is measured, with the chroma threshold of 0.05.
Which sector has which colour?#
Each cell shows the share of the sector's pixels whose hue is within 25° of the column's colour. Sector 1 has the highest share of green pixels (19%), Sector 5 the lowest (7.1%) and the highest share of orange (51%). In Sector 6, turquoise pixels are 5.5% of the total, mostly from Lake Morii.
| Sector | Red | Orange | Yellow | Green | Turquoise | Blue | Violet |
|---|---|---|---|---|---|---|---|
| Sector 1 | 9.6% | 38% | 26% | 19% | 0.61% | 0.10% | 0.03% |
| Sector 2 | 14% | 39% | 21% | 14% | 0.31% | 0.15% | 0.06% |
| Sector 3 | 12% | 40% | 23% | 9.9% | 0.23% | 0.12% | 0.07% |
| Sector 4 | 14% | 43% | 21% | 15% | 0.22% | 0.17% | 0.04% |
| Sector 5 | 15% | 51% | 27% | 7.1% | 0.13% | 0.10% | 0.03% |
| Sector 6 | 7.1% | 35% | 25% | 15% | 5.5% | 0.27% | 0.04% |
Hues overlap, so rows do not add up to 100%. Pixels whose channel gap is below 0.05, or that fall outside every window, appear in no column but stay in the sector total.
How it was measured#
The image is a Sentinel-2 L2A scene from 22 August 2026 (tile 35TMK), cloud-free over the city. The displayed colour of a 10 × 10 m pixel is computed from the reflectance in the red, green and blue bands (B04, B03, B02): the value is multiplied by 2.8 and raised to the power 1/2.2 (an approximation of the sRGB gamma), in 8 bits. The map shows the same colours, and the percentages classify this rendering, not raw reflectance. Nine other scenes, from October 2025 to October 2026, are behind the date control.
A pixel “has the hue” of a colour if it lies within 25° of it on the hue circle (HSV model) and has a chroma of at least 0.05 (the gap between its largest and smallest RGB channel, on a 0 to 1 scale). For blue the window is 205°–255° (centre 230°); the thresholds are set on the displayed values and do not establish what a viewer calls blue. Near-grey pixels get no hue but stay in the total that shares are measured against. The city is the administrative boundary from OpenStreetMap (238.9 km², 2.39 million pixels); the sectors come from the same data.
In the 22 August 2026 image the blue share is 0.15%. Across five summer and autumn dates and three contrast stretches it stays between 0.13% and 0.21%; with the chroma threshold lowered to 0.02 it reaches 0.43%, and with a ±45° hue window instead of ±25° it reaches 0.61%. Dates with snow or cloud are left out. The results describe the images and settings checked; hues can vary with the date, the lighting and the surfaces observed.
At 10 m a pixel mixes roof, street and trees: small roofs do not show up separately and can be missing from the count. The places in the list were identified in OpenStreetMap by names and tags within 110 m of the colour patch; the patch itself is measured in the image.
Sources
- Contains modified Copernicus Sentinel data 2025–2026. Sentinel-2 L2A, tile 35TMK, scenes S2B 22 August 2026 and nine others, via Earth Search and AWS Open Data.
- European Space Agency: Sentinel-2 documentation and the scene classification (SCL).
- © OpenStreetMap contributors, ODbL licence: city boundary, sectors, lakes, place names.