The Danube paints the sea
The Danube’s plume from space, 2003–2025: what really colours the sea off Romania
Swimmers at Mamaia say the green sea is the Danube. These are real NASA photographs of the delta and the coast, almost every day for 23 years. The plume is real. The river’s flow accounts for only about one eighth of how murky the sea off the delta looks from month to month.
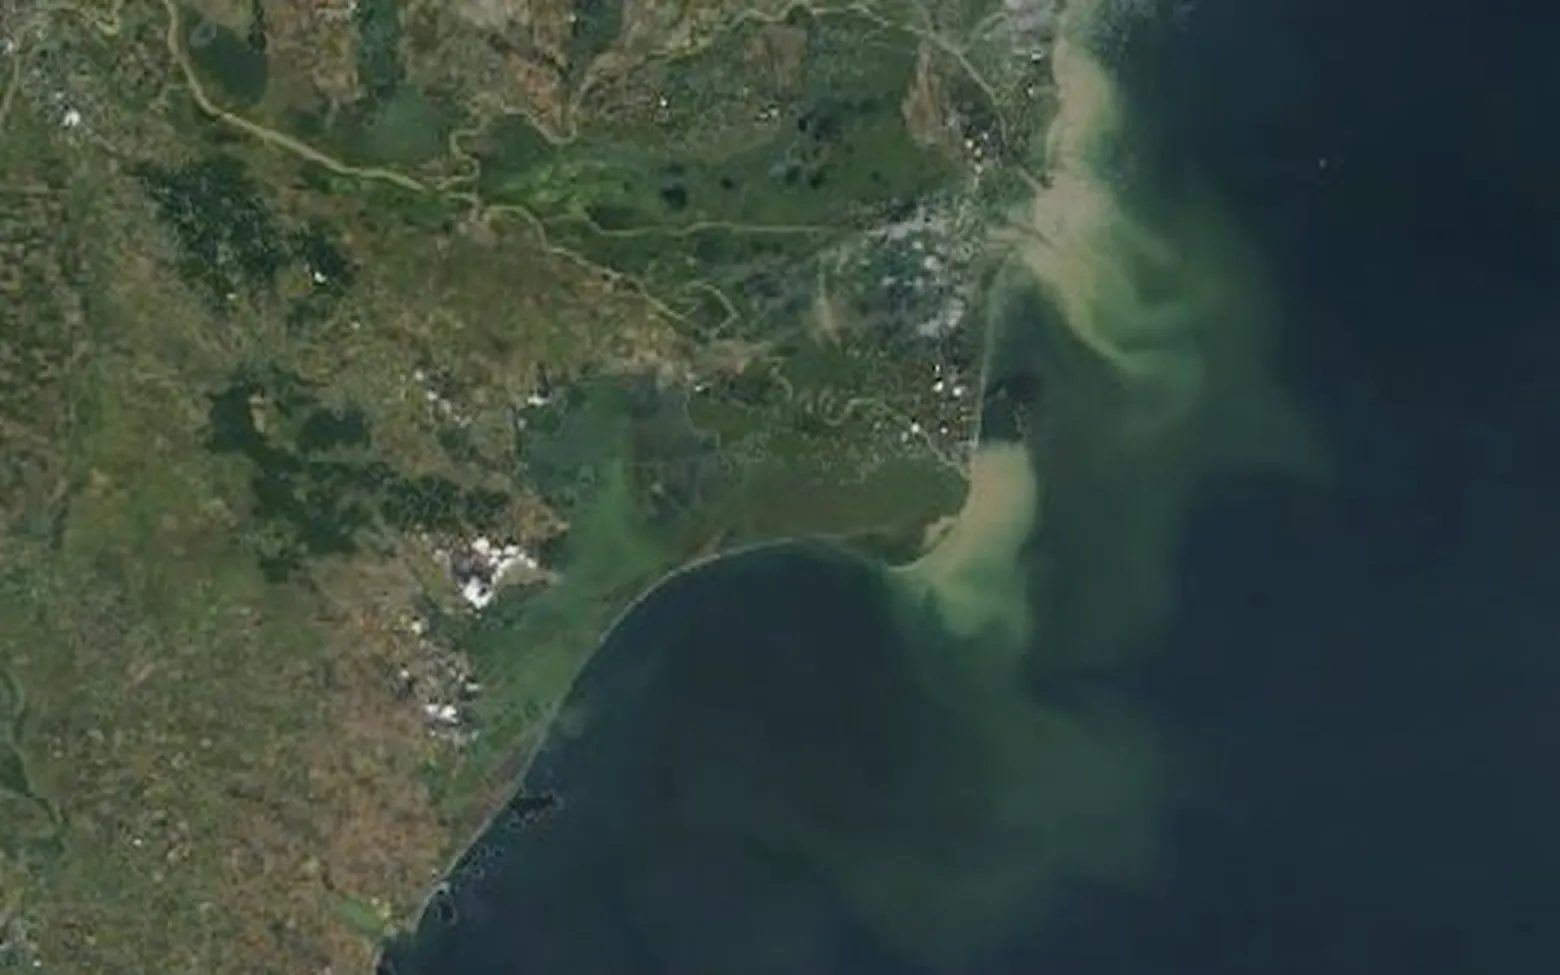
Photograph from NASA’s Terra and Aqua satellites, 26 August 2005. The Danube carried 2.5 times its usual flow for the date (modelled). Real colours, brightened slightly.
“It’s the Danube”
On a day like the one above the river is easy to see. Water the colour of milky tea leaves the mouths of the delta and turns south along the coast. Published satellite and modelling studies describe such a southward coastal current of Danube water in years when north-east winds prevail.
The saying goes one step further: that a green or brown sea at Mamaia, Costinești or Vama Veche is Danube water too, 100 to 180 km from the delta mouths. The pictures can show the plume. They cannot show whose water a murky sea is.
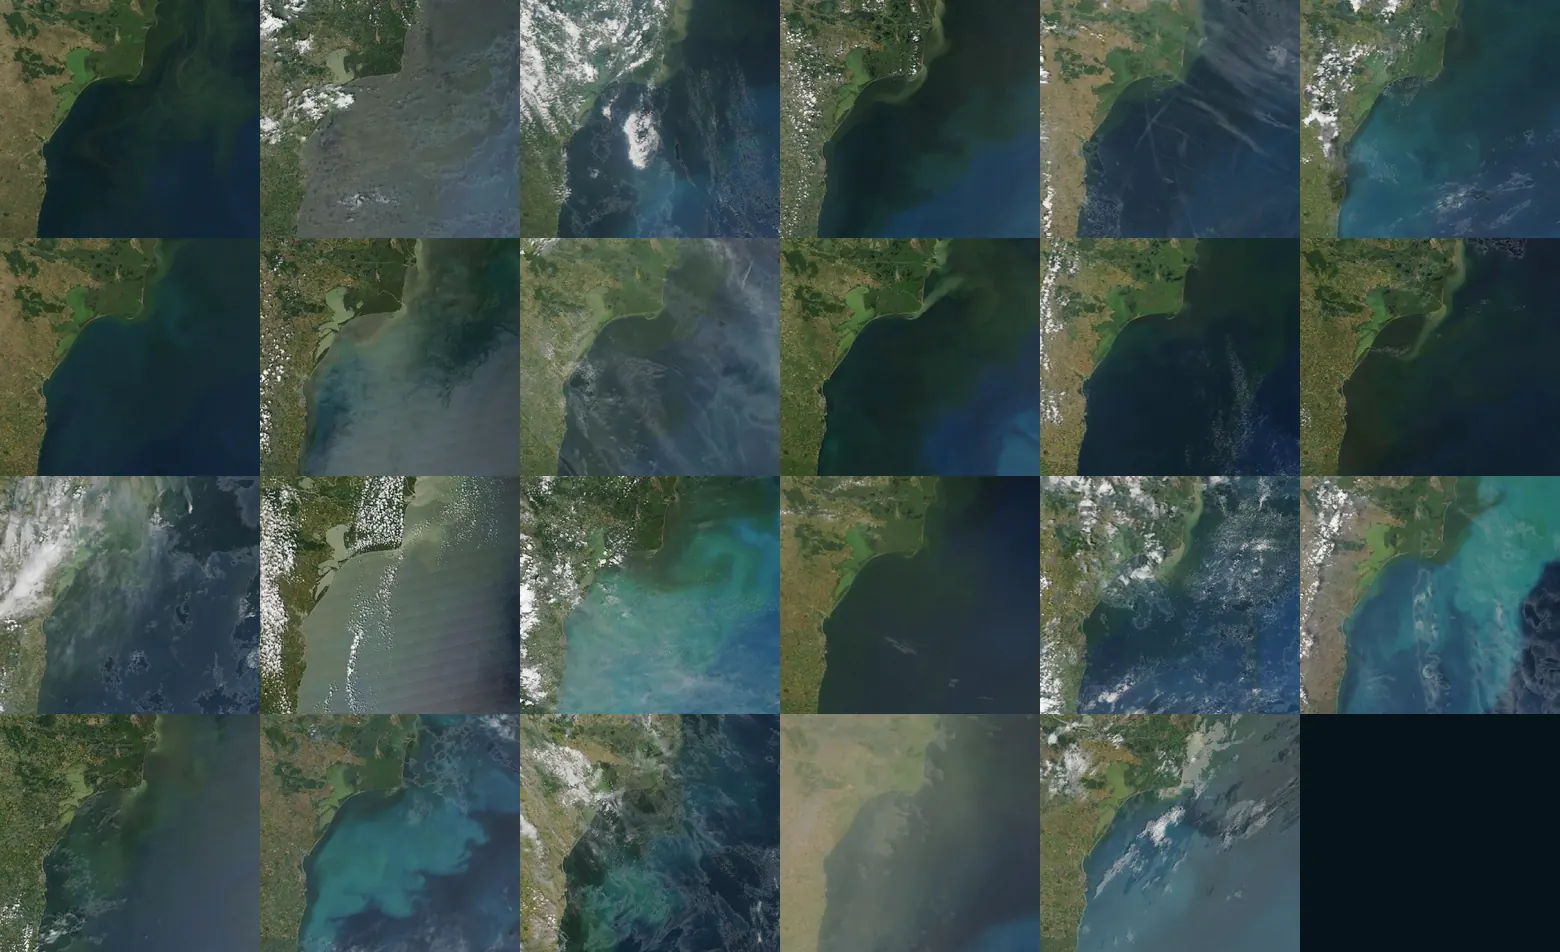
Four ways the same sea gets its colour
Each picture is one real day picked from the 23 years. The flow is the Danube’s modelled flow for that date against its usual flow for the same date.
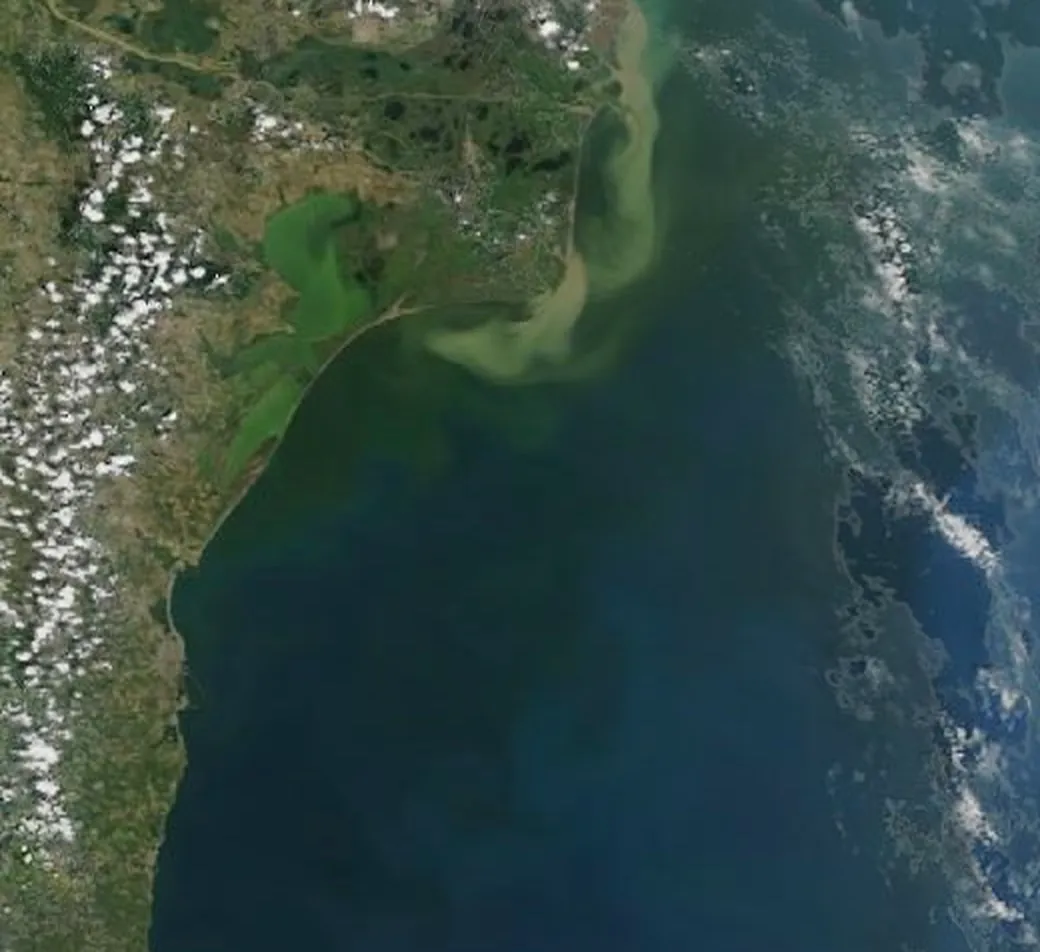
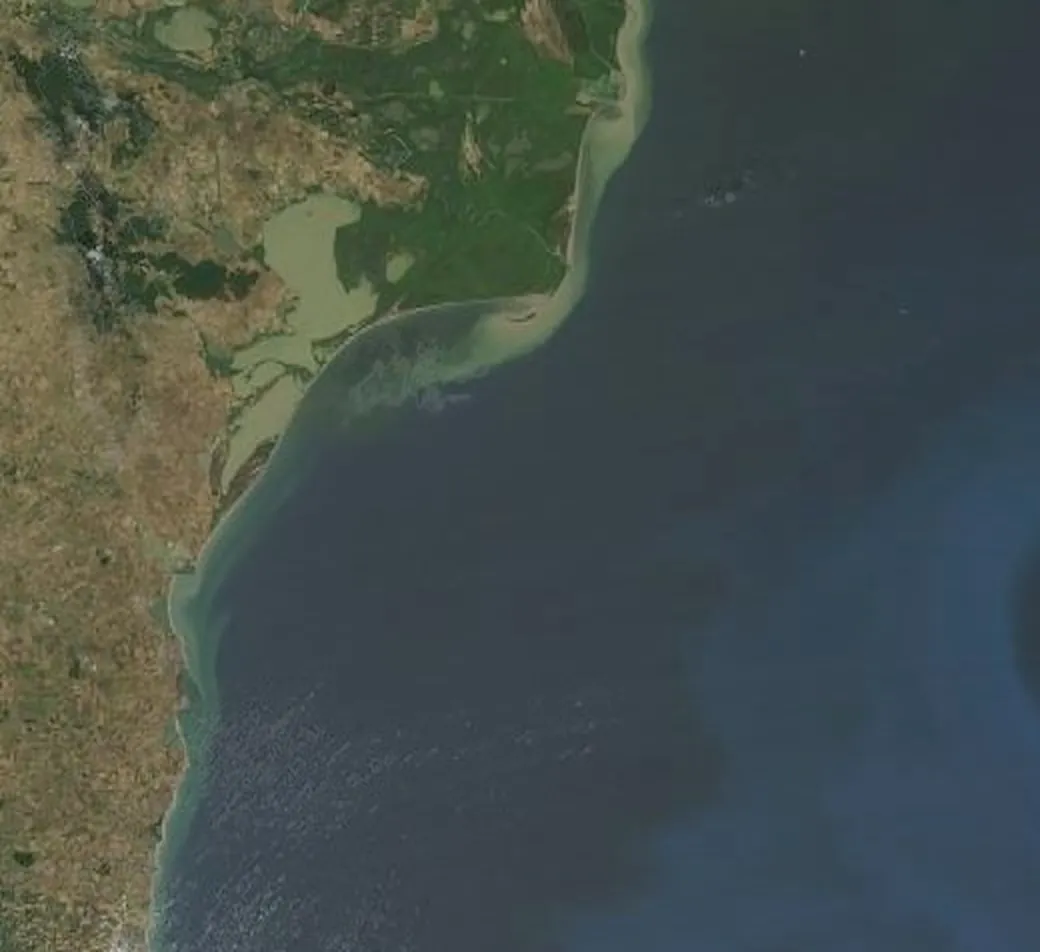
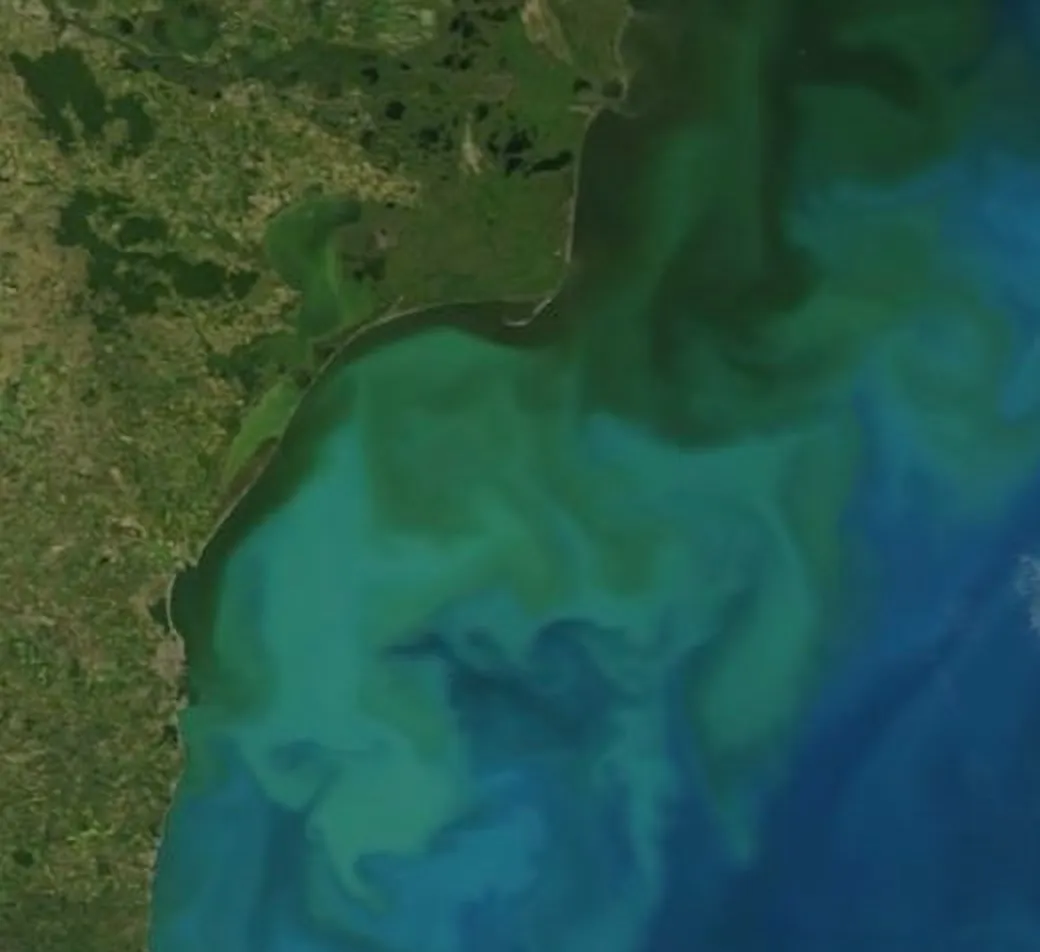
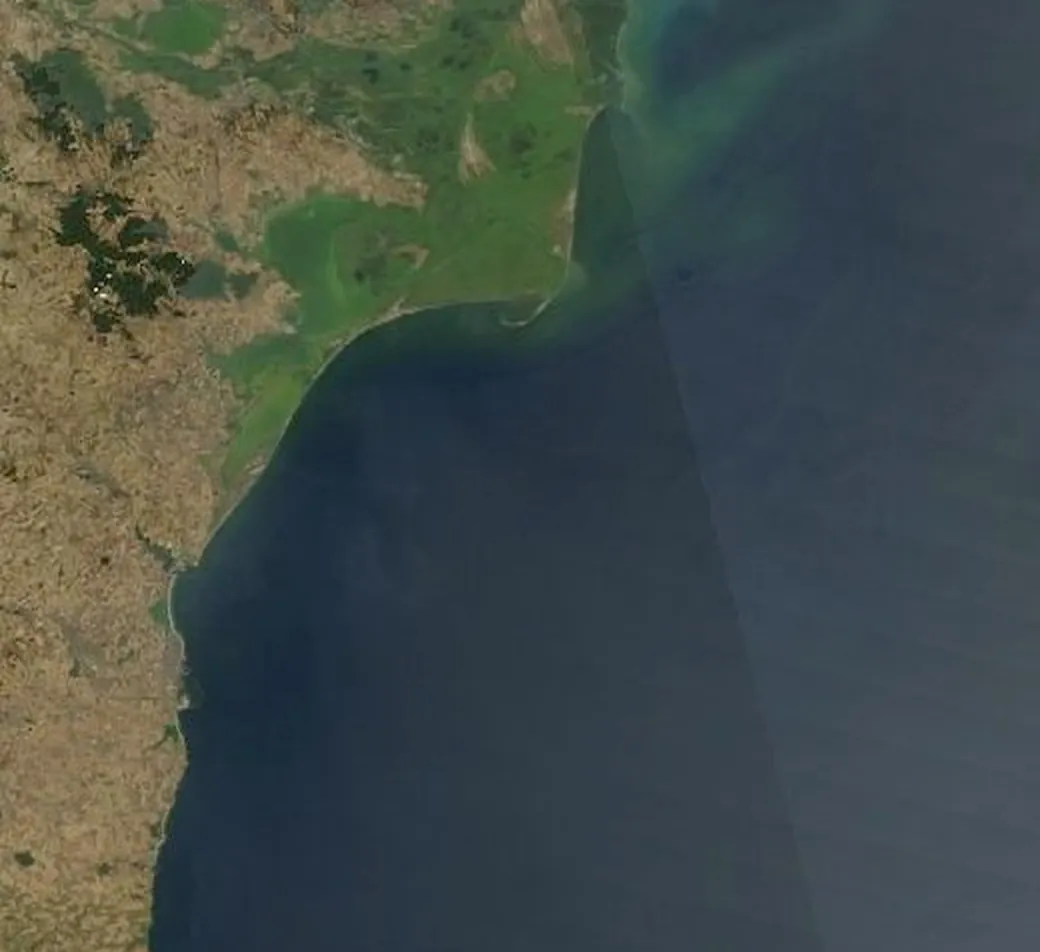
More about the chalk alga and the turquoise sea on Marea de turcoaz.
Every day, 2003–2025
Move through a year. Each picture is one day, with Terra and Aqua combined. Clouds are left as photographed: on 12% of the days between 15 April and 31 August, more than half of the sea in the frame is under cloud. Beside it runs the Danube’s flow for that year, with the usual flow dashed.
Modelled Danube flow, m³/s. Solid: this year. Dashed: the usual for each date, averaged over 2003–2025. Flood peaks are overstated.
Same river, different sea
On these two days the Danube carried almost the same flow, 0.77 and 0.75 times the usual. Flow alone does not set the colour.
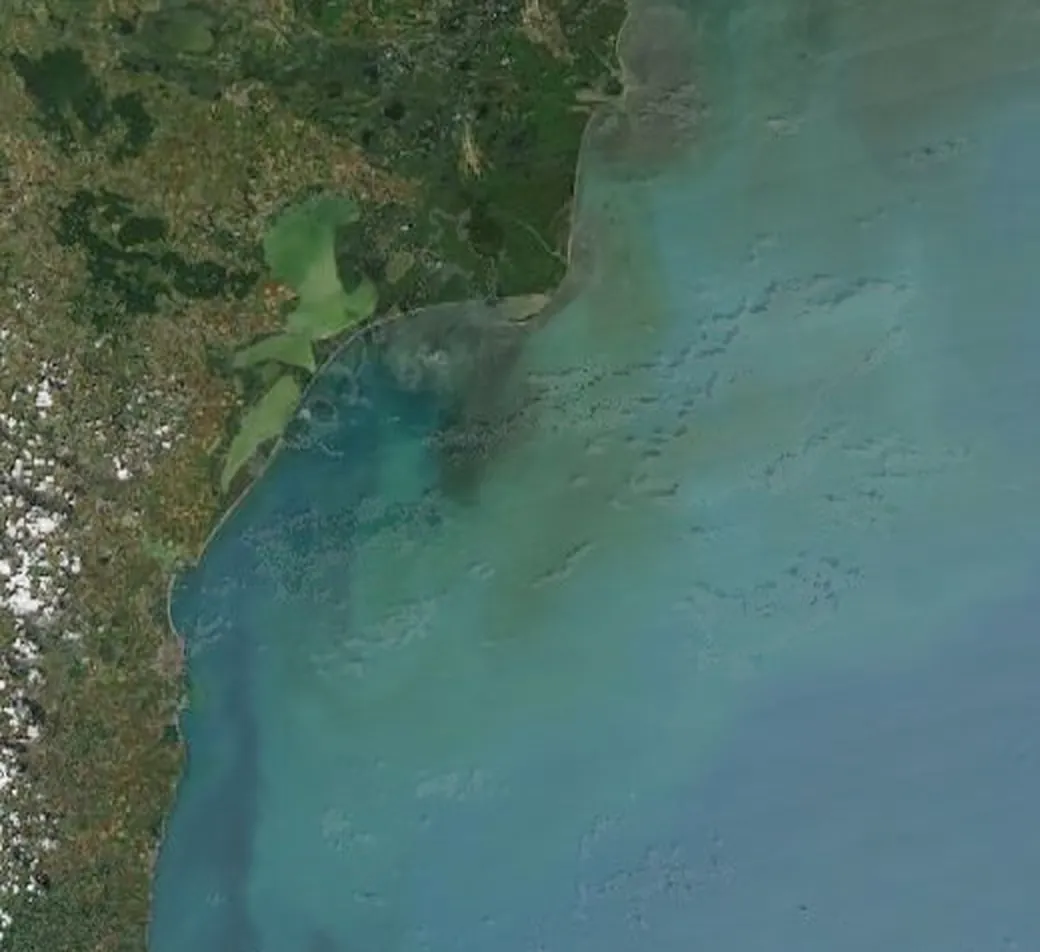
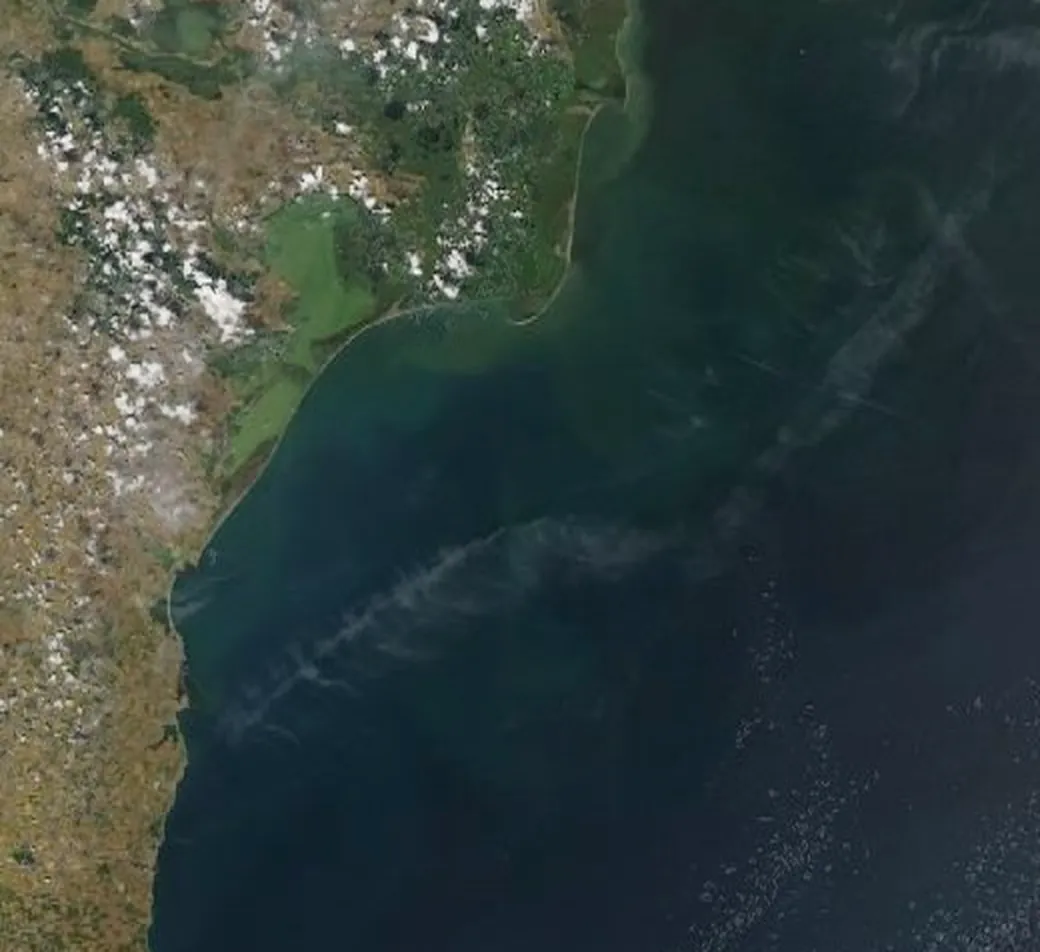
Your beach, any day
Pick a beach and a day from 15 April to 31 August, 2003–2025. The picture is the real frame, about 100 km across, and it is soft: one pixel covers about 400 by 550 m. The page shows what the satellite saw and does not say what the colour is, because one picture cannot tell river water from mud stirred by waves or from an alga.
How much of the colour is the river?
The test: if the sea’s colour follows the river, then in months when the Danube carries more water, more of the sea off the delta should look murky, and the two should line up with a correlation above 0.5. Murkiness is measured by NASA’s 8-day ocean-colour product, in the area off the delta described under Method. Flow is a modelled daily series for the river above the delta.
Each dot is one month, 2003–2025.
Four fixes were tried afterwards, each written down before it ran, tuned on 2003–2014 and judged on 2015–2025: leaving out chalk-bloom pixels, subtracting an open-sea reference, delaying the flow by one or two months, and a 30-day flow average. None reached 0.5. The best value on the held-out years was 0.40.
A second idea also failed: that the plume bends north or south with the wind. On 8-day data the correlation between the north wind component and the plume’s north–south position was 0.03 and 0.10 in the two halves of the record, and about 0.18 and 0.24 once the seasons were removed. The daily pictures above are the better tool for that question.
None of this shows that the Danube does not matter. Its plume is plain in the pictures. It shows that the river’s flow leaves most of the sea’s murkiness unexplained, so a murky sea on a given day is not proof of Danube water. This test does not say what causes the rest.
Method and sources
The pictures come from NASA’s GIBS service: MODIS Terra and Aqua true colour for 27.8–31.0 E, 43.3–45.5 N, every day from 1 April to 31 August 2003–2025 (the page shows 15 April onward). One pixel covers about 400 m east–west and 550 m north–south. Terra and Aqua pass a few hours apart; where one is cloudy and the other clear, the clear pixel is used, otherwise the two are averaged. A gentle brightening (gamma 0.86) is applied to the dark sea; no other colour change. Cloud is not filled from neighbouring days.
Murkiness here is the share of sea pixels, in the box 44.0–45.8 N, 29.4–31.4 E off the delta, whose red-light reflectance (Rrs 667 nm, NASA 8-day 4 km product) is above the box’s 75th percentile over 2003–2025; months are averaged from the 8-day periods.
Flow is modelled GloFAS v4 discharge supplied through the Open-Meteo Flood API, for the cell on the Danube above the delta apex. It is modelled, not gauged, and it overshoots gauged flood peaks: for April 2006 the model gives about 21,000 m³/s against 14,400 to 16,500 recorded at the Isaccea gauge (ICPDR 2006 flood analysis; a Romanian hydrology paper). Ratios for flood days are therefore inflated. Its mean over 2003–2025 is 6,486 m³/s, close to the 6,495 printed for 1840–2016 at the delta apex. “Usual flow” for a date is the mean, over the 23 years, of the days within ten days of that day of the year.
The picker was checked before it was allowed to describe colour. A colour index measured on each day’s picture within 8 km of a beach was compared with NASA’s turbidity product near that beach. The rank correlation was 0.41–0.48 at Sulina and Sfântu Gheorghe and 0.15–0.24 at the beaches from Mamaia to Vama Veche, under the bar of 0.5 set in advance. So the page shows the picture and the cloud cover, and does not say what the colour is.
Sources
- NASA GIBS (Global Imagery Browse Services), Web Map Service: MODIS Terra and Aqua Corrected Reflectance True Colour, daily, 2003–2025; land mask from OpenStreetMap data served by GIBS. Public NASA data, no restrictions on use; attribution requested. link
- NASA Ocean Biology Processing Group: MODIS-Aqua, MODIS-Terra and VIIRS 8-day Level-3 remote-sensing reflectance at 667 nm (Rrs_667, 4 km), 2003–2025, used for the turbidity test. link
- Open-Meteo Flood API: modelled river discharge, GloFAS v4 (Copernicus Emergency Management Service), grid cell 45.225 N 28.725 E on the Danube above the delta, daily 2003–2025. Modelled discharge, CC BY 4.0. link
- Open-Meteo Historical Weather API: ERA5 reanalysis 10 m wind (Copernicus Climate Change Service) at 44.8 N 30.4 E, hourly 2003–2025, averaged per day. CC BY 4.0. link
- Gâștescu P., Țuchiu E. (2020). Hydrographycal, hydrologycal and qualitative characteristics water with references on the pontic sector. Riscuri și catastrofe XX(27/2): the long-term Danube mean at the delta apex, 6,495 (printed m²/s) over 1840–2016. link
- Pathways and mixing of the north western river waters in the Black Sea. Estuarine, Coastal and Shelf Science (open access): a satellite and modelling study of where the Danube plume goes, including the southward coastal path under north-east winds. link
- Marea de turcoaz (this site): the chalk-armoured alga Emiliania huxleyi and the turquoise Black Sea each June, 2003–2025. link
mariuscomper.uk · NASA GIBS imagery · Open-Meteo / Copernicus flow and wind