NASA Terra and Aqua (MODIS), via GIBS · land darkenedNASA Terra · Aqua · GIBS
23 summers seen from space · 2003–2025
Every June, the Black Sea turns turquoise
Every year, usually from late May until about mid-July, an alga a two-hundredth of a millimetre across, armoured in scales of chalk, whitens the water until it shows from space. NASA's satellites caught it in all 23 summers since 2003, most often peaking in the first week of June. The summer of 2025 was one of the strongest.
Scroll: one spring and summer, week by week
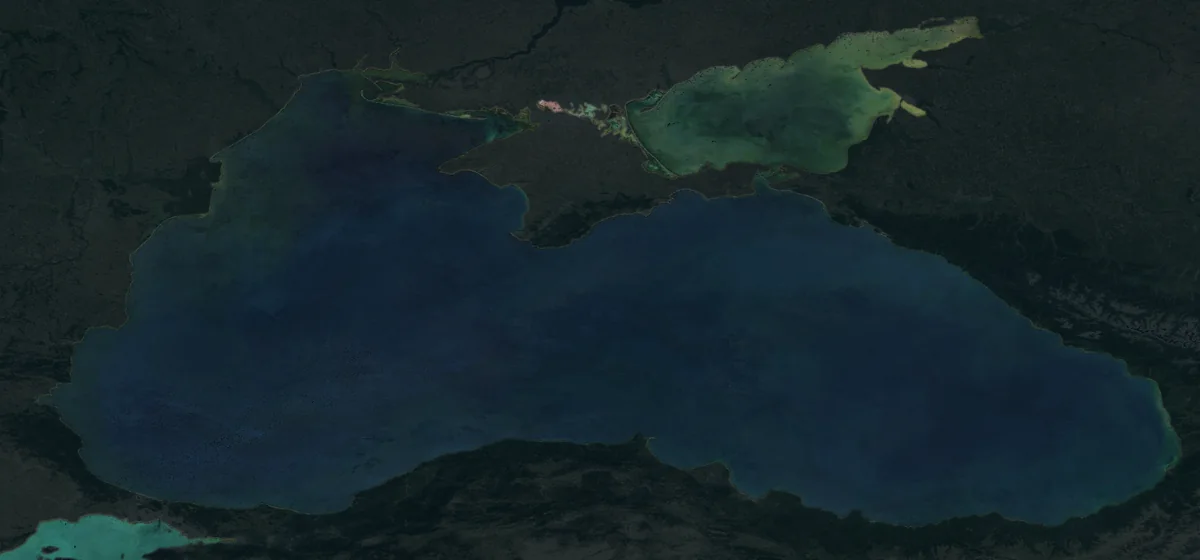
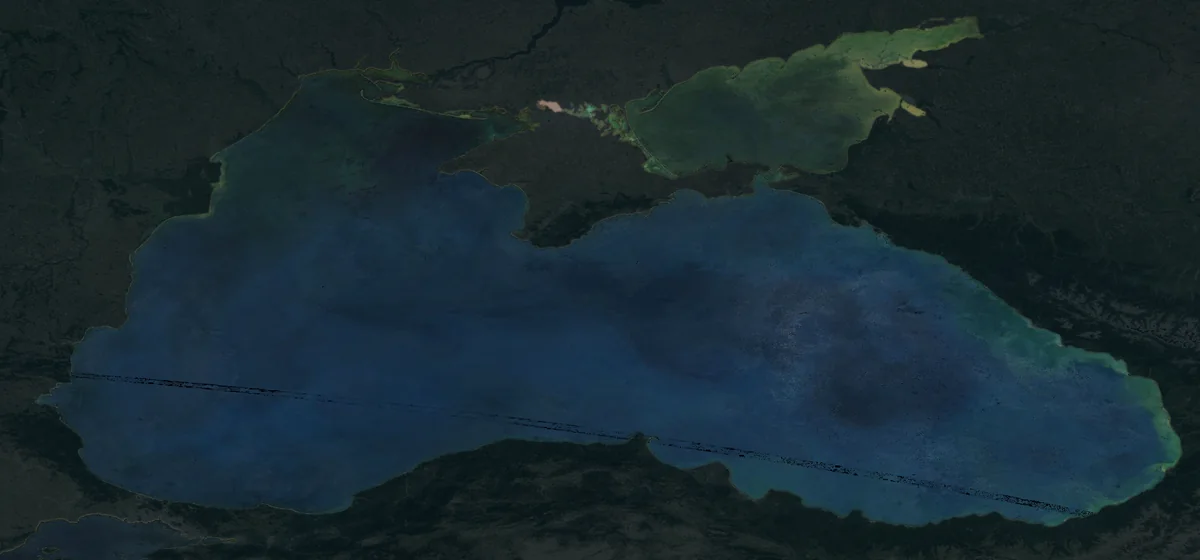
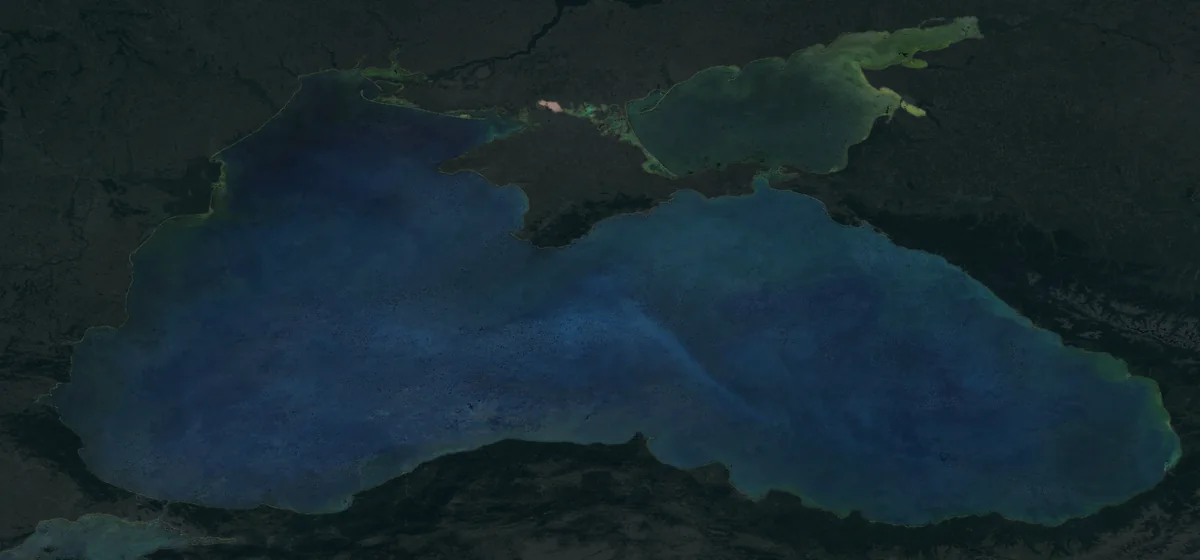
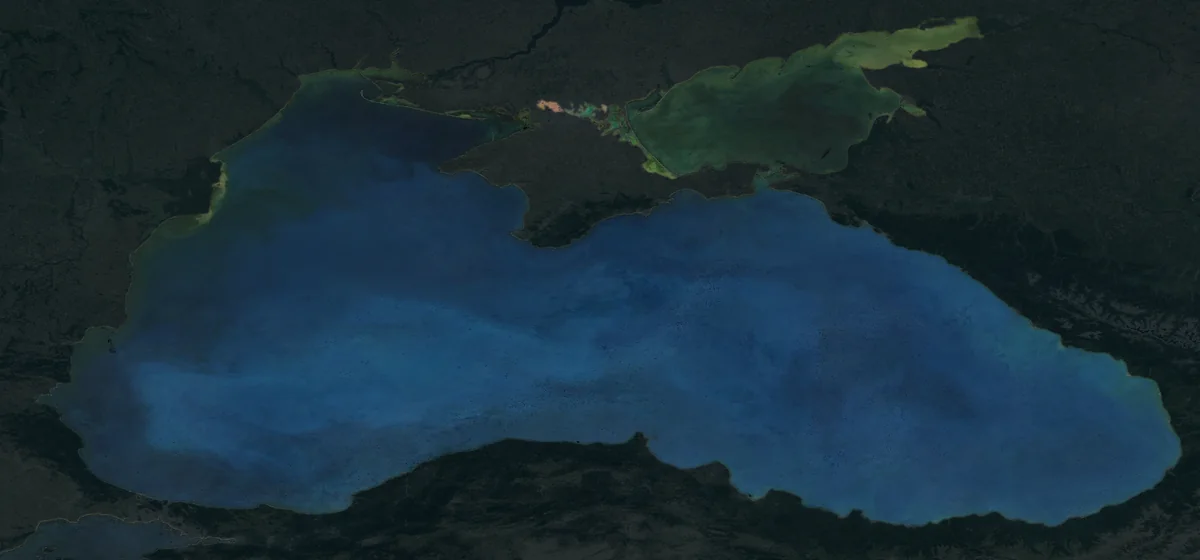
April: the sea is black
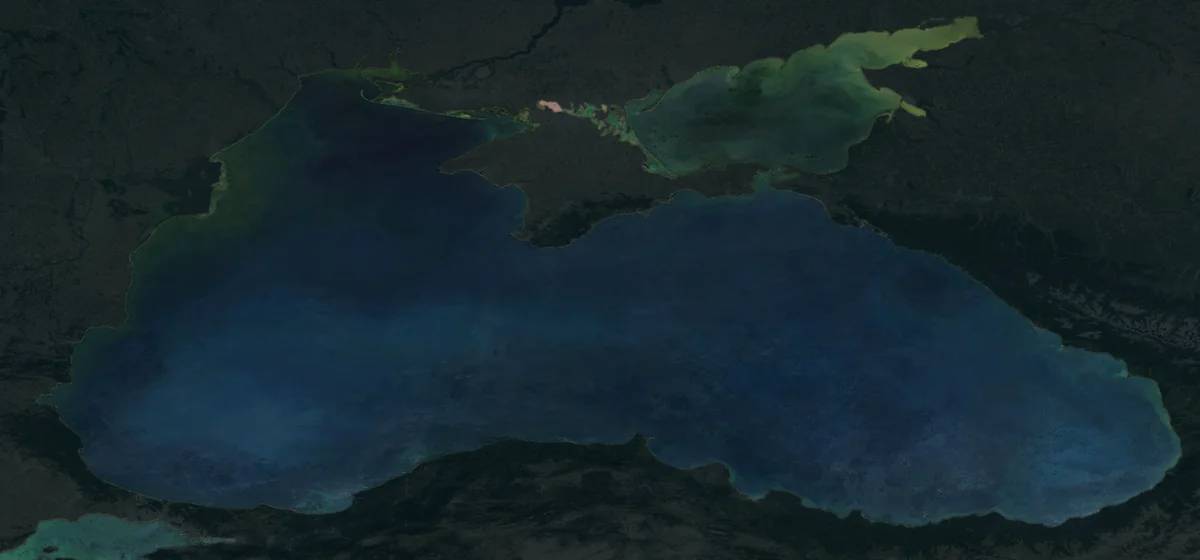
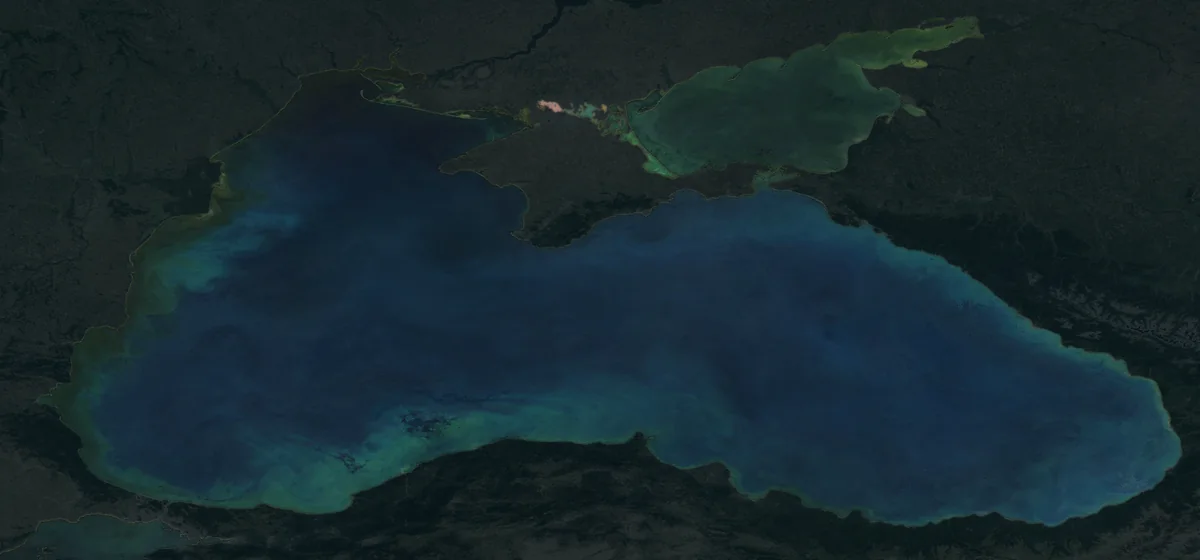
This is the Black Sea from space on 16 April 2017: a pool of ink between mountains and plains. Deep, clear water swallows the light and sends almost nothing back.
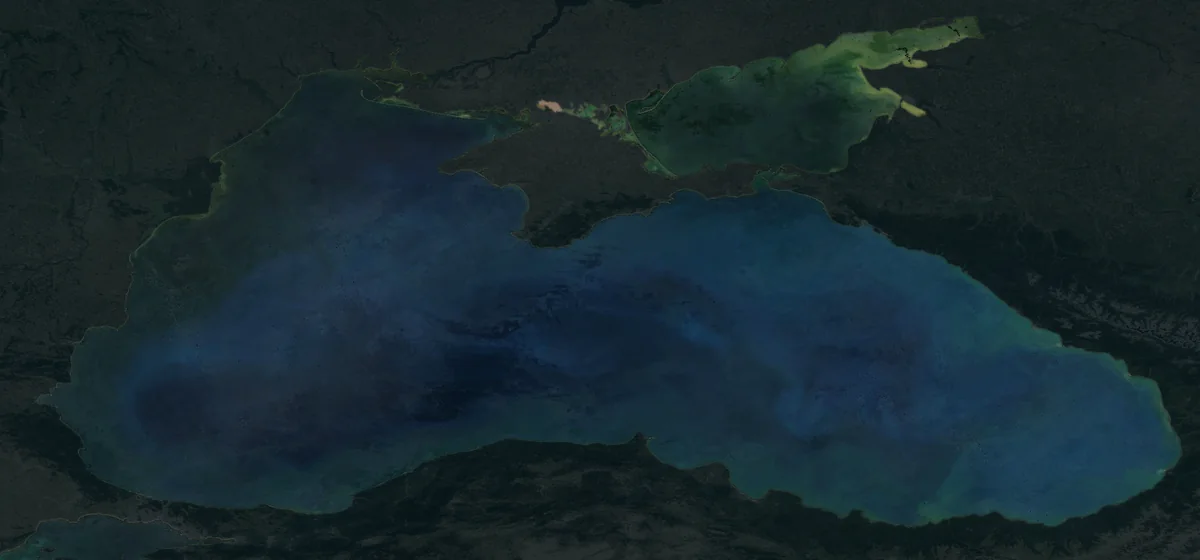
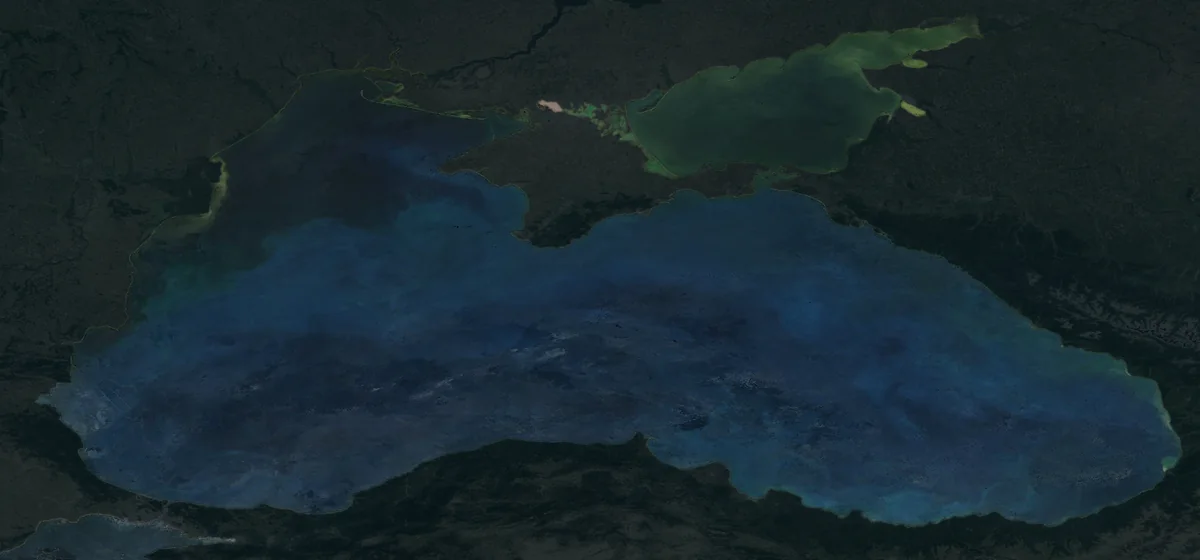
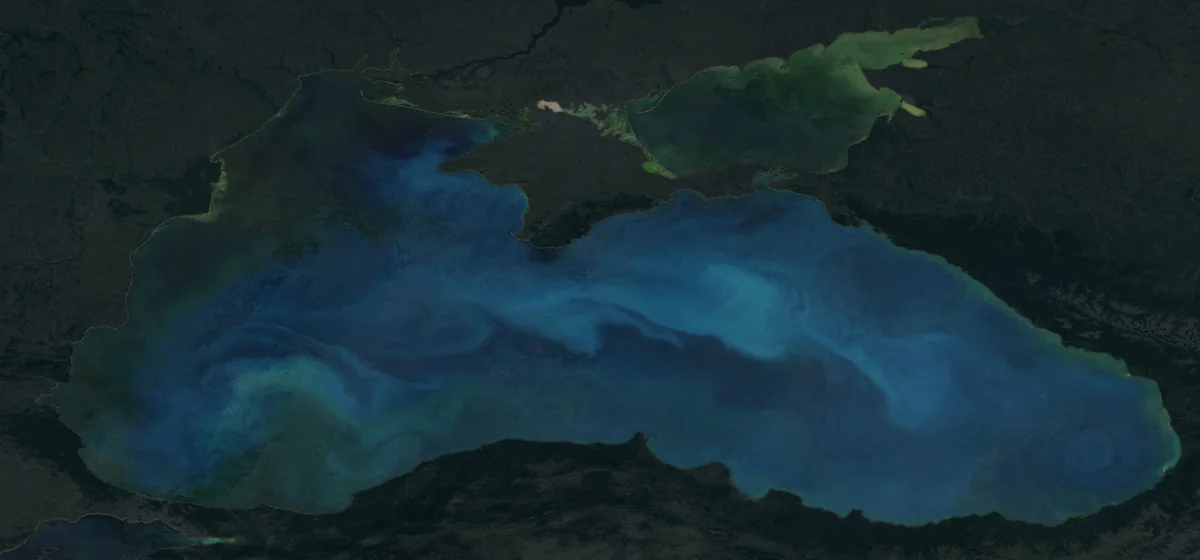
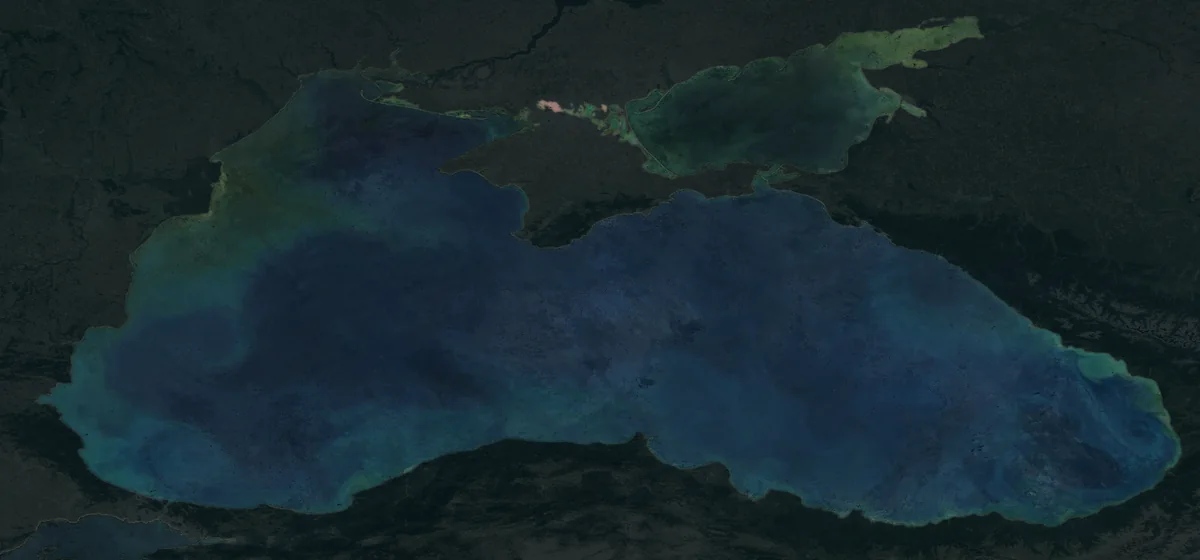
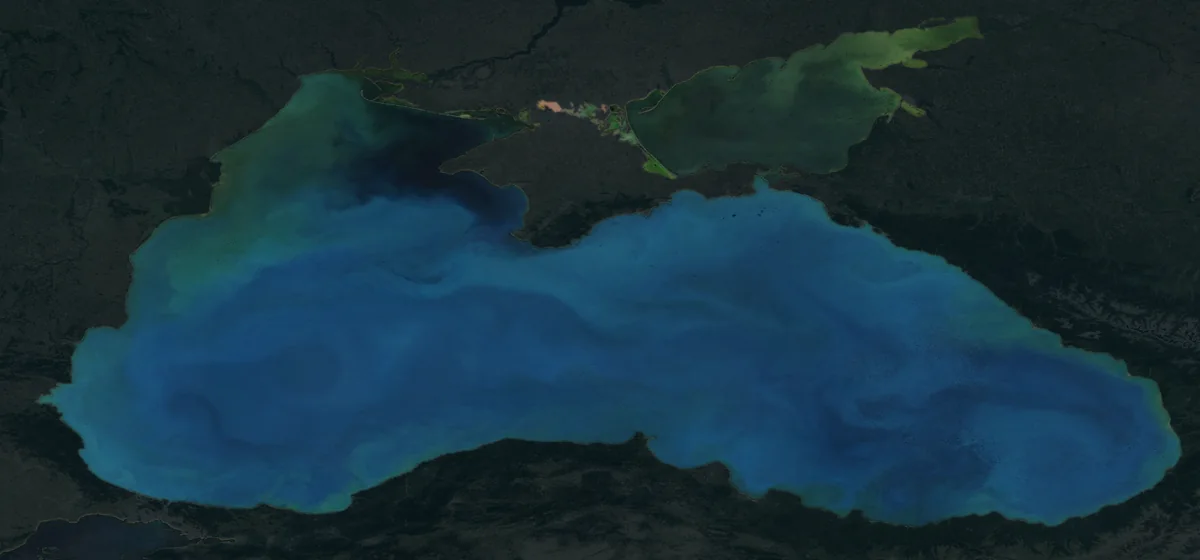
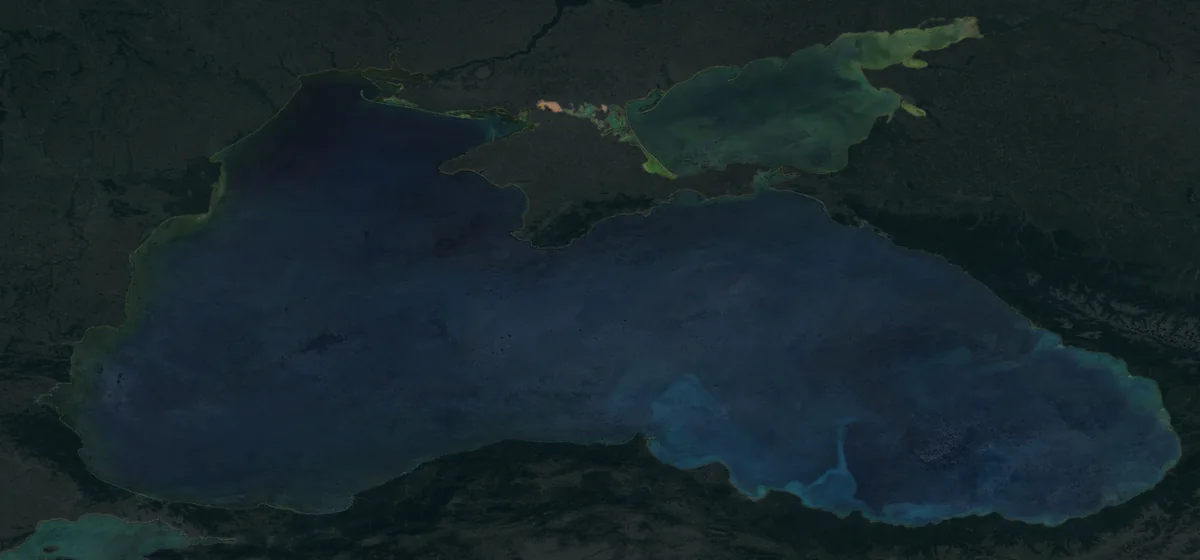
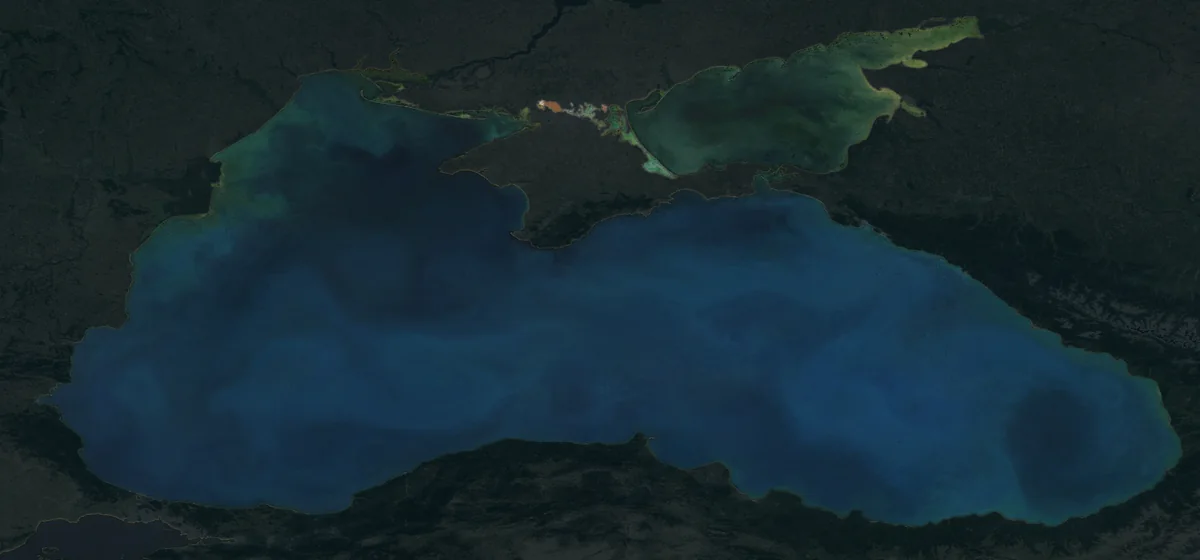
These are real photographs from the Terra and Aqua satellites, each built from five neighbouring days so the clouds drop out. The land is darkened on purpose, so the water shows.
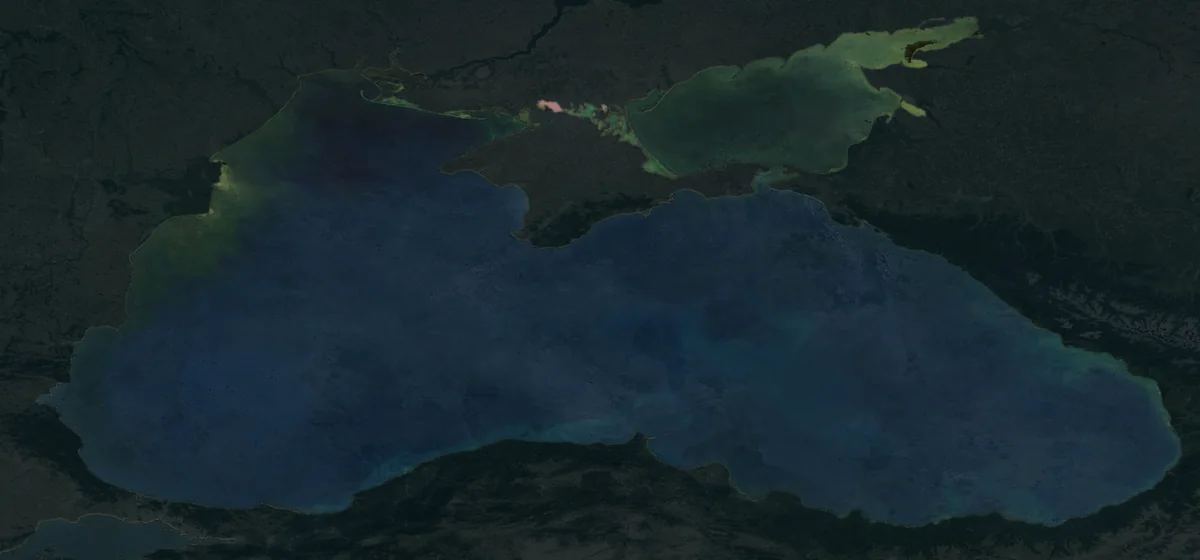
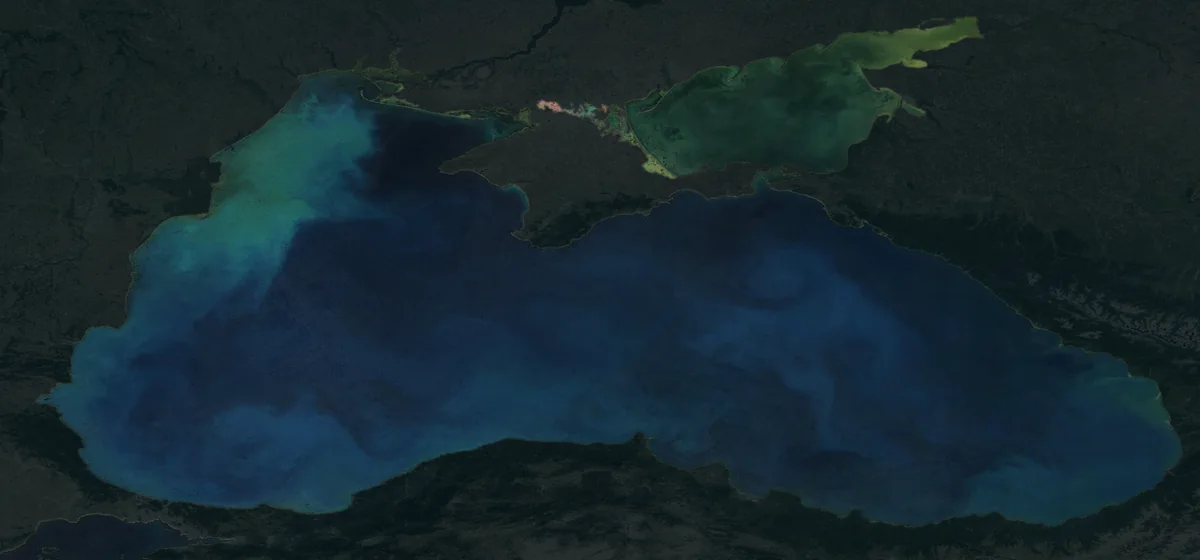
The second half of May: the first streaks
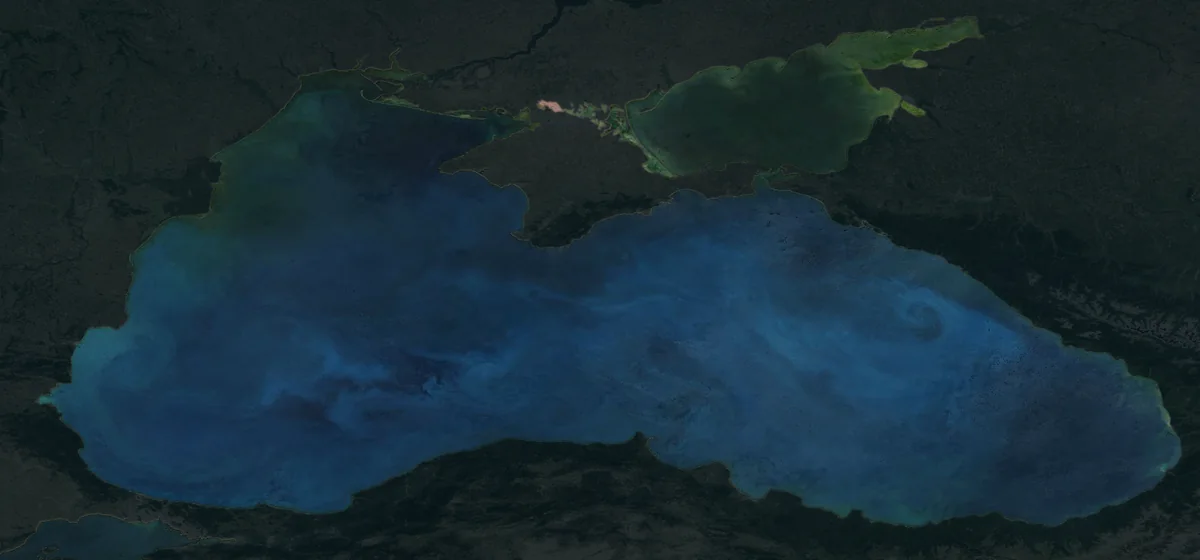
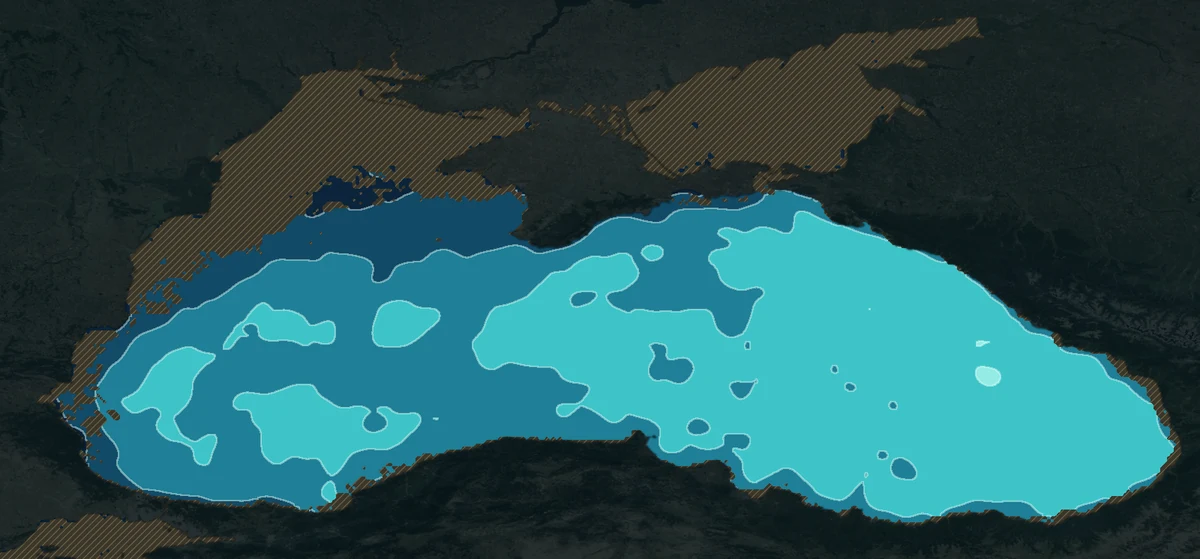
Then, within days, pale streaks appear on the black sea, like milk poured into tea. This is the bloom. In 2017, around 14 May, about 12% of the open sea already held enough chalk to show from space: that is the line used throughout this page.
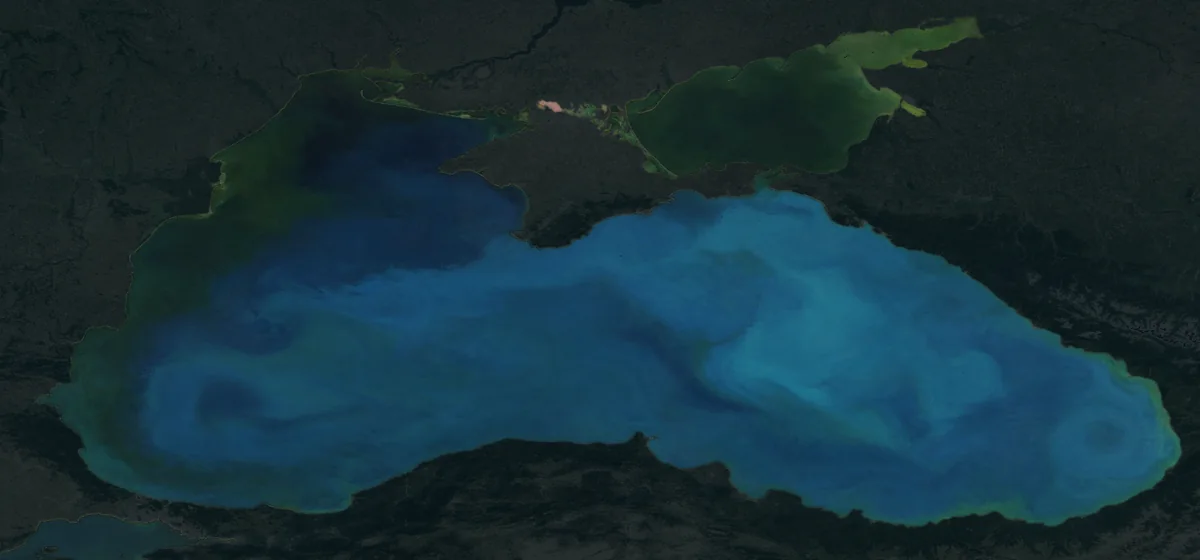
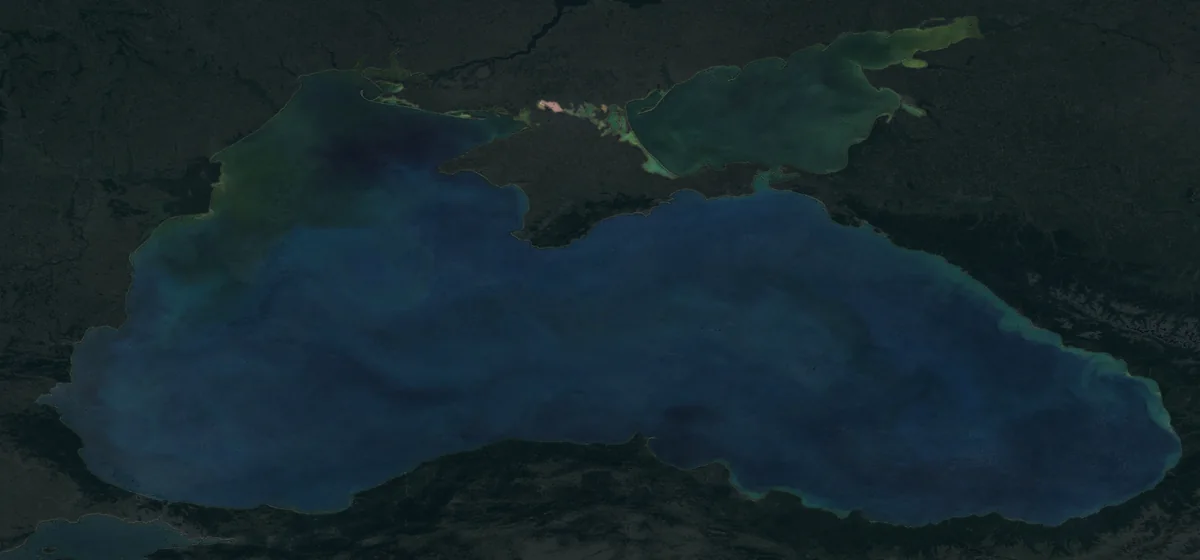
June: the whole sea
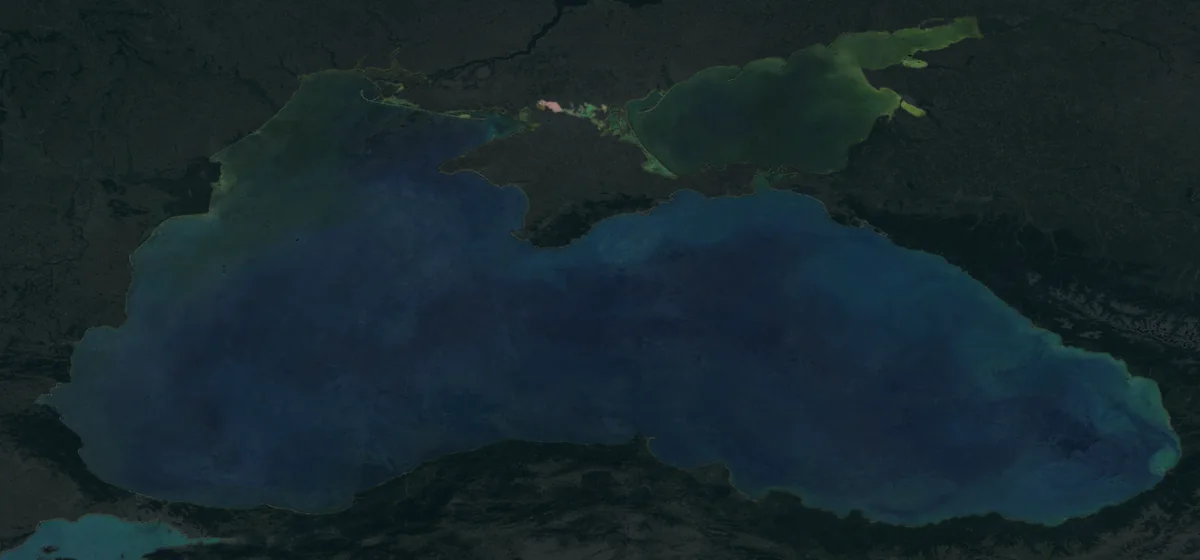
By early June the bloom covers almost all of the open sea. Around 4 June 2017, 98% of it was over the line. The sea takes on the colour of a tropical lagoon.
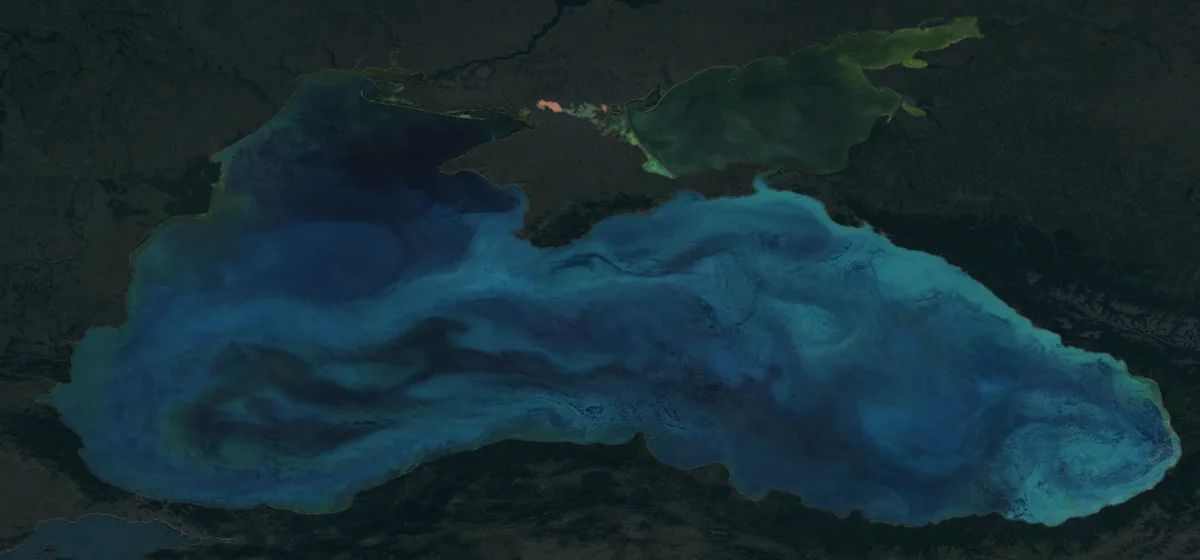
The algae draw the currents
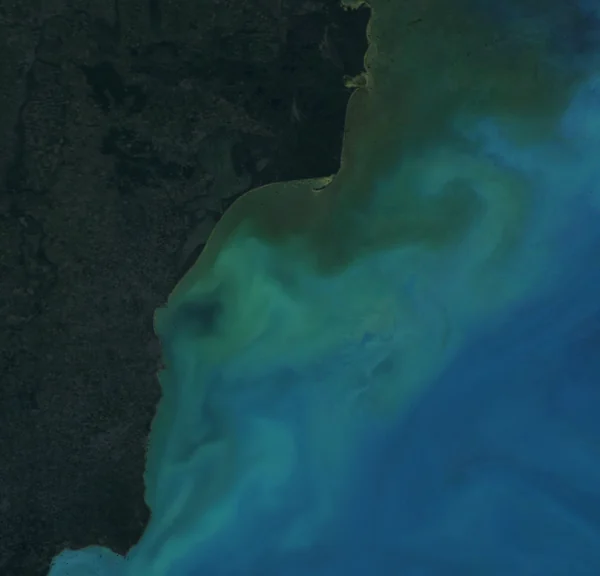
The algae do not swim: the water carries them. So the bloom reveals the sea's eddies, swirls tens of kilometres wide that in April cannot be seen at all.
The picture is magnified a few times, in the west of the sea, on 11 June 2017. Each streak is water with a little more or a little less chalk than its neighbour.
The colour comes from chalk
It is an alga, Emiliania huxleyi: a single cell about five micrometres across, a two-hundredth of a millimetre. It armours itself in scales of calcite, the mineral chalk is made of, each about three micrometres long.
The cell makes more scales than it wears and sheds the rest into the water: tens, sometimes hundreds. When the algae reach a million or two per litre, the floating scales scatter light back towards the sky, and the black water turns milky blue.
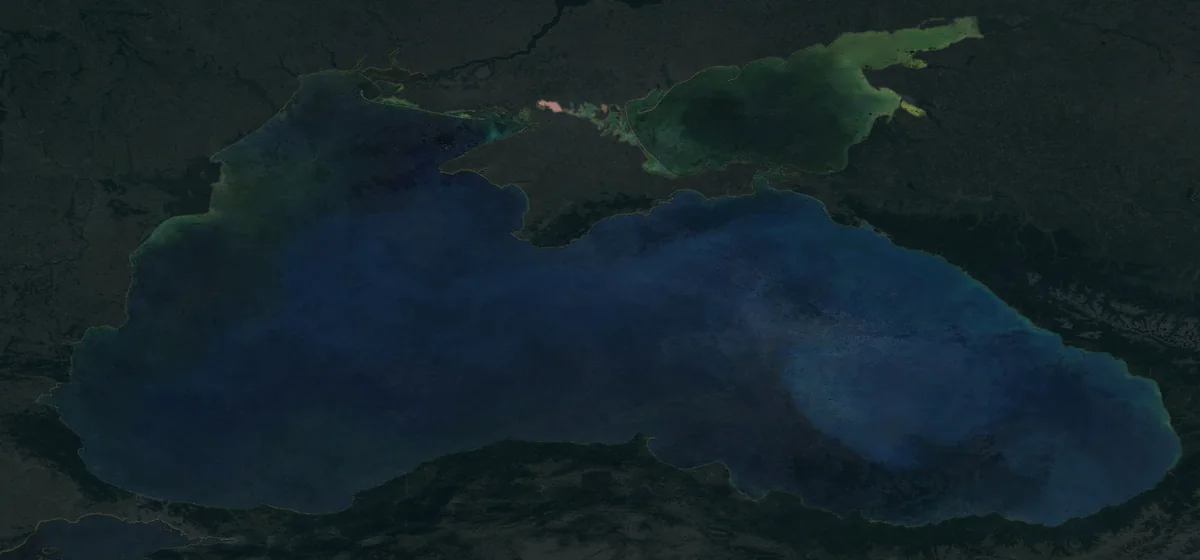
July: it fades
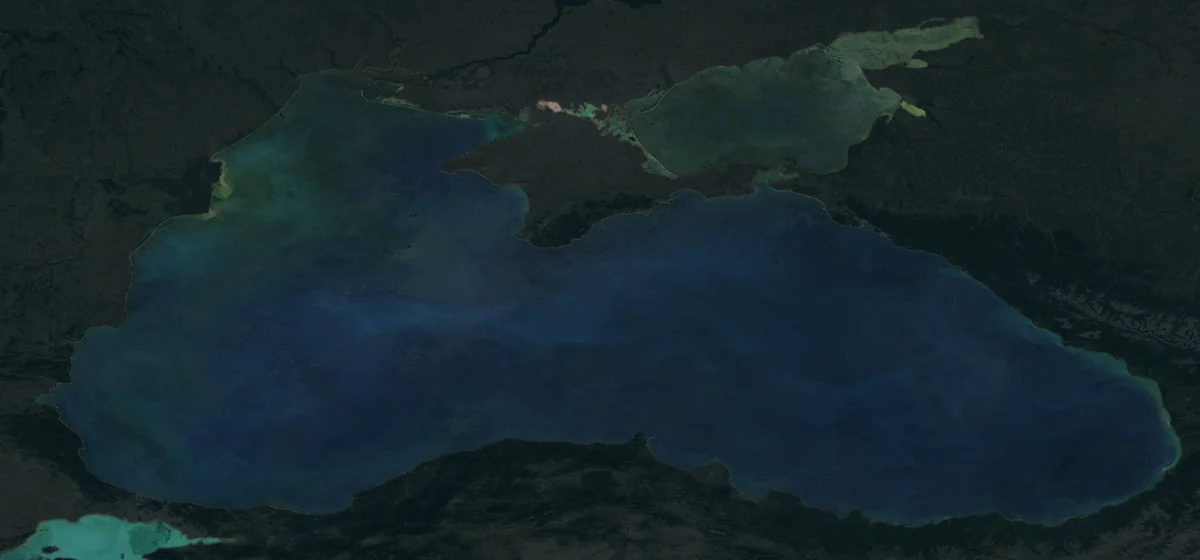
Towards mid-July the bloom fades. The cells die or are eaten, and their chalk scales sink slowly towards the sea floor. Around 23 July 2017, only 43% of the open sea was still over the line.
And again next year
In August the sea is usually black again (in 2022 the bloom lasted into August). The bloom came in every one of the 23 summers the satellites recorded from start to finish. But no two summers are alike.
Each picture below is the sea in the week the bloom was widest, every year from 2003 to 2025. The bar under each year shows how much of the open sea held chalk above the line, on average, from late May to late June.
2003
2004
2005
2006strong
2007
2008
2009weak
2010
2011
2012strong
2013weak
2014
2015
2016
2017strong
2018weak
2019strong
2020
2021
2022
2023
2024
2025strong
Tap a year for the large picture. Composites of nine neighbouring days, Terra and Aqua (MODIS), plus VIIRS from 2012; the land is darkened on purpose and the thumbnails are slightly brightened.
clear seastreaksmost of the open seaall of itcloud, no data
Each square is an eight-day period of the chalk data (suspended calcite, NASA MODIS-Aqua, 4 km pixels), open sea more than 40 km from shore. Line: 0.0015 moles of calcite per cubic metre.
The strongest summers were 2017 and 2019, then, tied, 2012 and 2025, then 2006. The weakest: 2018, 2013, 2009. In 2018, even in its best week, only 35% of the open sea crossed the line.
The ranking is not this page's invention. Published studies of the same sea name 2012 and 2017 among the strongest blooms, and the 2024 study adds 2019 and names 2003, 2009, 2010 and 2018 among the poor ones. Before anything else, the method here had to put 2012 and 2017 in its top four years and the poor years in its bottom half. It did.
The summer of 2025 is in none of the studies cited here. In the Aqua satellite's data it is the 4th strongest of 23, practically tied with 2012; on Terra, Aqua's twin, it is the 6th, and on NOAA-20, which carries a different kind of instrument, the 2nd of the 8 summers it has seen.
The peak has not moved. The sea warmed in June by about 0.5 °C a decade, yet the week with the widest bloom still falls most often in the first week of June: the trend line moved by 0.2 days over the whole period. The start came earlier in a few years, earliest in the last week of April 2021, and over 22 years its trend brings it about 14 days earlier. That is under the 16-day bar the page set in advance for the peak, so it does not call it a sure change.
The satellite sees the sea in pixels more than a kilometre wide. Near the shore, sand on the bottom, waves and rivers can fool any instrument. So for every place on the map, the page reads the sea from 5 to 30 kilometres out, and counts a week as turquoise only when two different measurements agree: the chalk in the water and the colour in the photograph.
turquoise in 16 summers or morein 12–15in 8–11in 4–7in fewer than 4cannot be read from space
The map tells the story at a glance. The turquoise showed most often in the east of the sea, along the coasts of Turkey, Georgia and Russia. Westwards it shows less and less. And in the north-western corner, from the mouths of the Danube to Odesa, and in the Sea of Azov, the satellite cannot read the bloom: the water there is greenish and cloudy from the rivers all year.
Share the page
Near Constanța, the satellite can’t tell turquoise from silt#
9–13 June 2017, the strongest summer: the turquoise comes close to shore south of Constanța, but swirls into the green Danube water flowing down from the delta.
9–13 September 2017: the same coast, no bloom. Only the cloudy strip along the shore remains.
On Romania's coast, the satellite fails twice, in different ways. The chalk measurement is not reliable near any shore of the Black Sea, because it gives bloom-level values in winter too; off Romania, the January values are almost as high as June's. Silt brought by the Danube and stirred up by waves scatters light just as the alga's scales do. The photograph, for its part, shows greenish water off Constanța, turquoise in June on only 5% of clear days, against 2.5% in September. The difference is too small for the satellite to tell the bloom from the water's ordinary colour.
That does not mean the bloom never reaches Romanian waters. In samples taken in June 2020 by Romania's “Grigore Antipa” marine institute on the continental shelf, more than 100 km out, where the sea is 70–100 m deep, surveyors counted 1.51 million Emiliania huxleyi cells per litre off Constanța and 1.85 million further south, towards the border with Bulgaria: a full-scale bloom. It is just that, closer to shore, the Danube's fresh, cloudy water covers the colour.
Further south, from Costinești to Vama Veche, the sea can be read with the chosen thresholds: there the turquoise showed from space in 5 of the 23 summers. Places in the open sea, read by the same rule, average 10 summers, and Georgia's Batumi has 14.
Each dot is a year, 2003–2025. June temperature and how much the sea bloomed show no link: the correlation is −0.08.
Heat does not decide it. Anyone looking at the big bloom years checks temperature first, but the link is not there: between the sea's temperature in June and how much it bloomed that same June, the correlation over the 23 years is −0.08, which is to say none. The 2024 study of 1998–2020 reached the same conclusion.
What matters, according to that study, is how calm the surface water is: a thin, settled layer over the cold water, where the alga, which copes with strong light far better than its rivals, has the sun to itself. Other researchers have tied two of the strongest summers, 2012 and 2017, to the winters before them, when the sea mixed more deeply and brought up much more phosphate (two- to threefold differences between winters).
The sea has warmed, in June, by about 0.5 °C a decade, and in winter by 0.8 °C. The peak of the bloom, so far, has not moved in the calendar.
Chalk. NASA's particulate inorganic carbon (PIC) data from the Aqua satellite (MODIS), eight-day periods, 4 km pixels, 2003–2025, for the whole Black Sea. An area is over the line, “in bloom”, when it holds more than 0.0015 moles of calcite per cubic metre. The line was set before any calculation, and the method first had to find again the strong and weak years named in published studies. It did. With a higher line (0.002) the top four stay the same; with a lower one (0.001) 2008 joins them and the weakest year becomes 2013. The years were then checked against Terra, Aqua's twin (correlation 1.00), and NOAA-20, which carries a different instrument and has data only from 2018 (correlation 0.99).
Colour. 5,605 daily true-colour photographs from Terra and Aqua (NASA GIBS), from 1 May to 31 July and all of September, every year. For each pixel, the less cloudy pass was kept. A pixel is “turquoise” when it is bright enough and its hue lies between cyan and azure; “green-brown” when the hue leans to green. The colour thresholds were set by hand on a few images, before any comparison. Over the open sea, colour ranked the years in nearly the same order as chalk (correlation 0.77).
The shore. An area near the coast can be read only if it is turquoise in June at least four times as often as in September, when the summer bloom is absent. A place needs at least five such areas 5–30 km out. A week counts as turquoise for a place when, in at least half of its areas, the chalk is over the line and at least 30% of the cloud-free pixels are turquoise. The rules were written down before seeing any result for any place. After the first results two rules were added, both cautious: the five-area minimum, which moves six places to “cannot be read”, and the open-sea average, now computed on 106 virtual places with the same rule as the coast (10 summers instead of 12). If the colour thresholds move, the Romanian coast stays at 5 summers of 23 or fewer, below Batumi; with a lower brightness threshold, even the southern coast can no longer be read.
What it cannot see. The beach itself: the first 5 km from shore cannot be read with these satellites. Cloudy days: a fully overcast week shows as empty. Nor the number of algae: the colour shows chalk at the surface, not how many cells live below.
Yunev, O. et al. (2024). Temporal variability of coccolithophore Emiliania huxleyi blooms in the open Black Sea: Evaluation by satellite data (1998–2020). Deep-Sea Research I. CC BY 4.0 manuscript. zenodo.org/records/11208353
Cokacar, T., Oguz, T., Kubilay, N. (2004). Satellite-detected early summer coccolithophore blooms and their interannual variability in the Black Sea. Deep-Sea Research I. doi.org/10.1016/j.dsr.2004.03.007
Kubryakov, A., Mikaelyan, A., Stanichny, S. (2021). Extremely strong coccolithophore blooms in the Black Sea: the decisive role of winter vertical entrainment of deep water. Deep-Sea Research I. doi.org/10.1016/j.dsr.2021.103554
Kopelevich, O. et al. (2014). Satellite monitoring of coccolithophore blooms in the Black Sea from ocean color data. Remote Sensing of Environment 146. doi.org/10.1016/j.rse.2013.09.009