Choose a county and a published data series. Download the chart as SVG, the values as CSV or a self-contained HTML file with definitions and source references.
Start with published data
Choose a county and the series you want to show. Every export keeps the values, period, unit, definition and source. The chart uses published values only; lines connect observed points and do not estimate values between years.
Age uses population by domicile, which can differ from usual-resident population. Dwellings with no enumerated residents are not necessarily abandoned or available. The school series counts villages in the analysed list, not schools or pupils; Bucharest is not covered.
The median age of each of Romania’s 3,181 localities, computed from the registered population by single year of age (INS, POP107D), on a map with every real boundary. Search your locality, see how old it is against the country and the county, its age fingerprint in one hundred squares, its pyramid by sex and its path from 1992 to 2026. In 528 localities there are now more registered people aged 80 or over than children under 10; in 1992 there were 9.
The 2021 Census counts 2.53 million unoccupied dwellings — 25.5% of the housing stock. In Mehedinți 36.3% are empty. County map, breakdown and why the rural empty stock does not solve city rents.
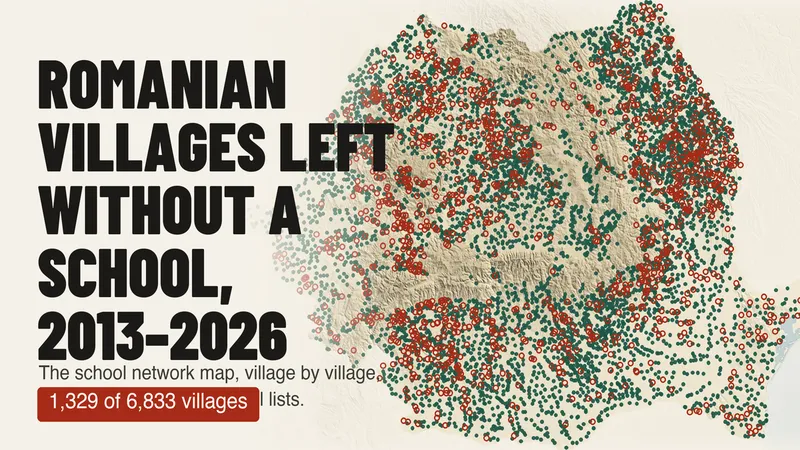
Of 6,833 villages with a school on the Ministry of Education's 2013–14 list, 1,329 have none in 2025–26. A map of every village over 13 years, and why the official count of rural schools (−76%) does not mean as many schools closed.