mariuscomper.ukRomână

The census of witnessed falls · 1800–2013

Stones fall the same everywhere. On maps, they don't.

Between 1800 and 2013, people recorded 1,048 meteorite falls they saw, each tied to a place. Nearly a third landed in Europe; only 1.6 percent in the Sahara. The sky does not tilt stones towards alphabets. The map counts the eyes that were up, the newspapers that retold the news and the museum ledgers that kept the stones — a census written over two centuries.

The globe of witnessed falls, 1800–2013

On this map, every dot is a stone seen falling by somebody, and written down.

—

Source: Meteoritical Bulletin via the NASA legacy file (data.nasa.gov). The historical file stops in 2013.

The 1930s, the archive's peak; the 1940s, its war

The first bar holds 17 recorded falls. The archive grows through the century and peaks in the 1930s with 91 falls. Then the war cuts it: in the 1940s, 58 falls, 36 percent fewer than the decade before. In the 2000s the numbers stand at 59 — close to the peak of seven decades earlier. The 2010s bar cannot be finished: the historical file stops in 2013.

The height of the bars does not come from the physics of the sky. The real fall rate, measured from the mid-20th century by camera networks, stays the same. What rises and falls on the chart is something else: the network that saw and wrote. The newspapers that retold the news of a stone fallen three villages away. Universities with chairs of mineralogy. Learned societies, with correspondence and a museum drawer for the piece. A fall that nobody writes down remains only a flash — in the sky of a place the archive missed.

17 falls in the 1800s180024 falls in the 1810s181024 falls in the 1820s182021 falls in the 1830s183031 falls in the 1840s184036 falls in the 1850s185056 falls in the 1860s186051 falls in the 1870s187040 falls in the 1880s188051 falls in the 1890s189055 falls in the 1900s190066 falls in the 1910s191069 falls in the 1920s192091 falls in the 1930s193058 falls in the 1940s194060 falls in the 1950s195059 falls in the 1960s196058 falls in the 1970s197056 falls in the 1980s198054 falls in the 1990s199059 falls in the 2000s200012 falls in the 2010s, through 20132010
Each bar: recorded falls per decade, in the counted body (1,048 across the whole window). The 2010s bar is partial: the historical file stops in 2013.

Density of population is seen clearly to be a reason for the concentration of known meteoritic falls.

F. C. Leonard, 1941 — an early statistical study of meteorite falls (1,388 falls analysed)

Per million square kilometres, the same distortion. Recorded falls between 1800 and 2013 are nearly 13 times rarer in the Sahara than in Europe — though the two bands cover areas of the same order of size.

BandArea, million km²Recorded fallsPer million km²
Sahara8.88171.91
India6.6413720.62
Europe12.7131324.62

The areas differ, but the metric is already normalised: the 13-fold gap remains the work of eyes, not of the sky.
The map corrects itself in place: 2019–2024

The census is not a stone set into a wall. It is a register that is still being kept: the official coordinates of several falls moved between 2019 and 2024, after researchers reread the period documents and walked the ground.

The sharpest example: Buschhof, the fall of 1863, accounted for a century and a half as Transylvania. In September 2024, Meteoritical Bulletin 113 published its real site: 56°18′ N, 25°55′ E — Latvia, 1,095.9 km from the old point. The raw file still carries the Transylvanian dot, with no correction note.

Every correction began on paper and ended on the ground; the method is the same for the whole map: whoever finds the right point also writes it back into the register, with the date of the repair beside it.

FallThe official correctionWhere and when it is written
Buschhof (1863)the real site is Latvia: 56°18′ N, 25°55′ E2 Sep 2024, published in MB 113
Mező-Madaras (1852)shifted 100.3 km: today Mădăraș, Mureș (46°36′ N, 24°26′ E)4 Oct 2019; republished in MB 108 (2020)
Ohaba (1857)county corrected: Alba, not Hunedoara (46°4′ N, 23°47′ E)published in MB 108 (2020)
Kakowa (1858)shifted 6.8 km: today Grădinari, Caraș-Severin (45°7′ N, 21°35′ E)4 Jul 2020
Tauti (1937)shifted 130.7 km: today Tauț, Arad (46°17′ N, 21°55′ E)the MB 56 (1979) record says “Oradea”; today's entry shows both places
Silistra (1917)country and county corrected: Bulgaria18 Dec 2020

The corrections of 2019–2024 say, from the inside, what this piece argues: the map of falls is not a physical model. It is a register, kept the way registers are kept: first-version mistakes are repaired on paper, with the date of the repair written beside them.

The Wold Cottage stone: the fall England kept

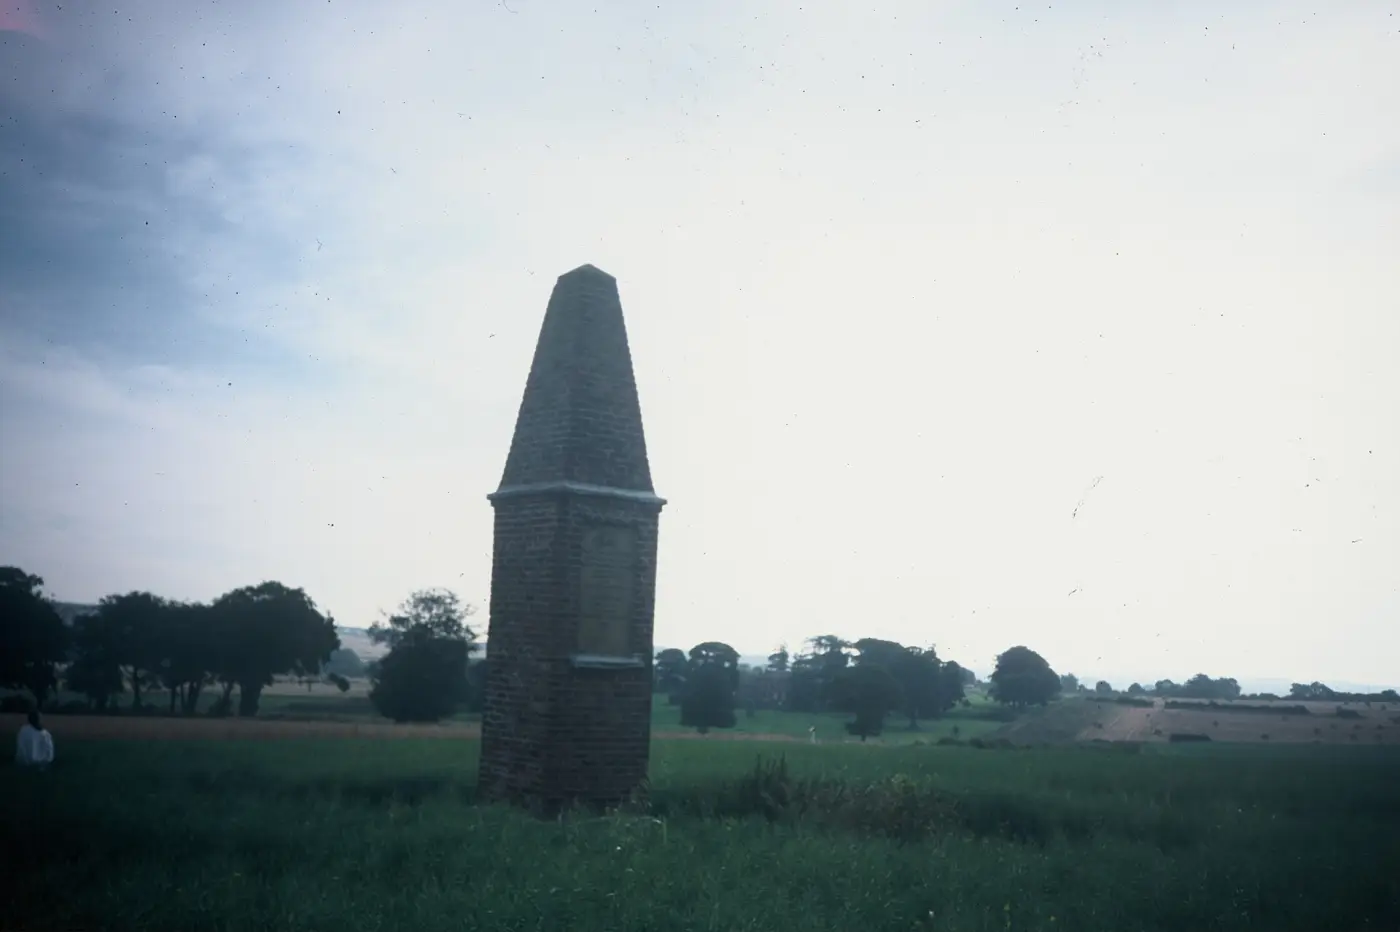
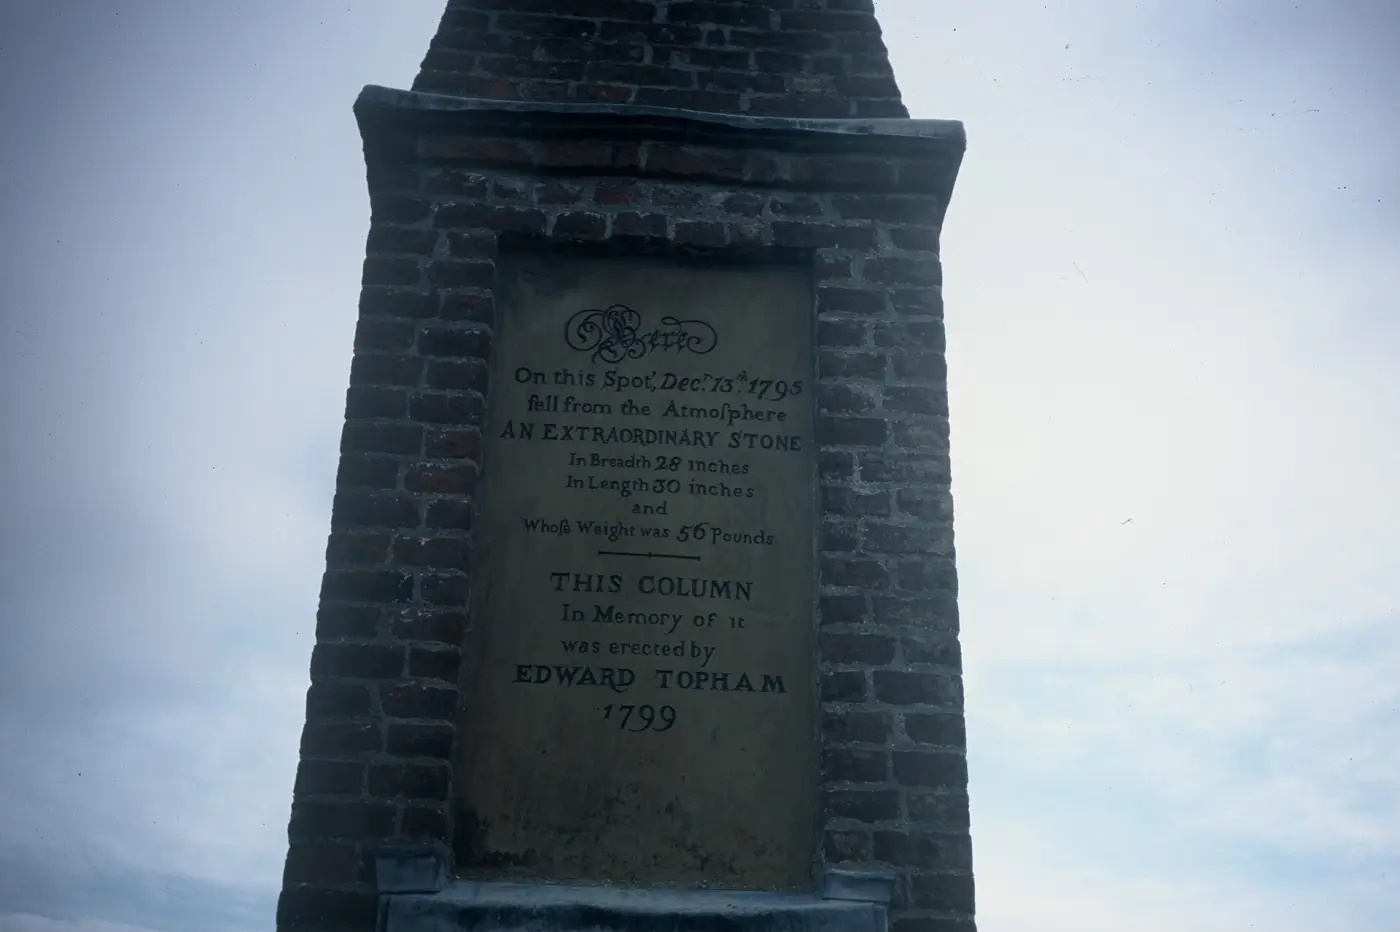
On 13 December 1795, on a farm by Wold Newton in Yorkshire, a stone fell out of the sky and was picked up where it landed. Edward Topham, who lived at Wold Cottage, raised a column on the very spot in 1799, and a plaque carried the fall's story into type: it announces the day, the place, the stone's weight and the builder of the column.

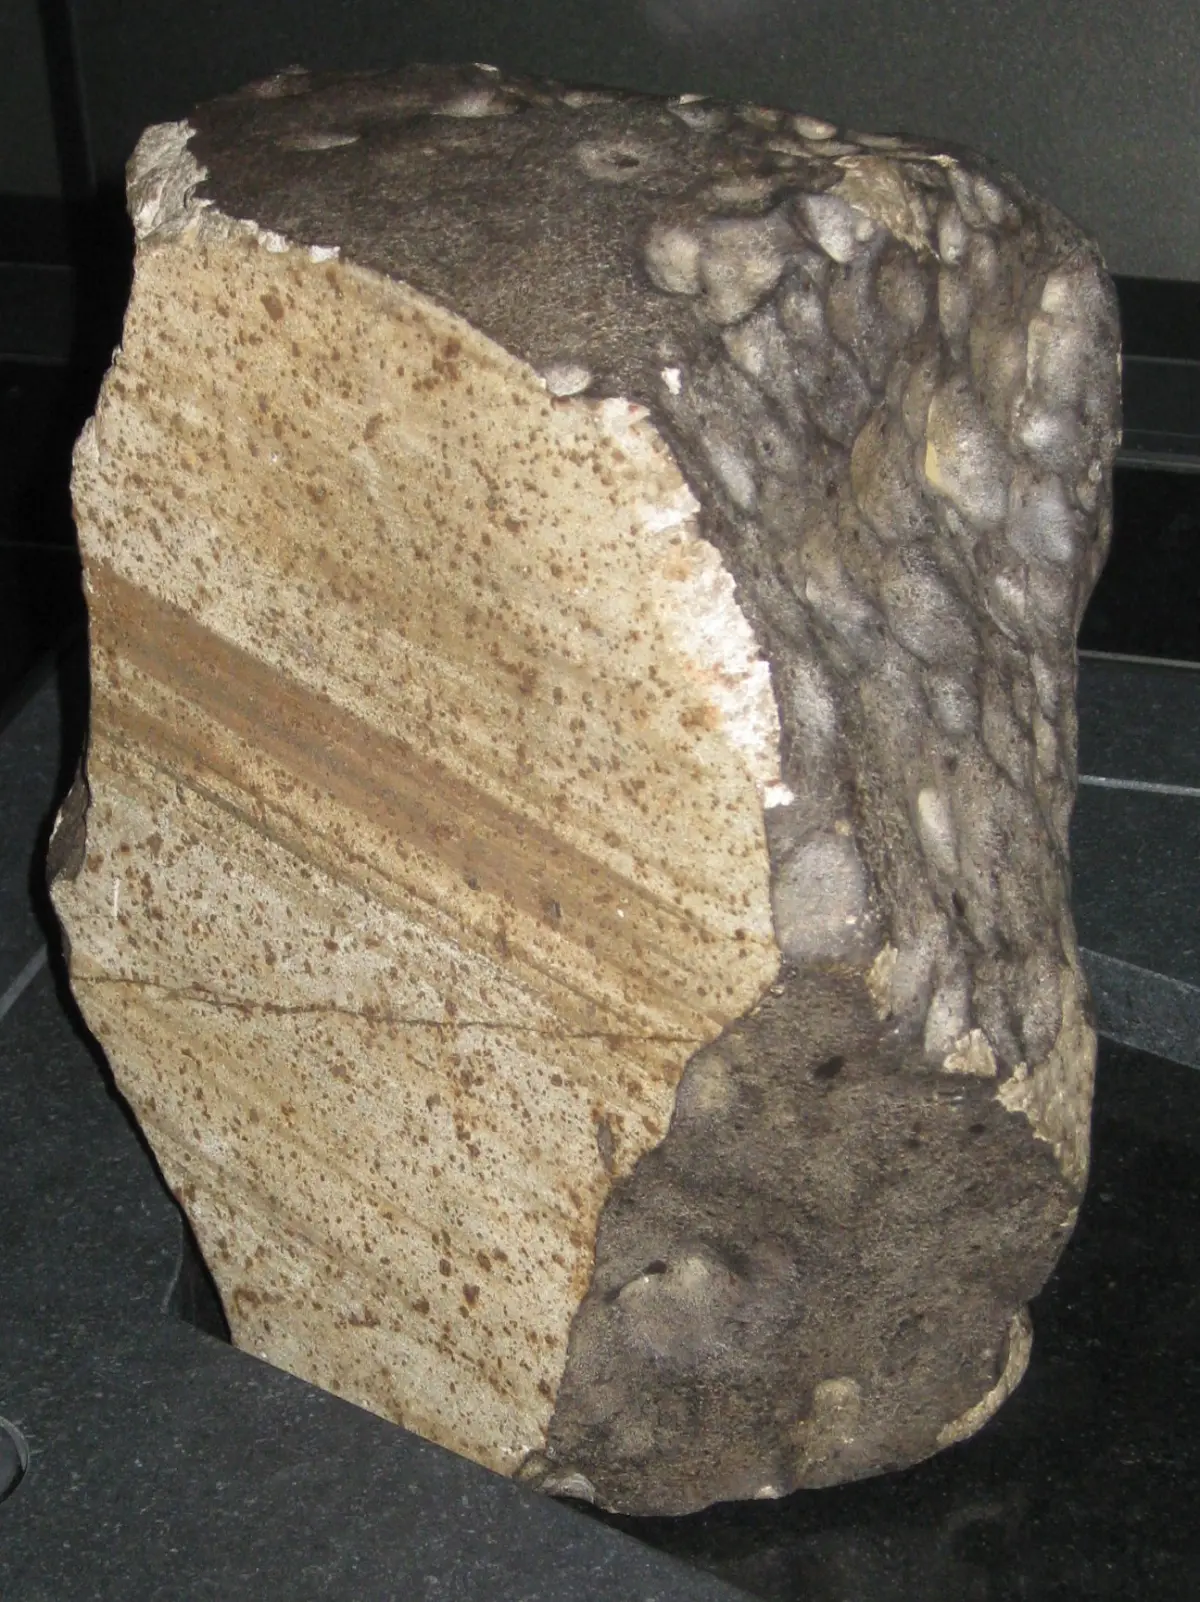
Today's official record keeps the same fall under its own fields: Wold Cottage, observed fall, 1795, L6, 25 kg — the plaque's 56 pounds, rounded — with coordinates near Wold Newton, Yorkshire. The Natural History Museum in London keeps the stone.

For this census, the column in the field says what the chapter tables cannot: a fall becomes a story only when somebody sees it, and ground that can hold the stone gets a text over it. The Wold Cottage stone would enter the census the way the dots on this map do: seen, placed, written down. It fell in 1795, before the 1800–2013 window of the globe, but it fixed the form of the record that the 1,048 falls in that window followed.

Here on this Spot, Dec 13th 1795 fell from the atmosphere AN EXTRAORDINARY STONE … Whose Weight was 56 Pounds. THIS COLUMN In Memory of it was erected by EDWARD Topham 1799.

The inscription at the Wold Newton column, photo David Hillas, CC BY-SA 2.0
The Wold Cottage stone against glass: a dark, irregular stone
The Wold Cottage stone, as kept by the Natural History Museum, London. Photo Chemical Engineer, CC BY-SA 3.0, via Wikimedia Commons.
Cut letters on a panel of the Wold Newton monument: the 1799 inscription
The inscription at Wold Newton, as it reads today: the column built by Edward Topham in memory of the fall. Photo David Hillas, CC BY-SA 2.0, via Wikimedia Commons.
The Wold Newton monument with its inscription panel, photographed from the road
The monument to the fall near Wold Newton, Yorkshire. Photo David Hillas, CC BY-SA 2.0, via Wikimedia Commons.

When the archive stops, satellites keep counting

The historical file of falls stops in 2013, with Chelyabinsk. Satellites went on counting. NASA's CNEOS register holds 938 large atmospheric fireballs between 2000 and 4 October 2026: 813 carry a published coordinate, 125 do not. More than that, 73 percent of the ones with a position flash outside every border on the map of countries — open sea, straits, small islands the country map misses: exactly the places where, for two centuries, nobody could keep a register of fallen stones.

The most energetic detection in the register was no exotic event: it is Chelyabinsk, February 2013, assessed at 441 kilotons of impact energy — the same bolide that gives the historical archive its last recorded fall. After it, the sky has been written down only in files.

The thesis has instruments in the literature too. In 2002, Peter Brown and colleagues reported in Nature the flux of fireballs measured over almost nine years by the sensors of US Department of Defense satellites. In 2015, Borovička and colleagues could count only 24 instrumentally documented falls — in the whole world, across the whole instrumented era. That far and no further, in the published literature: no paper sets the archive of witnessed falls against the satellites' fireball register the way the table below does, band by band.

Above Romania, a single event in the register has its ground point inside the border: 7 January 2015, 0.41 kt, the Buzău–Vrancea corridor — about 50 km north-east of Pleșcoi, the fall recorded in 2008. It did not become a fall in the Meteoritical Bulletin catalogue: no stone found and classified.

The satellite series: CNEOS fireballs, 2000–2026

—

Source: NASA's CNEOS program, file downloaded on 9 Nov 2026, valid through 4 Oct 2026. The coordinate is the ground point under peak brightness; energy is the estimated impact energy, in kilotons.
BandRecorded falls per million km² (1800–2013)Placed fireballs per million km² (2000–2026)
Sahara1.911.13
India20.620.6
Europe24.621.49

The fireball rate stays between 0.6 and 1.49 on all three bands, nearly equal; the rate of recorded falls reaches 13 times. The eyes remain the variable that matters, not the shower of stones.

Method, limits, sources

The body of falls comes from NASA's “Meteorite Landings” file, the Meteoritical Bulletin transcription with 45,716 rows. I kept witnessed, valid falls from 1800 to 2013 with sound coordinates: 1,048. Ten had no coordinates at all and one (Mason Gully) was masked at (0,0); all stayed outside the body. The dots on the globe are the file's own; where a Meteoritical Bulletin record corrects the site, the corrections table for 2019–2024 tells the two apart.

The body of fireballs is the public CNEOS register (JPL/NASA): 938 events between 2000 and 4 October 2026. For each, date, lat/lon and altitude mark the point of peak brightness, not where a stone landed: stones can drop tens of kilometres away. The energy quoted is the estimated impact energy from the USG sensors, in kilotons. 125 events have no published position: they are counted, but do not sit on the map.

The archive–satellite comparison runs on three fixed rectangles, the same for both: Sahara 15–30° N, 17–35° E; India 8–32° N, 68–92° E; Europe 36–70° N, 11–40° E. The correlation between recorded falls and population runs on country-by-decade cells, with zero cells included and countries under 5,000 km² excluded: Spearman ρ +0.176 (p 0.0011, 3,784 cells). A small correlation, above noise; the variant that gave 0.58 counted only non-zero cells and was biased by selection — I dropped it on purpose.

The text keeps out everything that cannot stand on the sources included: no quote from period press; the disputed dimensions of the Wold Cottage stone — 30 or 36 inches, depending on the contemporary artifacts — are not stated. Masses and classes come from the Meteoritical Bulletin records. The counting scripts and the published files sit beside the piece: every number in the text was recomputed automatically before publication.

The full list of sources, with an access timestamp per entry, is published beside the piece. the sources list