A painting from 1817 · Făgăraș, Romania
In 1817 a painter drew the Făgăraș mountains 2–3 times sharper than they are
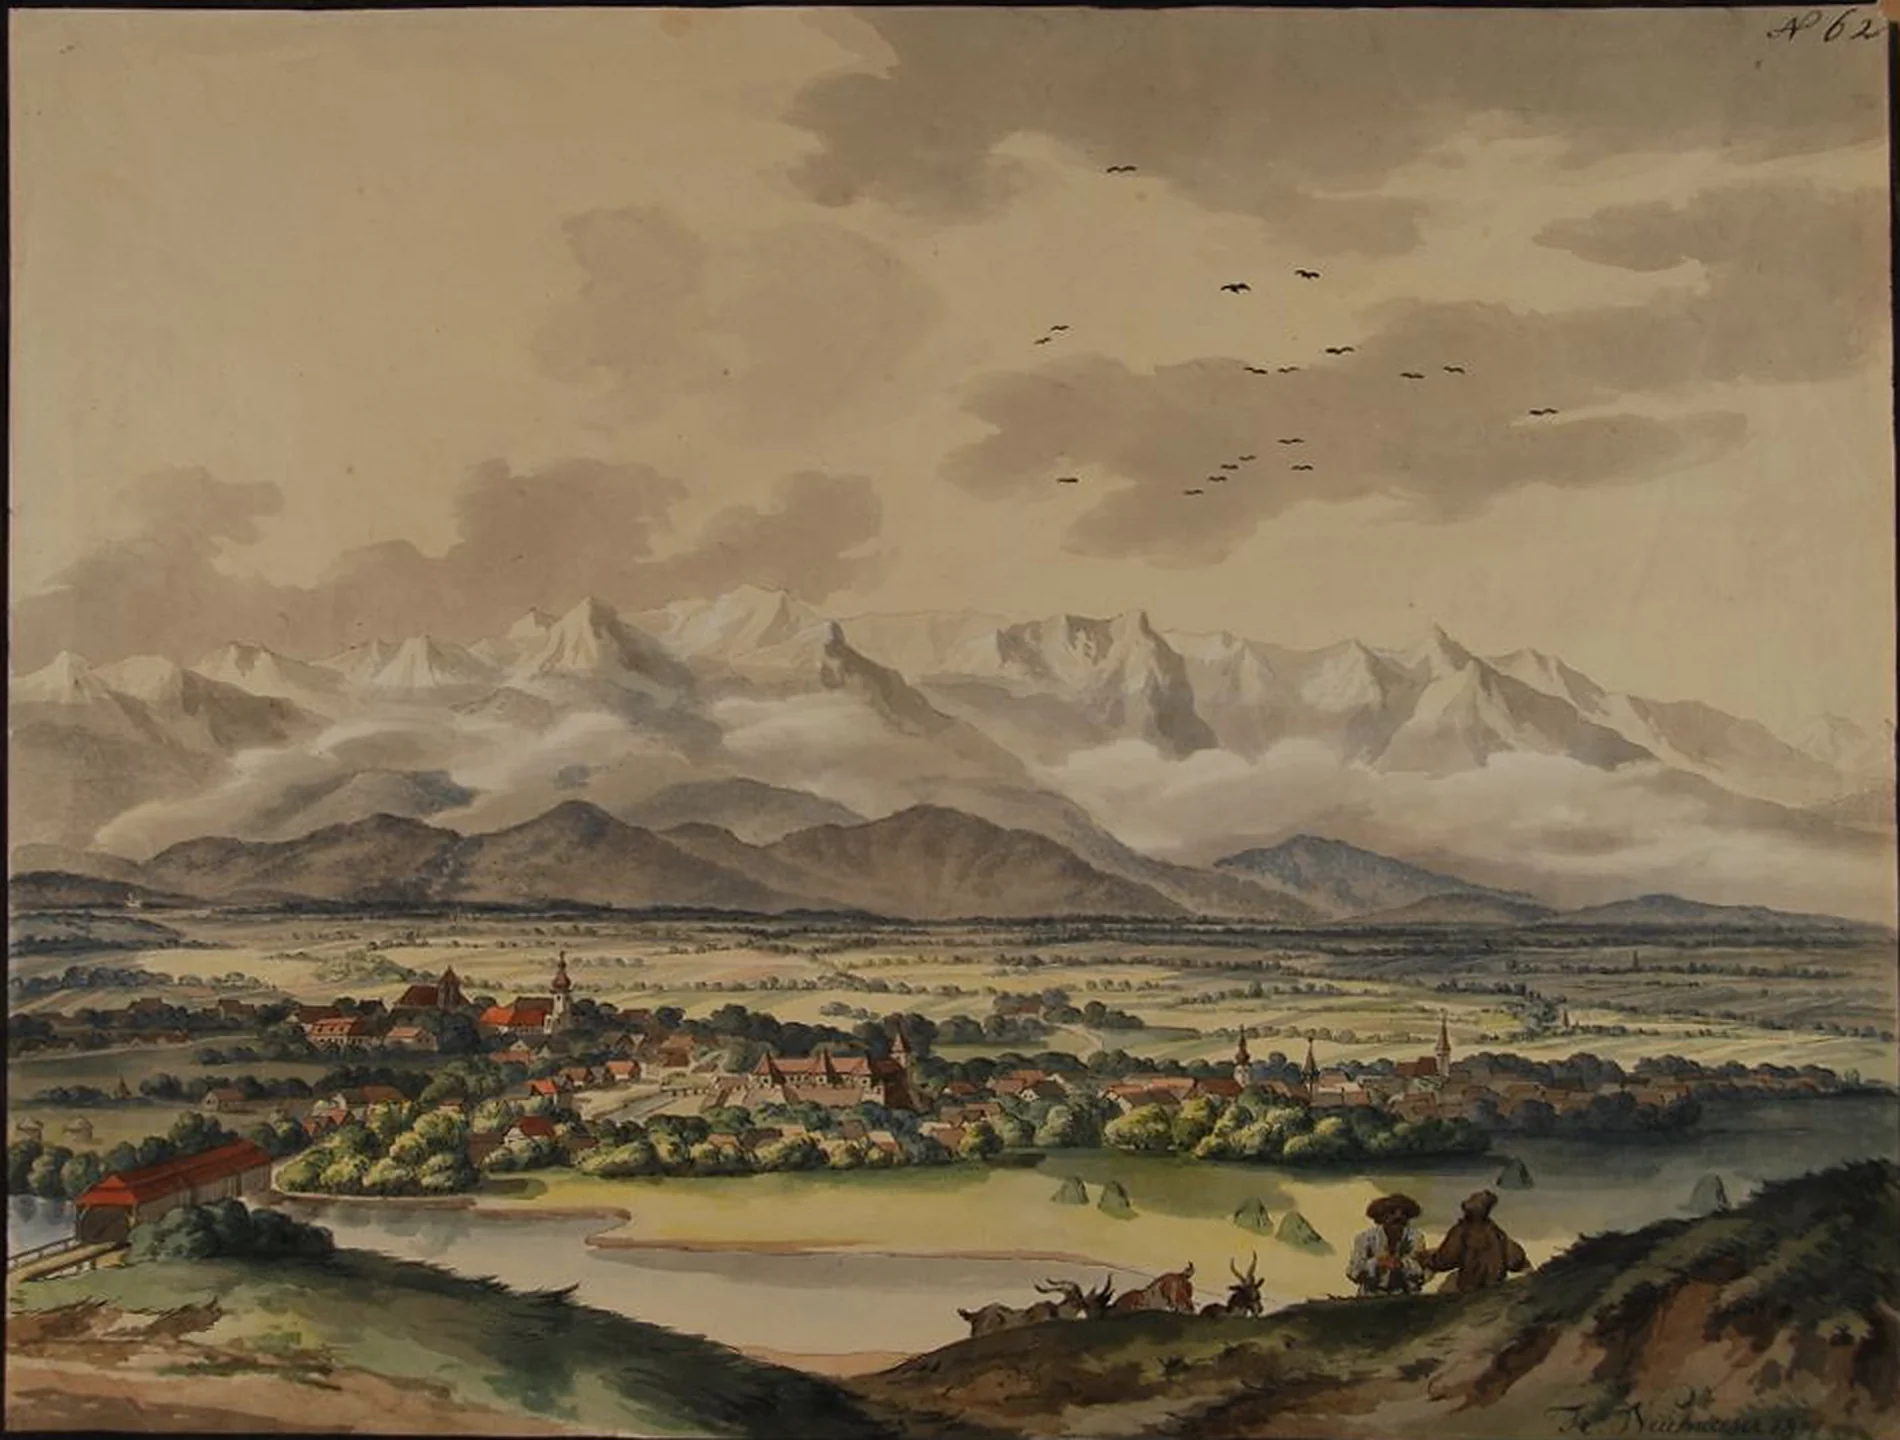
Franz Neuhauser painted the Făgăraș range from the hills to the north. Laid on the real relief, taken from satellite data, his peaks are 2.2–3.1 times steeper than the eye would have seen. Drag the slider to see the difference.
#The same landscape, with the real mountains
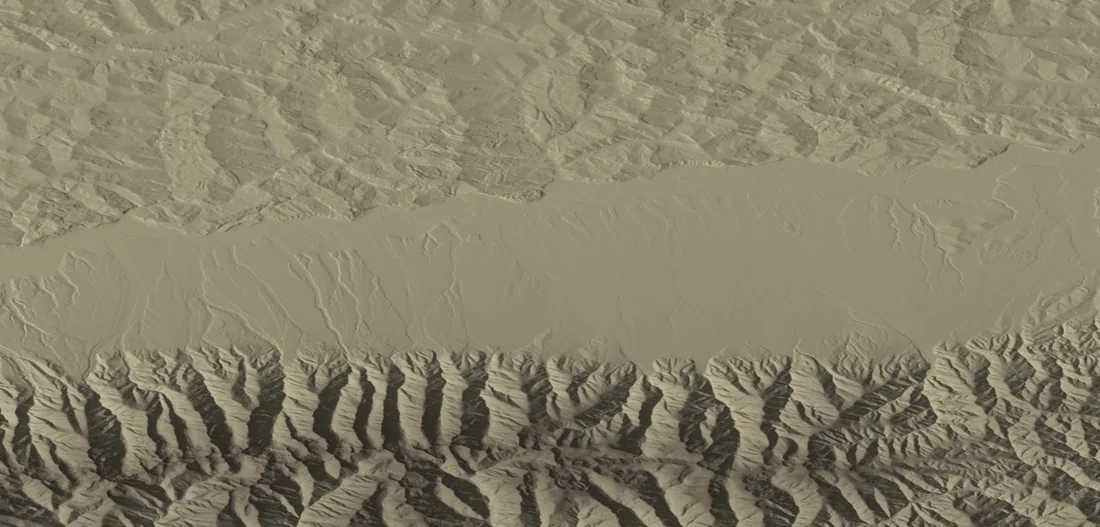
Below is the same view rebuilt from the real relief: the town sits where the painter put it, and the mountains appear at their true size, a low band on the horizon. Drag the handle to pass from the drawing to reality. Then “stretch” the mountains upward until they reach as high as in the drawing, and see how much they had to be raised. The hills in front grow with them.
#How sharp are the mountains in the drawing?
Sharpness is easy to measure: how much the crest line rises or falls with each step to the left or right. In the drawing that line is steeper than in reality, on average by 2.8 times. The painter did not write down where he stood or how much of the horizon he meant to fit on the sheet, so 15 possible places and several widths of view were tried. For a landscape drawn from one place, between a sixth and a quarter of the horizon circle, the result stays between 2.2 and 3.1 times.
Height matters too. Under the same conditions, the tallest peak in the drawing would stand 3.7–5.2 times lower in reality. The result comes from 150 trials; the gentlest gives 2.0 times, the steepest 4.5, and in every one the drawing comes out sharper than the terrain.
The result, by how much of the horizon fits in the drawing
The dot is the middle value over all the places he could have painted from; the line shows where most cases fall (10–90%). 1× would mean a drawing true to reality.
#Where did he paint from?
The museum notes that Neuhauser sat on the hills on the right bank of the Olt. The exact spot cannot be found from the drawing, so 35 points north of the town were tried (the white rectangle). From 15 of them the range shows over the hills in front; from the other 20 it is largely hidden, so they were not used. The view above is rebuilt from one point with a clear view, 9.4 km from the fortress. A representative spot, with no claim that he stood there.
 point in the picture
fortress
Moldoveanu
Negoiu
A clue on the left of the painting: the covered bridge
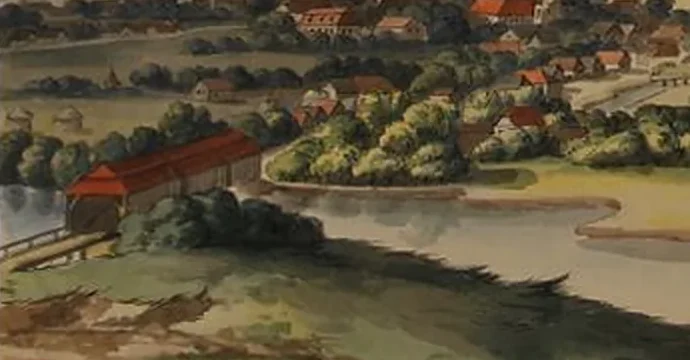
In the lower left corner, across the Olt, stands a long building with a red roof. It looks like a covered wooden bridge. Făgăraș had one: a timber bridge with three arches, built between 1778 and 1782 and taken down in the early 1900s. Strada Podului, “Bridge Street”, by the river still carries its name.
The match is plausible, not proven. The painted shape, direction and size were not compared with an old photograph, and the position of the old crossing has not been reconstructed. So the bridge does not show where the painter stood, and it does not change the measurement above.
#Why the drawing looks different
The panorama is a composition. The town is enlarged against the mountains, the sky takes half the sheet, and the crests are white and jagged as in an alpine landscape. The museum catalogue files it under the “Transylvanian school”.
The art historian Doina Pungă studied the series of 74 gouaches and watercolours this sheet belongs to (1815–1819) and found real Transylvanian motifs set in fantasy landscapes. The Făgăraș panorama is number 62 on the list, and “62” is also visible in the corner of the sheet. That does not show that the picture is stitched from several views. It only means there is no reason to expect every detail to follow the geometry of a photograph.
Nothing here says the painter erred or meant to deceive. The page only shows how far the sheet drifted from what the eye would have seen from the hill: how much is painting and how much is terrain.
#Questions
Which peaks are in the drawing?
Those of the Făgăraș range, home to Romania’s highest: Moldoveanu (2,544 m) and Negoiu (2,535 m), 40–50 km from the town. The sheet does not name its peaks, and the drawn ones could not be matched to real ones with confidence, so the page does not claim it.
Did Neuhauser get it wrong?
The page cannot know what the painter intended. The numbers only show how far the drawing is from the real relief.
How firm is the result?
The crest line was traced by hand, the painter’s spot is unknown, and the measure was chosen after the drawing had been seen. Still, in all 150 trials the drawing comes out steeper than reality, from 2.0× to 4.5×. The trials are not independent (the same 15 places and the same 5 widths of view), so they are not 150 separate proofs.
#Method
The sheet: the museum photo shows the paper lying on a table, with EXIF rotation and wood around it. It was straightened with a homography from the four corners of the black ruled border (950×720 px, ratio 0.76) and enlarged two times.
The crest: the line of the white crests was traced by hand, in 50 points, on pixel grids. Slopes were taken between points 20 and 40 px apart on the sheet (2 and 4% of its width).
The terrain: Copernicus GLO-30 (30 m), window 24.3–25.45° E and 45.4–46.0° N. For every standpoint the skyline of terrain above 1,800 m (the high range, not the hills in front) was computed on rays every 0.05°, out to 75 km, with Earth curvature and standard refraction (0.13). The same angular distance was taken on the terrain from the assumed view width: an equal-angle projection, so the same scale horizontally and vertically.
A negative result: matching individual crests to the terrain failed. Several standpoints tens of kilometres apart gave the same correlation, and the landmarks in town (the fortress, the churches) could not be tied with confidence to the painted towers. So the test runs over every standpoint and every plausible view width.
Limits: the town and the mountains in the painting are not at the same scale, so “slope” means appearance, not intent. The Copernicus model is a surface model (forests and buildings included); the crest picked is the tallest in view. The render is a reference, not a photograph. The result is conditional on the equal-angle model and on an outline traced by one person; no independent re-tracings were made. A standpoint is kept if, for at least 60% of the rays towards high terrain, the crest shows at the same angular height as the unobstructed terrain (±0.02°).
#Sources and credits
- Europeana: Franz Neuhauser, Panorama of Făgăraș (Brukenthal National Museum, via CIMEC)
- CIMEC, Clasate: record XI/884
- Copernicus DEM GLO-30 (ESA), via AWS Open Data
- OpenStreetMap Nominatim: coordinates of Făgăraș fortress
- Făgăraș Town Hall, Tourist Monograph, pp. 142–143: the covered bridge and Strada Podului (in Romanian)
- András Emődi (2025), study of timber bridges, pp. 25–28: dating 1778–1782 and demolition (in Hungarian)
- Doina Pungă (2002), Franz Neuhauser the Younger and the age of lithographic incunabula in Transylvania, pp. 75–76 (in Romanian)
Image credits
- Sheet image: Brukenthal National Museum / CIMEC, CC BY-SA 4.0
- Relief: contains modified Copernicus DEM GLO-30 data, © DLR/ESA
- Place data: © OpenStreetMap contributors, ODbL
The sheet (CIMEC photo, 1200×803 px) was straightened and enlarged; the versions on this page are shared under the same licence, CC BY-SA 4.0.