mariuscomper.uk RO

The Moon, the Earth and the clouds

The Moon’s ashen glow comes from Earth’s clouds

When the Moon is a thin crescent, you can still make out the rest of its disc, faint and grey. That is sunlight bounced off Earth onto the Moon, and most of it is bounced by clouds. Seen from Britain or Romania, the evening crescent is lit by clouds over the Atlantic and the Americas. Measured for twenty years, this glow shows, as satellites do, that Earth reflects less than it did in the early 2000s.

#What the Moon sees at the same moment

When you see a crescent, the Moon sees an almost full Earth. This is Earth as seen from the Moon on 19 April 2026 at 21:04 in Bucharest (19:04 in London), pieced together from that day’s NASA satellite pictures.

The middle of the lit face the Moon could see was over the Caribbean Sea. The light falling on the Moon’s dark part comes from that whole face, most of it from around its middle, and reaches your eye after bouncing once more, off the Moon.

#Leonardo explained it five hundred years ago

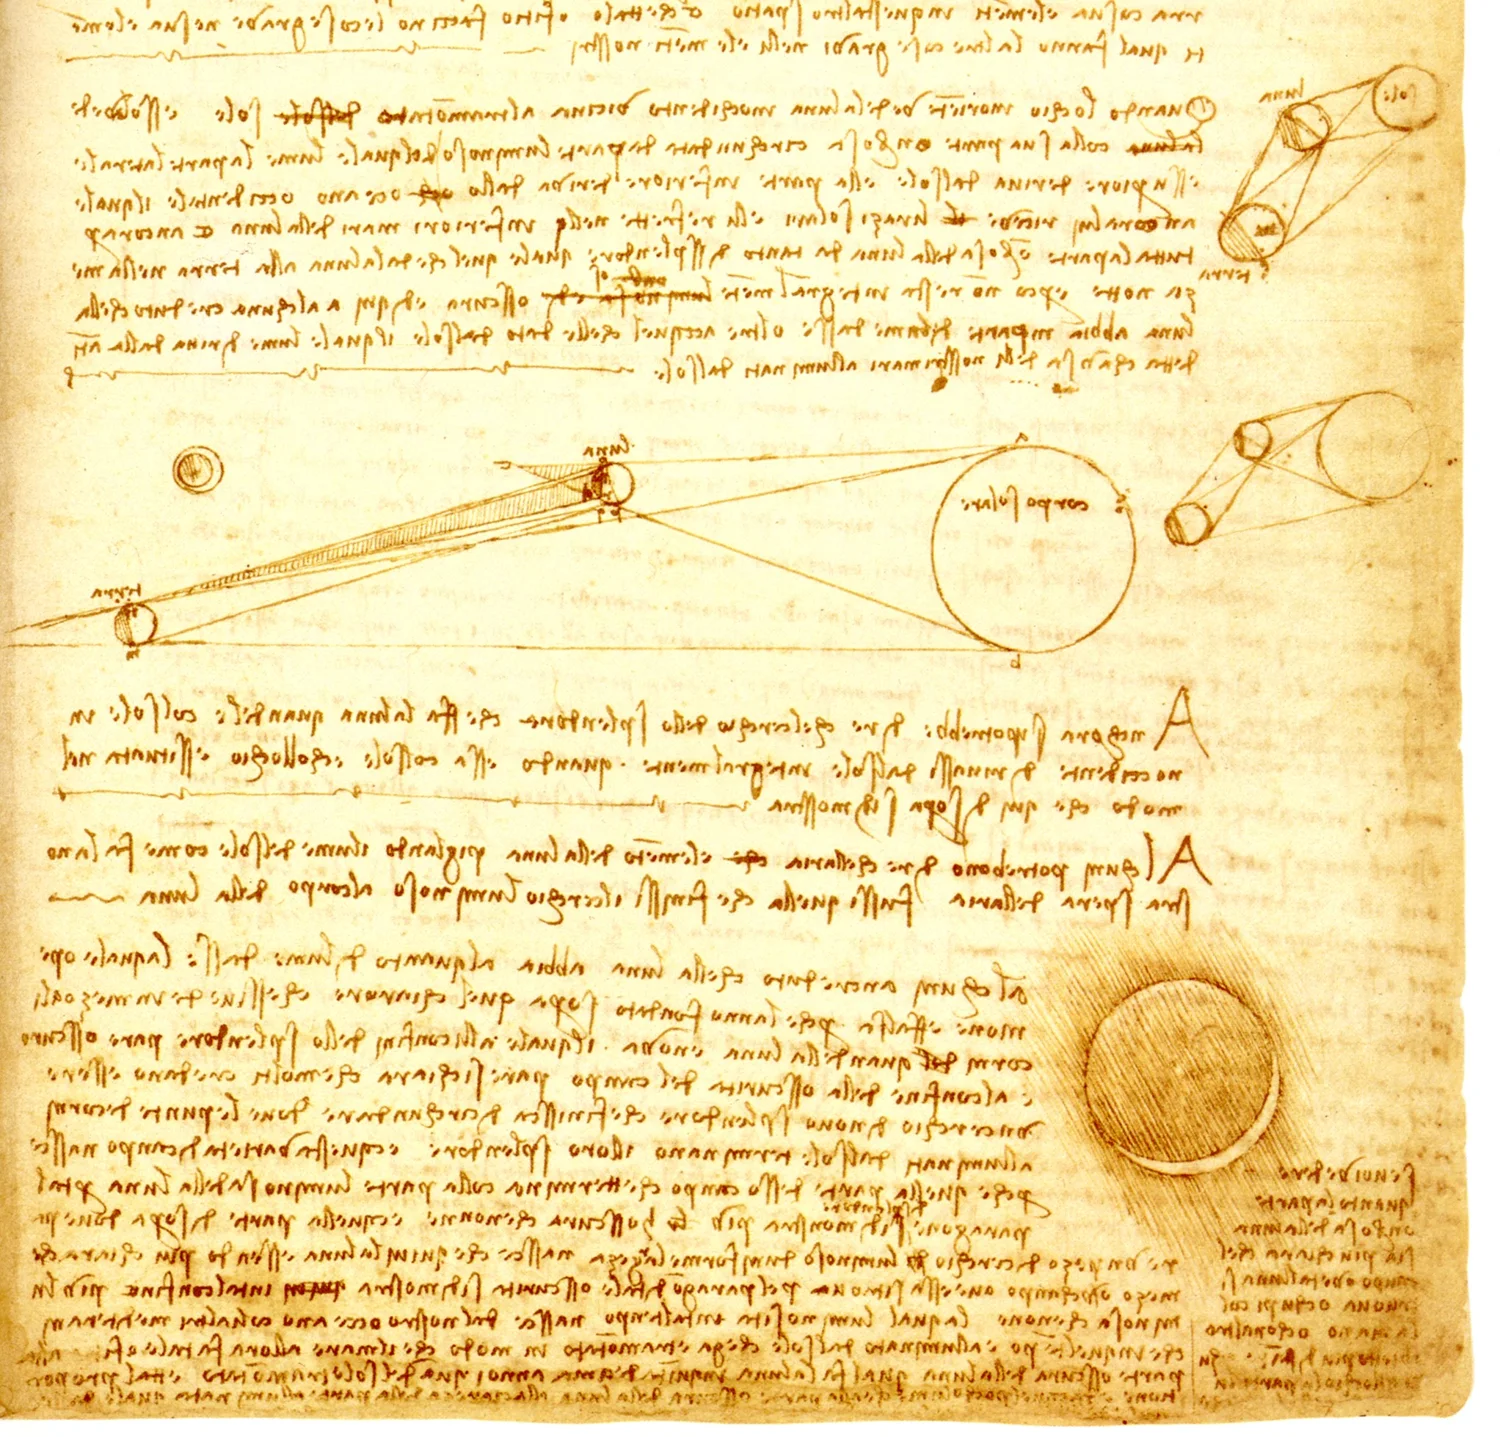
On a sheet of the Codex Leicester, written in the early 1500s, Leonardo da Vinci drew the Sun, the Earth and the Moon and explained the ashen glow: Earth, lit by the Sun, in turn lights the Moon. He thought, though, that the light came off the water of the seas.

Open sea, though, is among the darkest parts of Earth. According to the Big Bear team, oceans send back about a tenth of the light they receive, clouds about half, snow and ice more still.

#Without clouds, the glow would drop to about half

NASA’s CERES satellites have measured since 2000 how much sunlight Earth sends back to space: on average 98.8 watts per square metre, averaged over the whole planet, day and night. For clear skies everywhere, the same satellites estimate only 53.3 (2001–2025 average). The difference, 46% of the total, is the clouds’ effect as CERES calculates it.

Press the button: the same Earth without clouds (for each place, one of the clearest days of that month; where clouds almost never clear, as over the Southern Ocean, some remain). The dark part of the Moon loses about half its light; on the evening shown, about 58% remains. That is an estimate from the pictures, matched to the ratio CERES measures, not a measurement of that evening.

#Evenings the Atlantic, mornings Asia

Which part of Earth lights the Moon depends on where and when you look. From Bucharest, the Romanian edition’s home city, the evening crescent after new Moon is lit by the Atlantic and the Americas: on 2026 evenings, an hour after sunset, the middle of the lit face sat around 59° W, near the equator; from London it sits a little further west. The light still comes from a wide area, up to half the globe.

The morning crescent before new Moon is lit by Southeast Asia, Indonesia and the Indian Ocean, around 109° E. At the Californian observatory that measured the glow for 20 years, evenings showed the Pacific, mornings the Atlantic and the Americas.

#Twenty years of measurements from a Californian mountain

Between 1998 and 2017, Big Bear Solar Observatory compared, on clear nights, the ashen part of the Moon with the sunlit part. Their ratio shows how brightly Earth shines. The observatory’s public file holds 550 good nights.

The yearly average rises and falls, but in 2015–2017 it sat below 1999–2001 by the equivalent of about 0.5 watts per square metre of reflected light. About half of the drop comes in the last three years. The chart is rebuilt here from the observatory’s file; the difference matches the team’s paper (Goode and colleagues, 2021).

Yearly values (W/m² from the mean)
yearEarthshine (Big Bear)
19990.22
20000.26
20010.42
20020.17
20030.38
20040.43
20050.15
2006—
20070.28
20080.03
2009−0.27
2010−0.07
20110.47
20120.11
20130.10
2014−0.10
2015−0.22
2016−0.31
2017−0.12

#The satellites show a fall too, and it goes on

Over the years they share, both measurements fall: CERES by 0.60 watts per square metre per decade, the ashen glow by 0.35. The series meet the pre-set conditions on direction and slope ratio; the rebuilt yearly values could be checked only on the change between the ends, because the paper does not publish them. From one year to the next, though, the wiggles match poorly (correlation 0.18 once the trend is removed): a telescope in California and the satellites see different parts of the planet from different angles.

The CERES record runs to August 2026. In 2021–2025 Earth sent back 97.9 W/m² on average, against 99.5 in 2001–2005: 1.6% less. The darkest year was 2023. By 2010–2014 the average had dropped only 0.2 W/m²; the rest, 1.4 W/m², came afterwards.

Yearly values (W/m² from the mean)
yearEarthshine (Big Bear)CERES (satellites)
19990.22—
20000.26—
20010.420.58
20020.170.54
20030.38−0.04
20040.430.12
20050.150.09
2006—−0.03
20070.280.12
20080.03−0.16
2009−0.27−0.07
2010−0.070.42
20110.470.12
20120.11−0.30
20130.100.18
2014−0.10−0.13
2015−0.22−0.59
2016−0.31−0.74
2017−0.12−0.76
2018—−0.71
2019—−1.24
2020—−0.82
2021—−0.90
2022—−1.00
2023—−1.81
2024—−1.17
2025—−1.62

#Where Earth got darker

On the globe, the difference between 2021–2025 and 2001–2005, from the one-degree CERES grid, lightly smoothed. Red means less light sent back, blue more. A large red patch lies in the north-east Pacific, off California: −3.9 W/m² on average between 15° and 45° N and 115° and 150° W.

The CERES team (Loeb and colleagues, 2021) put the rise in absorbed sunlight over 2005–2019 mainly down to clouds and sea ice reflecting less. For the record year 2023, Goessling and colleagues (2025) point mainly to fewer low clouds. Drag the globe to turn it.

Arrow keys turn the globe

#Can you see it with the naked eye? No

For the climate it matters: with 1.6 fewer watts per square metre reflected, the planet absorbs more sunlight, all else being equal. On the Moon, the difference cannot be seen.

From one evening to the next, the glow varies far more. Across the 89 crescent evenings and mornings of 2026 here, the reflectance of the face the Moon sees ran from 0.32 to 0.43, and how much of Earth is lit changes more still. A single night says little: checked on 422 Big Bear nights, the day’s satellite pictures explain very little of that night’s measurement (correlation 0.12). The trend emerges only in averages over several years.

#Your crescent

Pick a city and a crescent evening or morning of 2026 (chosen for Bucharest, up to 8 November 2026). The time runs while it is dark and the Moon is up.

#Questions

What is earthshine?

The faint light on the part of the Moon the Sun does not light. It is sunlight reflected by Earth onto the Moon and then by the Moon back to Earth. It shows best when the Moon is a crescent. In Romanian it is lumina cenușie a Lunii, “the Moon’s ashen light”.

When can I see it best?

In the evening two to four days after new Moon, after sunset, low in the west; or in the morning two to four days before new Moon, before sunrise, in the east. The thinner the crescent, the fuller Earth looks from the Moon and the stronger the glow, though a very thin crescent sits low in the twilight. A clear sky and an open horizon help.

Why is Earth reflecting less light?

Studies of the CERES data find clouds, low clouds especially, and sea ice reflecting less. How much is global warming and how much natural swings such as the Pacific oscillation remains under study.

Is the picture of Earth a photograph?

It is pieced together from daily NASA satellite pictures (VIIRS and MODIS), each place from its own day, then put on a globe and lit as at that minute. The satellites photograph in daylight; the picture mostly uses that day’s images, with gaps filled from neighbouring days (up to two). So the clouds are mostly that day’s, not that minute’s.
#How it was done

The test was written before the data was opened: earthshine and CERES both had to fall (or both rise), one slope had to lie between a third and three times the other, and the yearly values had to be rebuildable to within 0.1 W/m². Over the shared years (2001–2005 and 2007–2017; in 2006 the observatory was under construction) the ratio came out at 0.57. Yearly values are the mean of each year’s nights, converted to equivalent watts per square metre as in the paper (albedo 0.30 × 340.2 W/m²). The paper gives no table of yearly values, so the rebuild could be checked only on the change between the ends. The CERES map is smoothed by about two degrees.

Picture of Earth: for each place, the VIIRS image of its own local day, with gaps filled from another satellite or from neighbouring days (up to two). The brightness of the face the Moon sees is the reflectance averaged with weights for sunlight and for the angle towards the Moon. NASA’s corrected images account for part of the air’s effects, and the “cloudless” Earth is built from each place’s clearest days, so it can keep some cloud. Both therefore get one added constant (0.132), chosen so the median cloudless-to-cloudy ratio equals the CERES one (0.54). It is an empirical fit and does not check any single evening.

The night-by-night check (also set in advance) used 422 Big Bear nights from 2000 on. The first run misread the file: its dates are days, not hours; the corrected run, with times assumed from sunset and sunrise, gives a weak link that depends on how the dates are read (correlation 0.12; evenings 0.22, mornings 0.04). Pallé and colleagues compared nights with simulations as early as 2003.

The Moon’s place in the sky and the tilt of the crescent are computed for the chosen city and minute. The Moon’s face is not turned for libration. The ashen part is brightened for the eye: in reality the crescent is a few thousand times brighter.

#Sources

NASA images and data are in the public domain. The Big Bear data and the 2021 paper belong to their authors. The page loads no outside services.