Lake by lake: when the satellite saw the ice go
Twenty-eight lakes between 0.4 and 9.3 ha, every spring from 2018 to 2026. “Springs with a pair” counts the years in which a clear pass saw the lake frozen and a later clear pass saw it open. Dates are medians over those years, and the true ice-out of any single spring lies between the two dates of that spring.
| Lake | Altitude | Area | Springs with a pair | Last seen frozen (median) | First seen open (median) | Ice then (est.) |
|---|
| Lacul Bucura | 2,032 m | 9.3 ha | 5 | 21 May | 11 July | 53–126 m |
|---|
| Lacul Zănoaga Mare | 1,996 m | 6.8 ha | 7 | 15 May | 16 June | 42–118 m |
|---|
| Negru | 2,006 m | 4.8 ha | 6 | 15 May | 24 June | – |
|---|
| Galeș | 1,966 m | 3.9 ha | 5 | 5 May | 7 July | 45–92 m |
|---|
| Zănoaga Mică | 1,966 m | 3.8 ha | 2 | 28 April | 31 May | – |
|---|
| Slăvelu | 1,932 m | 3.7 ha | 8 | 7 May | 18 June | 37–88 m |
|---|
| Ana | 1,975 m | 3.6 ha | 5 | 5 May | 16 June | 57–148 m |
|---|
| Gemenele | 1,892 m | 2.7 ha | 6 | 14 May | 11 July | – |
|---|
| Tăul Custura Mare | 2,191 m | 2.4 ha | 1 | 21 June | 26 June | – |
|---|
| Peleaga | 2,125 m | 2.3 ha | 4 | 16 May | 19 June | 30–83 m |
|---|
| Lacul Știrbu | 2,082 m | 1.4 ha | 1 | 27 May | 21 July | – |
|---|
| Lia | 1,903 m | 1.2 ha | 6 | 10 May | 1 July | 53–140 m |
|---|
| Peleguța | 2,096 m | 1.0 ha | 4 | 18 May | 19 June | 26–94 m |
|---|
| Judele | 2,132 m | 0.9 ha | 5 | 26 May | 22 June | 47–90 m |
|---|
| Tăurile Radeșului | 1,922 m | 0.9 ha | 1 | 11 May | 17 July | – |
|---|
| Viorica | 2,062 m | 0.9 ha | 5 | 26 May | 11 July | 40–121 m |
|---|
| Tău Răsucit | 2,095 m | 0.8 ha | 2 | 19 May | 19 July | 35–85 m |
|---|
| Lacul Adânc | 2,158 m | 0.8 ha | 0 | – | – | – |
|---|
| Stânișoara | 2,028 m | 0.8 ha | 2 | 16 May | 7 June | 50–122 m |
|---|
| Unnamed lake | 1,825 m | 0.8 ha | 0 | – | – | – |
|---|
| Lacul Mare din Valea Rea | 2,188 m | 0.7 ha | 3 | 23 May | 17 July | 42–101 m |
|---|
| Tăul Custura Mică | 2,175 m | 0.7 ha | 0 | – | – | – |
|---|
| Florica | 2,081 m | 0.5 ha | 0 | – | – | 47–106 m |
|---|
| Ștevia | 2,055 m | 0.5 ha | 5 | 18 June | 6 July | – |
|---|
| Tău Urât | 2,087 m | 0.5 ha | 3 | 21 May | 20 June | 35–126 m |
|---|
| Tăul Porții | 2,208 m | 0.5 ha | 4 | 26 May | 17 July | 36–62 m |
|---|
| Unnamed lake | 1,878 m | 0.4 ha | 0 | – | – | 44–126 m |
|---|
| Caprelor | 2,129 m | 0.4 ha | 0 | – | – | – |
|---|
A dash in the last column marks a lake that lies outside the outline used here, which draws no ice over it. A dash in a date column means no spring with a clear frozen-then-open pair.
Why the dates are intervals
Sentinel-2 can see Retezat every few days, though the interval varies. Mountain cloud and cirque shadow leave a lake usable on about one pass in five (19.7%, from 2018 to 2026; from 12% in 2019 to 29% in 2021). The plan was to give a day for the ice-out of at least ten lakes in seven or more springs, within three days. It did not hold: of 252 lake-springs, 90 have a clear frozen pass followed by a clear open pass, none of those pairs are less than three days apart, and only two lakes have seven or more.
So each spring on the card is the interval between the last pass that saw the lake frozen and the first that saw it open. The ice left somewhere inside it, and for a typical pair that is a month. A lake counts as frozen when at least half of its pixels are bright (green reflectance above 0.15), and as open when almost none are and the near-infrared reflectance is below 0.02; dark ice, which looks like water in visible light, would otherwise be counted as open. 2017 is left out: the archive has only six scenes, from 11 June.
Two kinds of ice
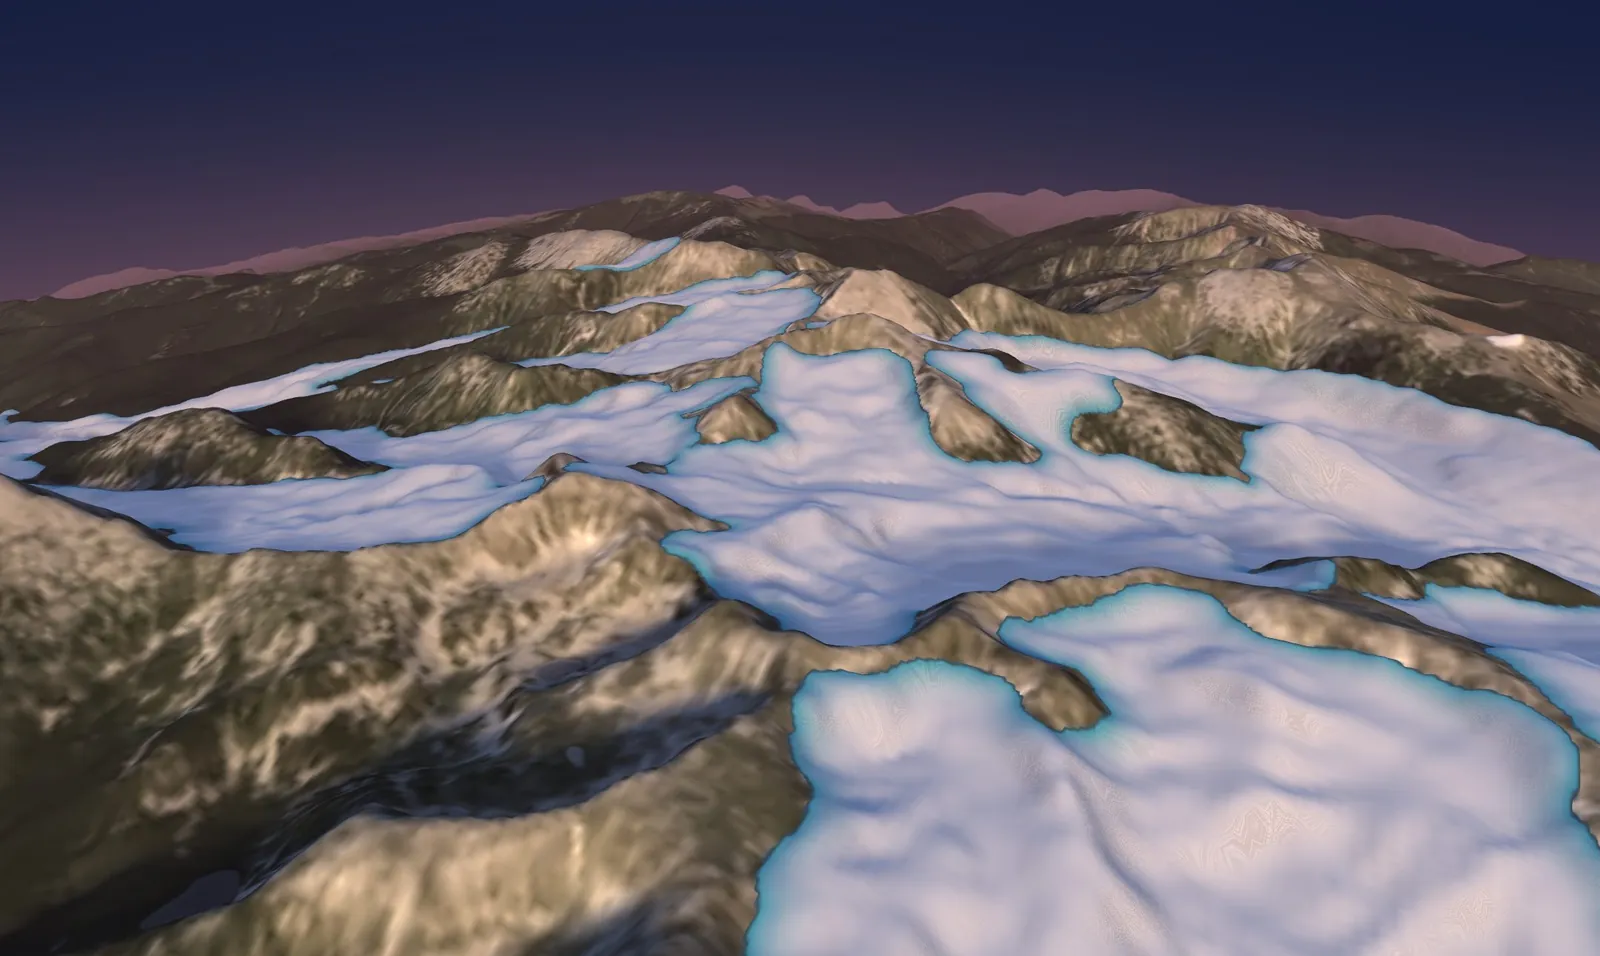
The ice that filled the valleys 20,600 years ago was glacier ice, moving slowly downhill, estimated at up to roughly 100–180 m at its thickest. The ice the satellite watches is the layer that forms on a lake each winter and melts each spring. The glaciers are long gone from Retezat; the lakes freeze on their own.
How far to trust the ice drawn here
The outline is published and dated: 78.4 km² of ice, with the southern maximum at 20.6 thousand years (+0.8, −1.3). Two older outlines for the same mountains differ a lot: one covers 65.6 km² of the Pietrele valley, another 324 km² across the whole massif. The thickness is an estimate: ice yield stress of 50, 100 or 150 kPa, the surface slope smoothed over about 300 m, and a margin that thins like a plastic glacier. It gives at most 102, 148 or 182 m inside the outline; the research group’s own conference poster mentions about 330 m, well above these figures. The terrain is a surface model, so the lakes are drawn level at their shore height, and their depth is not in the thickness. Ground colours and snow tones are an illustration.
Sources and method
Sources
- Ruszkiczay-Rüdiger, Z., Kern, Z., Urdea, P., Madarász, B., Braucher, R. (2021). Limited glacial erosion during the last glaciation in mid-latitude cirques (Retezat Mts, Southern Carpathians, Romania). Geomorphology 384: 107719. Maximum ice extent, 10Be exposure ages (southern valleys 20.6 +0.8/−1.3 ka). link
- Lima, A. C. et al. GLACIMONTIS: global compilation of empirically reconstructed mountain palaeoglaciers (Zenodo, CC BY 4.0). The outline drawn here is its digitisation of Ruszkiczay-Rüdiger et al. (2021): 78.4 km², three polygons. The compilation also holds Urdea et al. (2011, 324 km²) and Reuther et al. (2007, 65.6 km²) for the same mountains. link
- Copernicus DEM GLO-30 (ESA, 30 m), the relief: a surface model, so forest canopy is included and the lakes are drawn level. Contains modified Copernicus data. link
- Copernicus Sentinel-2 L2A, scene S2A_34TFR_20240813 (true colour) as the ground photograph; 413 scenes from 15 April to 1 August of 2018–2026 for the ice series (Earth Search COG archive). Contains modified Copernicus Sentinel data. link
- OpenStreetMap contributors (ODbL): outlines and names of the water bodies, peaks and altitudes of the labels; 82 water bodies in the scene, 44 of them inside the outline (three reservoirs excluded). link
- Madarász, B. et al. (EGU 2016) and Ruszkiczay-Rüdiger, Z. et al. (EGU 2017, EGU 2024), conference abstracts: glaciers reached about 1,040 m in the north and 1,130 m in the south; the 2024 poster lists a maximum thickness of about 330 m, not used here. link
- Palace of the Parliament, Bucharest: 84 m high (Wikipedia; Skyscraper Center). Some sources give 86 m. link