A · 439 places · 1,742,970 residents
Places with more children
The share of children is above the median across places, while employment and own-revenue shares are below it. Relatively few residents were born elsewhere.
Romania beyond counties · An atlas of similarities
Find your commune or town and discover three places in other counties with a similar profile. Compare residents’ ages, housing and employment, then see where they differ.
3,181 communes and towns · Census 2021 · budgets 2024 · agricultural land 2014. Groups depend on the chosen indicators. How we calculate them
Enter at least two letters. Accents are optional.
One dot = one commune or town. Colours show groups; area and population do not change dot size.
Local profile
Employment, own-revenue share and the proportion of residents born elsewhere exceed the medians across places. Proximity to a large city brings municipalities and communes into this group alike.
Search for a place to see its profile and comparisons.
Similarity uses all ten indicators. Two values are shown side by side for an initial comparison; kilometres show how far apart the places are on the map.
Bars show rank among places (0–100). The marker indicates the middle rank. Values and dates are written separately.
How this map divides
Each group gathers places with similar profiles. Names describe median traits; individual places may differ. A profile near each centre shows what the group means in numbers.
The share of children is above the median across places, while employment and own-revenue shares are below it. Relatively few residents were born elsewhere.
Employment, own-revenue share and the proportion of residents born elsewhere exceed the medians across places. Proximity to a large city brings municipalities and communes into this group alike.
The share of residents born elsewhere is below the national median across UATs. Agricultural land takes up less of the area than in the median locality, and large cities are farther away.
Manufacturing accounts for an above-median share of residents’ employment. Agricultural land and own revenues also have above-median shares; the group includes both towns and communes.
Agricultural land has an above-median share, while distance to a large city is below the median. The share of residents aged 65 and over is above the median even in this urban proximity.
Manufacturing and unoccupied dwellings both have above-median shares. This statistical snapshot shows the association; it does not establish that industry caused homes to become unoccupied.
Residents aged 65 and over and unoccupied dwellings have above-median shares. Own revenues are below the median share, and housing is concentrated in buildings with few dwellings.
Agricultural land share and distance from large cities exceed the medians across places. The share of older residents is above the median and employment is below it.
Small bars follow the ten indicators in the profile and show the group’s median rank among localities.
Beyond the dots
Documentary photographs with visible dates and sources. They show real places; similarities between localities are calculated from statistical tables.
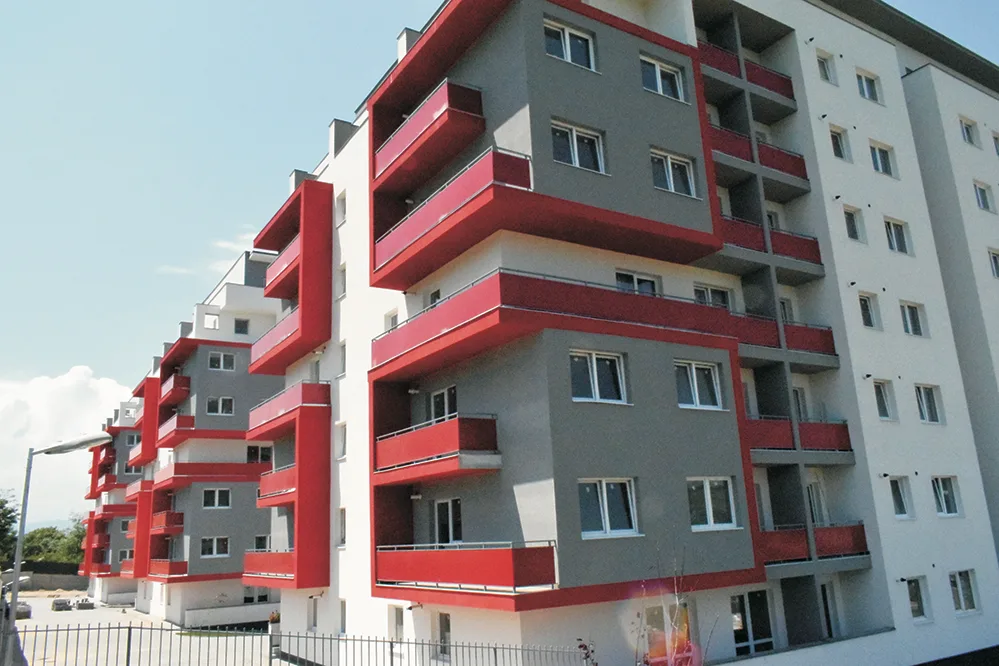
Apartment blocks tell us something about housing form. The census enables a more precise comparison: dwellings per building, occupancy and residents’ ages. Florești can be compared with a town even though its administrative status is a commune.

This photograph shows Copșa Mică’s industrial site in 2010. The atlas measures residents working in manufacturing at the 2021 census. The photograph and the indicator describe different things at different dates.
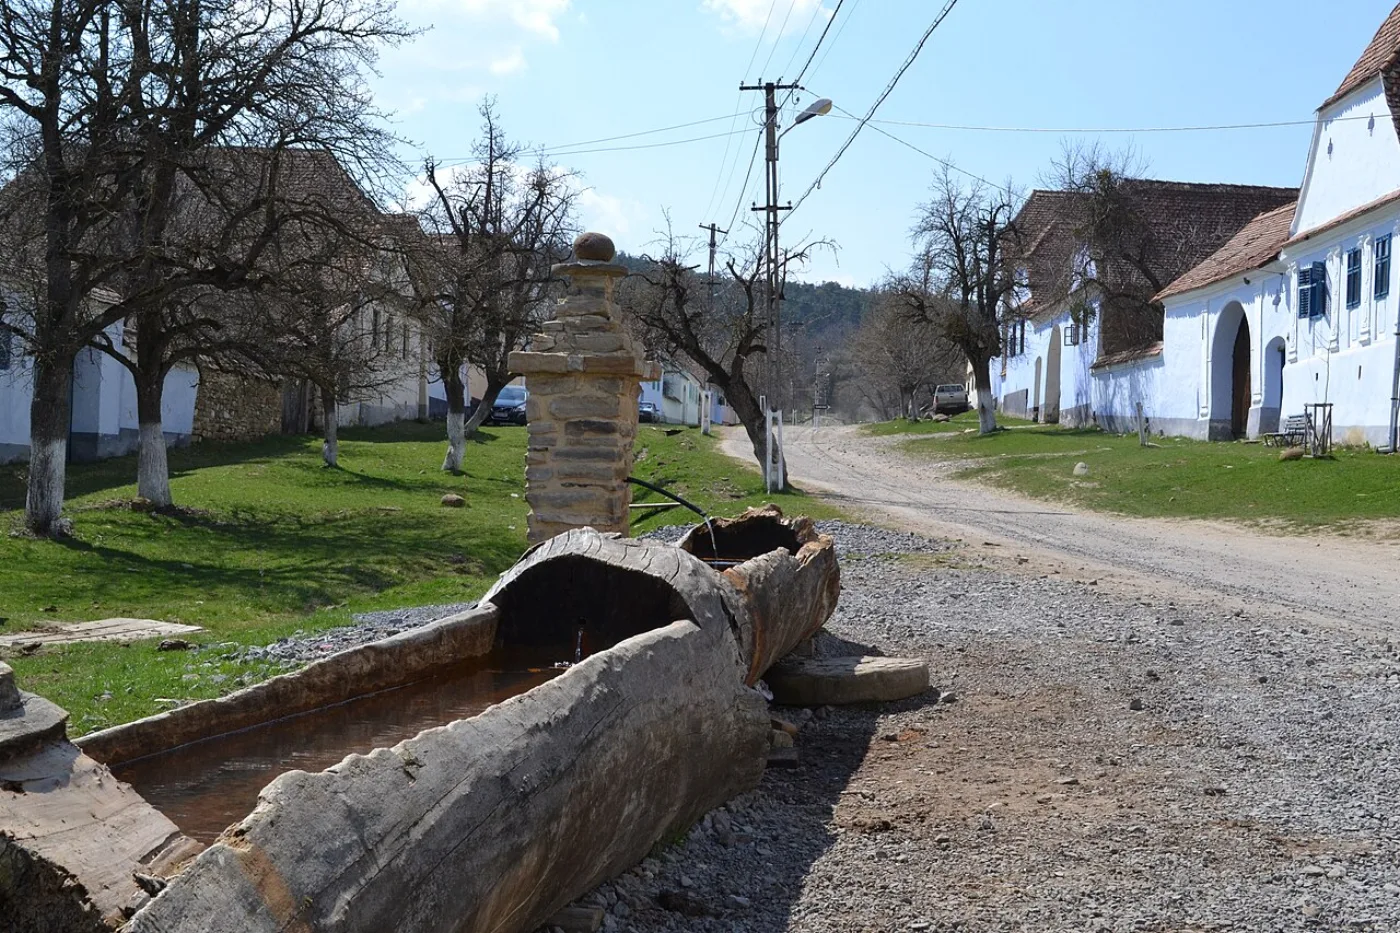
Viscri belongs to Bunești commune, Brașov county. Search opens the profile of the entire commune, which also includes other villages. Commune-level values do not separately describe each village or household.
How to read the result
This grouping compares measured local conditions. Other indicators, weights or reference years can produce a different map.
Each dot is a commune, town or municipality. Bucharest is one unit. The 3,181 units contain 19,053,815 residents on 1 December 2021. SIRUTA codes join the tables; counties identify places and filter cross-county comparisons, but are excluded from the clustering.
Age, housing, birthplace, employment, proximity to a large city, agricultural land and budget revenues have equal total weights. The ten indicators are converted to ranks among places so an extreme value cannot dominate the comparison. A dimension with two indicators divides its weight between them. Every place counts equally, regardless of population.
We compare 8 to 15 groups using k-means, which seeks centres close to the local profiles. The 8-group version has the best separation score within this range: 0.129. Separation is modest; profiles overlap. Group names describe their medians and are editorial choices.
838 places are almost equally close to their two nearest centres: the first has less than a 10% distance advantage over the second. Their profile says “borderline”. Changing the indicators can change groups. No label measures a community’s worth, every resident’s prosperity or their prospects.
Geographical distance is a straight line between geometric centres of the 2025 UAT polygons. Reference cities have at least 50,000 residents in 2021. This proximity does not measure travel time or access to services. The three comparisons are the closest weighted ten-indicator profiles among places in other counties; they may belong to another group.
Birthplace describes a lifetime difference from residence in 2021; this is not a recent migration flow. Unoccupied dwellings encompass different situations and do not automatically mean abandonment. Employment concerns residents aged at least 15 and does not count jobs located in the locality. Own revenues include income-tax shares; their proportion is not a pure measure of dependence on transfers. Agricultural land remains at 2014 in the INS series.
In 15 places, at least one comparison indicator is unavailable. We fill it with the national median across places for calculation only; the profile still says “unavailable”. Bucharest’s municipal budget excludes sector budgets, so its budget share is omitted. Negative net EU receipts produce ratios above 100% in Negru Vodă and Pielești; we retain the original amounts in the documentation and omit this indicator from their profiles.
Repeating the calculation with three different initialisations gives agreement of 0.526–0.956 on the adjusted Rand index, where 1 means identical groupings. Removing one dimension at a time changes the result further. Read the proposed peers alongside their values; the country has no unique partition in these data.
Analysis prepared on 8 September 2026. Photographs retain the licences stated in their captions.


.jpg)