Sources and notes
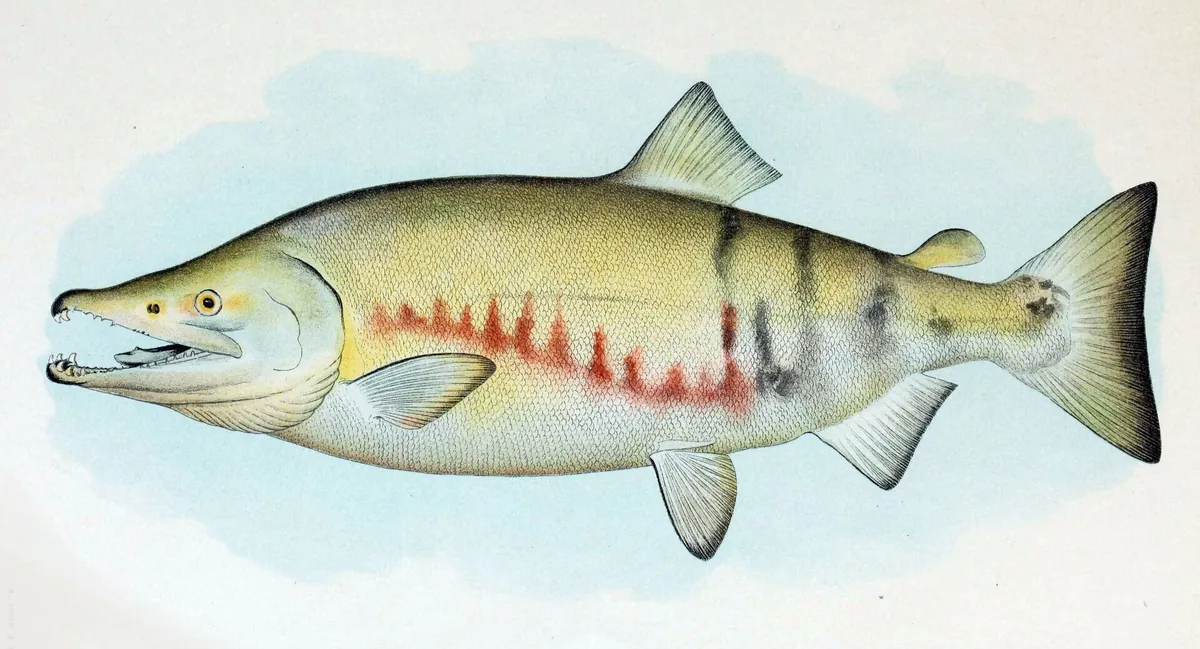
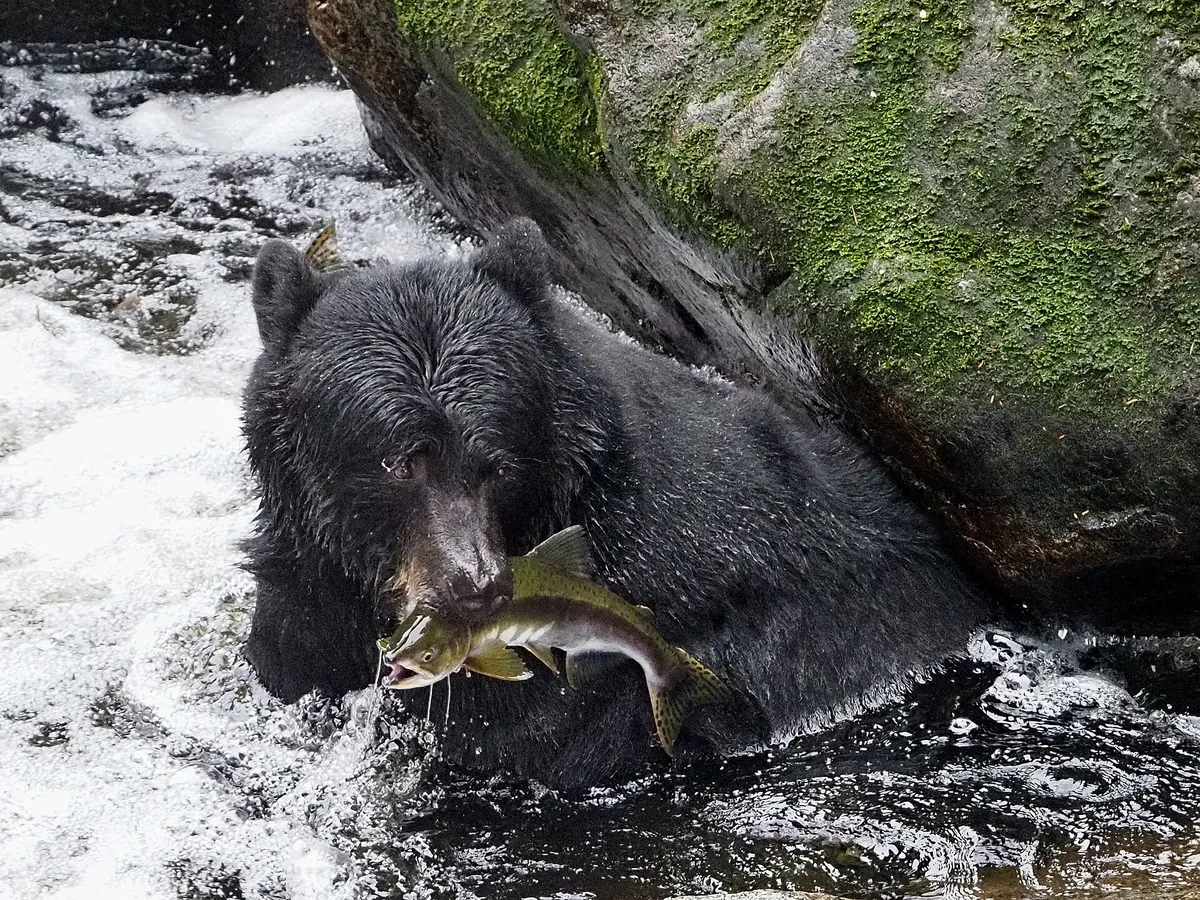
What is measured and what is drawn. The fish is not one tagged animal. His life is put together from what is recorded about chum salmon in general and about Bag Harbour in particular; the numbers at each step are the ones in the papers below. The sea, the stream, the bear and the spruce are drawings. The gold dots are a way of showing nitrogen from the sea, not a measurement: nobody has followed single atoms. Their number means something only on the twig, where the gold needles are 24 in 100.
Where the numbers come from other places. The 24 per cent, and the 100 metres, were measured on Chichagof Island in south-east Alaska, on streams used mostly by pink salmon, not at Bag Harbour. The depth of the eggs is from a creek in Washington. The evidence for a magnetic memory is from sockeye and pink salmon. The roughly 100 grams of nitrogen in one fish is my arithmetic: 2.96 kilograms at 3.3 per cent.
How firm it is. That nitrogen from salmon is in the plants beside salmon streams is well established and has been found many times. Percentages such as 24 per cent rest on a calculation with two sources, sea and land, and soil microbes can shift the heavy form of nitrogen on their own, so they are estimates. Whether the fish make the trees grow faster was argued over: a 2001 claim that growth more than tripled was criticised because the sites differed in soil and in other ways, and its authors agreed the finding was an inference. The coast-wide ring study used here compares trees a short distance apart on the same streams. From one year to the next, in the paper’s own words, the size of the salmon run was “positively but weakly” tied to growth.
Numbers that differ within a source. Reimchen (2000) gives the bears’ take in one autumn as 74 per cent in its summary and as 67.7 to 75 per cent in its results; the page uses the summary. In 1992, unlike 1993, he saw no blowfly eggs on the carcasses at all.
- Reimchen, T. E. (2000). “Some ecological and evolutionary aspects of bear–salmon interactions in coastal British Columbia.” Canadian Journal of Zoology 78, 448–457. The run at Bag Harbour, its dates and size, the bears, what they eat of each fish, how many they take, the 1947 count.
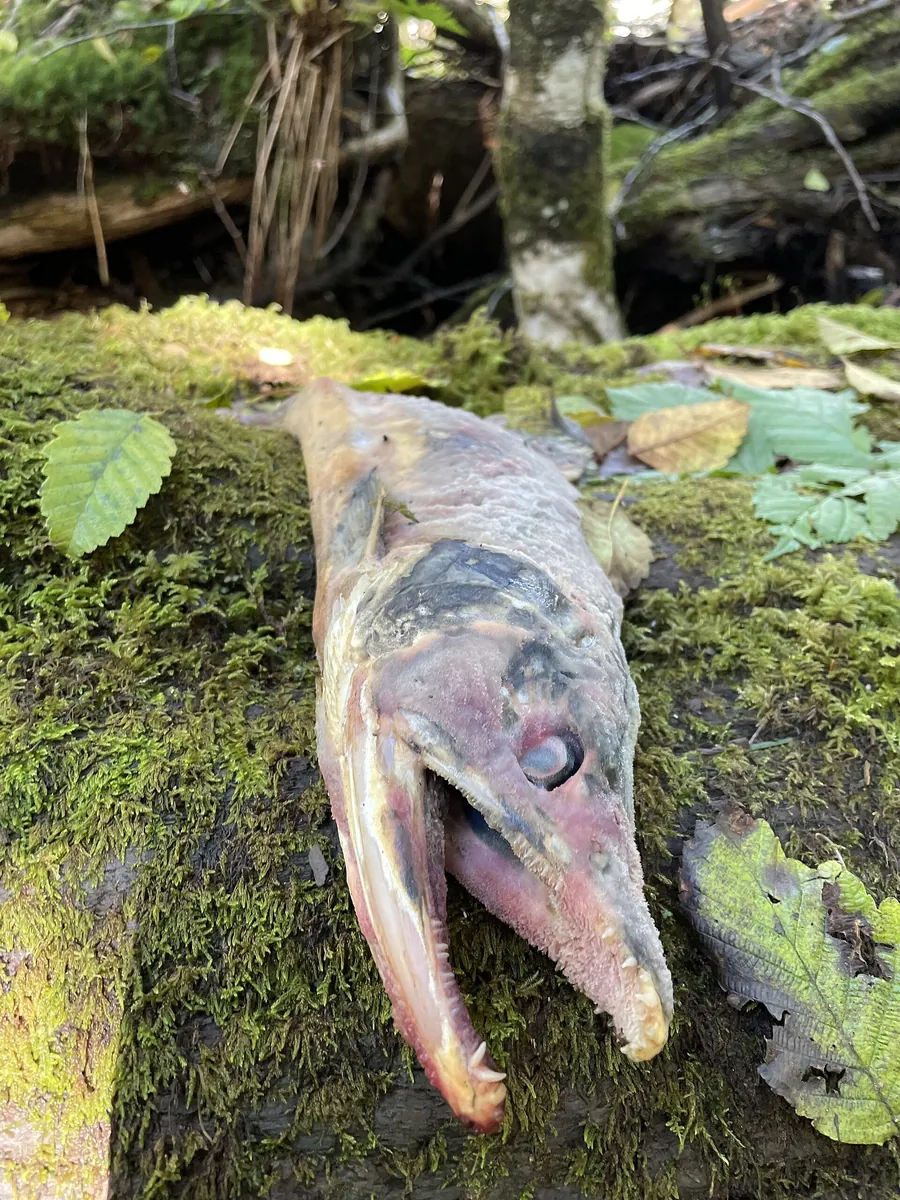
- Reimchen, T. E. (2017). “Diverse ecological pathways of salmon nutrients through an intact marine-terrestrial interface.” Canadian Field-Naturalist 131, 350–368. The stream, the 3,700 salmon carried into the forest in 1993 and how far, the flies, the other scavengers, the nitrogen totals.
- Reimchen, T. E. & Fox, C. H. (2013). “Fine-scale spatiotemporal influences of salmon on growth and nitrogen signatures of Sitka spruce tree rings.” BMC Ecology 13:38. The ages of the spruces and the ring-by-ring record, 1947–2000.
- Reimchen, T. E. (2024). “The carcass zone: salmon contribution to tree rings in old-growth Sitka Spruce (Picea sitchensis) throughout coastal British Columbia.” Canadian Field-Naturalist 138, 145–162. The coast-wide comparison of growth: 282 trees on 79 streams.
- Reimchen, T. E., Mathewson, D., Hocking, M. D., Moran, J. & Harris, D. (2003). “Isotopic evidence for enrichment of salmon-derived nutrients in vegetation, soil, and insects in riparian zones in coastal British Columbia.” American Fisheries Society Symposium 34, 59–69. Nitrogen in wood. Mathewson, D. D., Hocking, M. D. & Reimchen, T. E. (2003). “Nitrogen uptake in riparian plant communities across a sharp ecological boundary of salmon density.” BMC Ecology 3:4. Above and below the waterfalls.
- Helfield, J. M. & Naiman, R. J. (2001). “Effects of salmon-derived nitrogen on riparian forest growth and implications for stream productivity.” Ecology 82, 2403–2409. The share of needle nitrogen that came from salmon, and the 100 metres. With the comment by M. D. Kirchhoff and the authors’ reply, Ecology 84 (2003), 3396–3401.
- Gende, S. M., Edwards, R. T., Willson, M. F. & Wipfli, M. S. (2002). “Pacific salmon in aquatic and terrestrial ecosystems.” BioScience 52, 917–928. The share of the body built at sea; the limits of the nitrogen tracer.
- Chum salmon life history: Johnson, O. W. et al. (1997), Status review of chum salmon from Washington, Oregon, and California, NOAA Technical Memorandum NMFS-NWFSC-32 (age at return, the move to the coast, eggs per female); the species profile of the Alaska Department of Fish and Game (fry going to sea, fasting, breeding colours, guarding the nest, hatching); NOAA Fisheries (all die after spawning); Urawa, S. et al. (2009), North Pacific Anadromous Fish Commission Bulletin 5, 131–146 (where they go at sea); Montgomery, D. R. et al. (1996), Canadian Journal of Fisheries and Aquatic Sciences 53, 1061–1070 (depth of the eggs, Kennedy Creek, Washington); Bakkala, R. G. (1970), Synopsis of biological data on the chum salmon, FAO/US Fish and Wildlife Service Circular 315 (survival from egg to fry).
- Finding the way: Dittman, A. H. & Quinn, T. P. (1996). “Homing in Pacific salmon: mechanisms and ecological basis.” Journal of Experimental Biology 199, 83–91. Lohmann, K. J. et al. (2022). “Magnetic maps in animal navigation.” Journal of Comparative Physiology A 208, 41–67.