Daily snow maps · 21 resorts · 22 winters
Snow days at Romania’s ski resorts, winter by winter since 2004
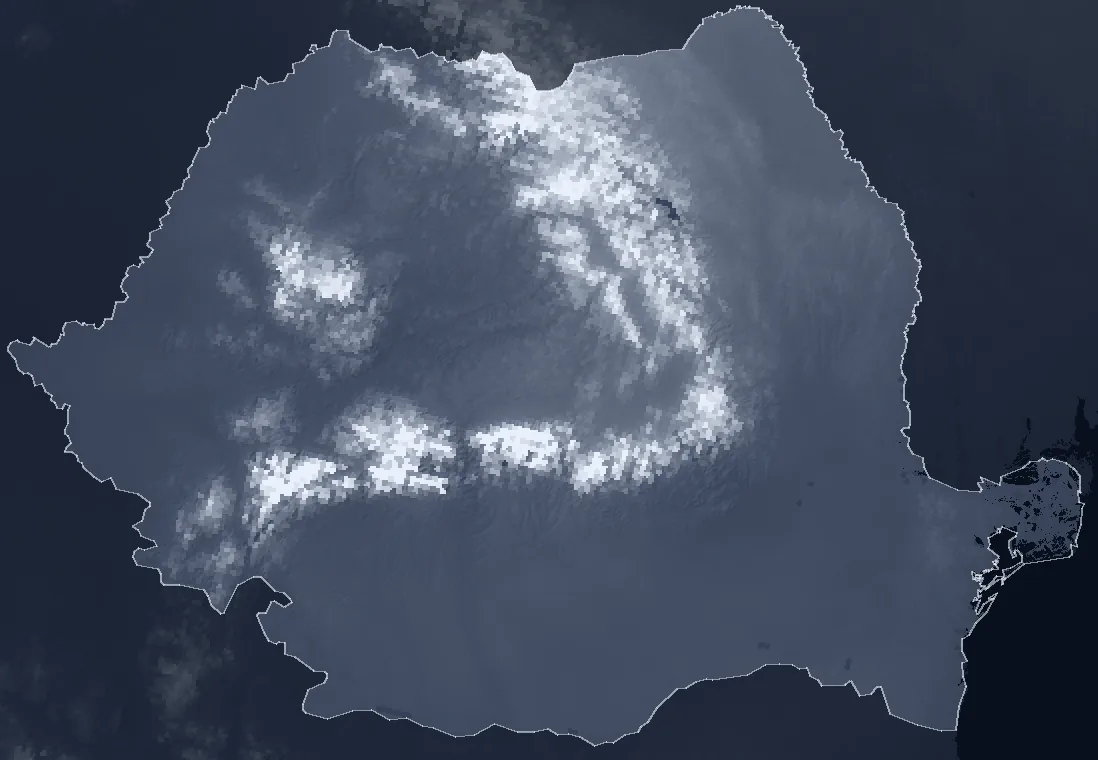
NOAA’s daily snow maps show, for every day since 2004, where Romania was white. At resort height, one winter can have more than twice as many snow days as another: at Poiana Brașov the map showed snow on the runs on 48 days one winter and 119 another, between December and March. Over ten years, the average at 900–1,500 m fell only a little, from 86 to 80 days, but the last four winters all rank among the poorest seven of 22. Lower down, the snow has clearly thinned: below 600 m, the last ten winters had 40% fewer snow days than the first ten, and the weather stations at Sibiu, Bucharest and Cluj measure the same fall.
Choose a resort on the map or from the list. Its calendar shows every day from October to May, in every winter from 2004–05 to the one starting now. A day is white when the cells the satellite map marks as snow-covered hold at least half the length of its runs.
#Where the snow went: by height
The map has one cell every 4 km. Every point in Romania is grouped by height, and for each group the days between 1 December and 31 March on which the map showed snow were counted, winter by winter. The chart compares the average of the first ten winters (2004–05 to 2013–14) with the average of the last ten (2016–17 to 2025–26).
The loss shrinks with height. Below 300 m, a winter now has 23 days of snow instead of 40 (−41%); at 600–900 m, 52 instead of 67 (−23%); at 1,200–1,500 m, 92 instead of 94 (−3%). Above 1,500 m, the two decade averages barely differ.
In the lowlands, the weather stations measure the same thing with a snow stake, not from space. At Sibiu, days with snow on the ground between December and March fell from 45 to 20 (−56%), at Bucharest-Băneasa from 35 to 18 (−49%), at Cluj-Napoca from 47 to 30 (−37%). Across the nine lowland and hill stations with data in both decades, the fall is between 24% and 56%. On Vârful Omu, at 2,504 m, snow still lies almost all winter.
| Station | Height | 2004–2014 | 2016–2026 | Change |
|---|---|---|---|---|
| Constanța | 13 m | 14.9 | 9.9 | −34% |
| Galați | 71 m | 37.0 | 20.4 | −45% |
| Bucharest-Băneasa | 90 m | 35.1 | 17.9 | −49% |
| Buzău | 97 m | 28.6 | 12.7 | −56% |
| Iași | 102 m | 51.8 | 39.6 | −24% |
| Craiova | 192 m | 36.2 | 22.8 | −37% |
| Caransebeș | 241 m | 33.1 | 15.3 | −54% |
| Cluj-Napoca | 410 m | 47.0 | 29.8 | −37% |
| Sibiu | 444 m | 45.2 | 20.0 | −56% |
| Vârful Omu | 2,504 m | 116.6 | 115.8 | −1% |
For the resorts, this mostly means the foot of the mountain: the road to the lifts, the villages and towns at the base, the runs that end below 1,000 m. Higher up, an average winter has almost as many white days as 20 years ago.
#The last four winters, among the poorest
A ten-year average hides what skiers have lived through recently. At 900–1,500 m, winter 2023–24 was the poorest of the 22, with 51 days of snow out of 121. Winters 2022–23, 2024–25 and 2025–26 were also among the poorest: all four rank among the poorest seven.
It is not the first run of bad winters. Winters 2006–07 and 2013–14 were as poor at these heights. The difference is that four came in a row this time, after several snowy winters between 2016 and 2021. The 1 km map, which exists only from 2014, puts them in the same order.
The winter starting now
The top row of the calendar is winter 2026–27. The data run to 29 October 2026: so far snow has shown up only high up, at Bâlea Lac.
#Every resort, winter by winter
The table counts the days between 1 December and 31 March when the cells the satellite map marked as snow-covered held at least half the length of the runs. The runs are those mapped in OpenStreetMap; heights come from the Copernicus terrain model.
For some resorts, the comparison with the first decade is uncertain. For most of them, the 4 km cell takes in much ground lower or higher than the runs, and the 1 km and 4 km maps differ by 12–40 days a winter on average. At Bușteni (Kalinderu), Rânca, Băișoara (Buscat), the test against ERA5-Land shows a jump of more than ten days at the map change. For these resorts, the table gives only the 1 km average since 2014.
| Resort | Runs | 4 km cell | 2004–2014 | 2016–2026 | 2025–26 | 1 km map, since 2014 |
|---|---|---|---|---|---|---|
| Arieșeni (Vârtop) | 1,149–1,441 m | 1,195 m | comparison uncertain | 62* | 89 | |
| Azuga | 974–1,529 m | 1,417 m | 91 | 84 | 72 | 89 |
| Borșa | 862–1,626 m | 1,093 m | comparison uncertain | 67* | 80 | |
| Bușteni (Kalinderu) | 969–1,254 m | 1,781 m | comparison uncertain | 69* | 73 | |
| Bâlea Lac | lake, 2,033 m | 1,906 m | 118 | 120 | 119 | 120 |
| Băișoara (Buscat) | 1,254–1,671 m | 1,482 m | comparison uncertain | 87* | 114 | |
| Cavnic | 940–1,064 m | 1,062 m | 87 | 86 | 51 | 89 |
| Durău | 801–858 m | 1,329 m | comparison uncertain | 62* | 74 | |
| Muntele Mic | 1,416–1,793 m | 1,432 m | comparison uncertain | 117* | 117 | |
| Parâng | 1,081–1,942 m | 1,245 m | comparison uncertain | 113* | 106 | |
| Poiana Brașov | 974–1,788 m | 1,316 m | 93 | 84 | 70 | 89 |
| Predeal (Clăbucet) | 1,036–1,448 m | 1,162 m | 96 | 91 | 78 | 87 |
| Păltiniș (Arena Platoș) | 1,293–1,668 m | 1,344 m | comparison uncertain | 68* | 86 | |
| Rânca | 1,539–1,702 m | 1,489 m | comparison uncertain | 96* | 108 | |
| Semenic | 641–1,427 m | 1,235 m | comparison uncertain | 53* | 63 | |
| Sinaia | 1,029–2,088 m | 1,886 m | 108 | 115 | 113 | 119 |
| Straja | 1,089–1,864 m | 1,391 m | comparison uncertain | 91* | 96 | |
| Transalpina Ski (Vidra) | 1,320–1,973 m | 1,724 m | comparison uncertain | 114* | 116 | |
| Vatra Dornei | 815–1,257 m | 938 m | 82 | 77 | 64 | 79 |
| Șuior | 692–1,232 m | 775 m | comparison uncertain | 47* | 59 | |
| Șureanu | 1,684–1,970 m | 1,786 m | comparison uncertain | 118* | 119 | |
* For resorts where the comparison is not safe, the 2025–26 number comes from the 1 km map.
#How reliable the numbers are
NOAA’s map is not a photograph. Analysts at the US National Ice Center draw it every day from satellite images, microwave readings and weather-station reports. Under cloud, analysts usually keep the earlier classification, corrected with microwave data and ground observations where available. Each cell is marked whole, snow or no snow, so a strip of snow on a narrow run may not show, and a snow-free valley can show white if the slopes around it are white. The map does not tell natural snow from machine-made snow, and a white day on the map is not necessarily a good day for skiing.
In December 2014 the map moved to its third version, with new sources and a 1 km edition. If that move had changed how snow is drawn, the decade comparison would be false. Two checks show that the move does not explain the lowland decline. At the nine lowland stations, the gap between white days on the map and measured snow days moved by 1.8 days a winter on average after 2014, and by between −11 and +5 days at individual stations. Against the ERA5-Land reanalysis, whose method did not change, the gap moved by 2.3 days on average across 48 points, but by between −24 and +19 days at individual points. So at a single resort the effect of the map change cannot be ruled out, which is why some resorts get no decade comparison.
At the weather stations next to the runs, agreement between the map and the snow stake varies from station to station. At Semenic and Fundata the map rises and falls almost in step with the station from one winter to the next; at Sinaia 1500, hardly at all. At some stations the map shows fewer white days than the station on average, at others more: a station measures one point, while the map judges a whole square of ground, with forests and sunny slopes. Snow-depth records start in 2012 at some of these stations and only in November 2014 at others, so they cannot check the first decade.
| Station | Height | Snow days at the station | On the 1 km map |
|---|---|---|---|
| Poiana Stampei | 920 m | 79 | 86 |
| Predeal | 1,093 m | 99 | 81 |
| Băișoara | 1,356 m | 99 | 102 |
| Fundata | 1,383 m | 106 | 91 |
| Semenic | 1,433 m | 111 | 84 |
| Cuntu | 1,450 m | 107 | 113 |
| Păltiniș | 1,454 m | 107 | 96 |
| Sinaia 1500 | 1,510 m | 106 | 111 |
| Parâng | 1,550 m | 108 | 95 |
Averages per winter, December–March, 2014–15 to 2024–25. Stations send snow depth once a day. When a day’s report lacks snow depth but the reports around it (up to three before and three after) show snow, the day was counted as snowy; several days in a row can be filled this way.
#Method
The source is the IMS daily snow and ice map of the US National Ice Center (NSIDC G02156), its 4 km edition (from February 2004) and its 1 km edition (from December 2014). Every day from October to May was read, from October 2004 to 25 October 2026: 5,363 maps at 4 km and 2,878 at 1 km. Thirteen days are missing from the 4 km series and three from the 1 km series, the same ones NSIDC lists as missing. Each file represents the snow estimated for 00:00 UTC on the date in its name, from observations gathered beforehand.
A resort means its alpine ski runs in OpenStreetMap. For each map cell, the length of run passing through it was measured; a day counts as “snowy” when cells marked as snow-covered hold at least half the length of the runs. Bâlea Lac has no mapped runs and is a single point at the lake. Durău and Cavnic have few mapped runs.
Comparisons use the days between 1 December and 31 March. Each count is scaled to a 121-day window, in leap years (122 days) and when maps are missing; the first winter on the 1 km map starts on 3 December 2014. The first decade means winters 2004–05 to 2013–14, all on the map’s second version; the last, winters 2016–17 to 2025–26, all on its third. Winters 2014–15 and 2015–16 are in the calendar but not in the comparison. A resort gets the decade comparison only if its 4 km and 1 km maps differ by at most ten days a winter on average (2015–16 to 2025–26) and its gap to ERA5-Land moved by at most ten days at the map change.
Heights come from the Copernicus GLO-30 terrain model. At weather stations, a snow day means at least 1 cm of snow on the ground. At GHCN-Daily stations, snow depth appears only on snowy days; a day on which the station sent other measurements (precipitation, temperature) but no snow depth was counted as snow-free. The Obârșia Lotrului station never reports snow depth and was not used.
#Sources
- U.S. National Ice Center (2008, updated daily). IMS Daily Northern Hemisphere Snow and Ice Analysis at 1 km, 4 km, and 24 km Resolutions (G02156, Version 1). NSIDC, Boulder, Colorado. Daily 4 km ASCII files (October 2004 – October 2026) and 1 km files (December 2014 – October 2026), October–May, cropped to Romania; accessed 26 October 2026
- NSIDC, G02156 user guide: version history (version 3 of the map from December 2014) and the date each file is valid for
- OpenStreetMap, alpine ski runs (piste:type=downhill), extracted with Overpass; © OpenStreetMap contributors, ODbL
- Copernicus DEM GLO-30 (European Space Agency), heights of runs and cells; © DLR e.V. 2010–2014 and © Airbus Defence and Space GmbH 2014–2018, provided under the Copernicus programme
- NOAA NCEI, Integrated Surface Database: SYNOP reports from Predeal, Sinaia 1500, Parâng, Semenic, Păltiniș, Băișoara, Bâlea Lac, Cuntu, Poiana Stampei, Iezer, Fundata, Ceahlău Toaca and Vârful Omu (snow depth)
- NOAA NCEI, GHCN-Daily: daily snow depth at Buzău, Cluj-Napoca, Bucharest-Băneasa, Caransebeș, Constanța, Craiova, Galați, Iași, Sibiu and Vârful Omu
- ERA5-Land (Copernicus Climate Change Service, ECMWF), daily maximum snow depth, through the Open-Meteo archive; used only as a reference for the map-change test
- geoBoundaries, outline of Romania (ADM0), CC BY 4.0