Seismic hazard · the official table of 11 September 2026
Type your town. See where it stands in an earthquake.
In September 2026 Romania published an official seismic-hazard value for each of its 3,181 localities. Look yours up, see how many localities have a higher value and compare it with another.
Find a locality
The value in the table says how hard the ground shakes in a locality, in the design earthquake. It is measured in g, that is, relative to the acceleration of an object in free fall: at 0.37 g, Bucharest's value, the ground jolts with more than a third of it. On the USGS instrumental scale, 0.10 g is "moderate" shaking, 0.37 g "very strong", and 0.50 g, the table's maximum, "severe". The value describes the ground in the locality. How a particular building holds up depends on the building.
Or try: · · · · ·
Compare with another locality
The full list, all 3,181 localities by county, is in the text edition of this page.
How the 3,181 localities divide
The table uses only 41 values, from 0.10 g to 0.50 g. 430 localities have the minimum value of 0.10 g: 421 in Transylvania, Crișana, Banat and Maramureș, 9 in Suceava county. 126 have the maximum value of 0.50 g: 59 in Buzău county, 55 in Vrancea, 10 in Galați and 2 in Brăila, the Vrancea epicentral zone and the plain south and east of it. 1,080 localities, about a third of those in the table, have at least 0.30 g, the upper half of the scale.
Number of localities at each value in the table. The locality you searched is marked on the scale.
Counties, from the highest mean to the lowest
For each county: the lowest value, the highest value and the mean of its localities' values, in descending order of the mean. Bucharest is a single row in the official table, for all its sectors.
| County | Localities | Lowest | Highest | Mean |
|---|---|---|---|---|
| Vrancea | 73 | 0.42 g | 0.50 g | 0.49 g |
| Buzău | 87 | 0.41 g | 0.50 g | 0.49 g |
| Galați | 65 | 0.38 g | 0.50 g | 0.45 g |
| Prahova | 104 | 0.33 g | 0.49 g | 0.44 g |
| Brăila | 44 | 0.34 g | 0.50 g | 0.43 g |
| Ialomița | 66 | 0.28 g | 0.47 g | 0.40 g |
| Bacău | 93 | 0.25 g | 0.49 g | 0.40 g |
| Dâmbovița | 89 | 0.33 g | 0.44 g | 0.39 g |
| Ilfov | 40 | 0.34 g | 0.45 g | 0.38 g |
| București | 1 | 0.37 g | 0.37 g | 0.37 g |
| Călărași | 55 | 0.29 g | 0.41 g | 0.37 g |
| Vaslui | 86 | 0.29 g | 0.46 g | 0.36 g |
| Argeș | 102 | 0.26 g | 0.37 g | 0.32 g |
| Giurgiu | 54 | 0.26 g | 0.38 g | 0.32 g |
| Covasna | 45 | 0.22 g | 0.39 g | 0.30 g |
| Neamț | 83 | 0.17 g | 0.37 g | 0.29 g |
| Tulcea | 51 | 0.20 g | 0.38 g | 0.28 g |
| Brașov | 58 | 0.21 g | 0.35 g | 0.28 g |
| Iași | 98 | 0.22 g | 0.33 g | 0.27 g |
| Constanța | 70 | 0.22 g | 0.35 g | 0.26 g |
| Teleorman | 97 | 0.20 g | 0.34 g | 0.25 g |
| Vâlcea | 89 | 0.20 g | 0.30 g | 0.24 g |
| Olt | 112 | 0.20 g | 0.29 g | 0.23 g |
| Caraș-Severin | 77 | 0.14 g | 0.30 g | 0.22 g |
| Sibiu | 64 | 0.15 g | 0.25 g | 0.19 g |
| Timiș | 99 | 0.10 g | 0.25 g | 0.19 g |
| Botoșani | 78 | 0.15 g | 0.23 g | 0.19 g |
| Dolj | 111 | 0.15 g | 0.20 g | 0.18 g |
| Harghita | 67 | 0.11 g | 0.27 g | 0.18 g |
| Suceava | 114 | 0.10 g | 0.26 g | 0.18 g |
| Mehedinți | 66 | 0.15 g | 0.25 g | 0.17 g |
| Gorj | 70 | 0.15 g | 0.20 g | 0.17 g |
| Satu Mare | 65 | 0.11 g | 0.20 g | 0.17 g |
| Maramureș | 76 | 0.10 g | 0.20 g | 0.14 g |
| Arad | 78 | 0.10 g | 0.20 g | 0.14 g |
| Mureș | 102 | 0.10 g | 0.20 g | 0.13 g |
| Bihor | 101 | 0.10 g | 0.20 g | 0.13 g |
| Alba | 78 | 0.10 g | 0.16 g | 0.12 g |
| Cluj | 81 | 0.10 g | 0.14 g | 0.11 g |
| Sălaj | 61 | 0.10 g | 0.15 g | 0.11 g |
| Hunedoara | 69 | 0.10 g | 0.13 g | 0.10 g |
| Bistrița-Năsăud | 62 | 0.10 g | 0.10 g | 0.10 g |
What the value says, and what it does not
The value in the table is peak ground acceleration, written as a fraction of the acceleration of gravity, g. At 0.37 g, Bucharest's value, the ground moves, in the scenario earthquake, with an acceleration of 37% of free fall. The methodology attaches this value to scenario II: the probability that ground acceleration exceeds it is 10% in 50 years, and the mean interval between two exceedances is 475 years. The interval does not say when the next earthquake comes.
The value characterises the ground motion. The building is not in it: two apartment blocks in the same locality receive the same hazard value, and one may come through without a crack while the other fails, depending on the year it was built, its structure and its condition. The risk of a particular building is calculated separately, from hazard, exposure and vulnerability, and this table covers only the first term.
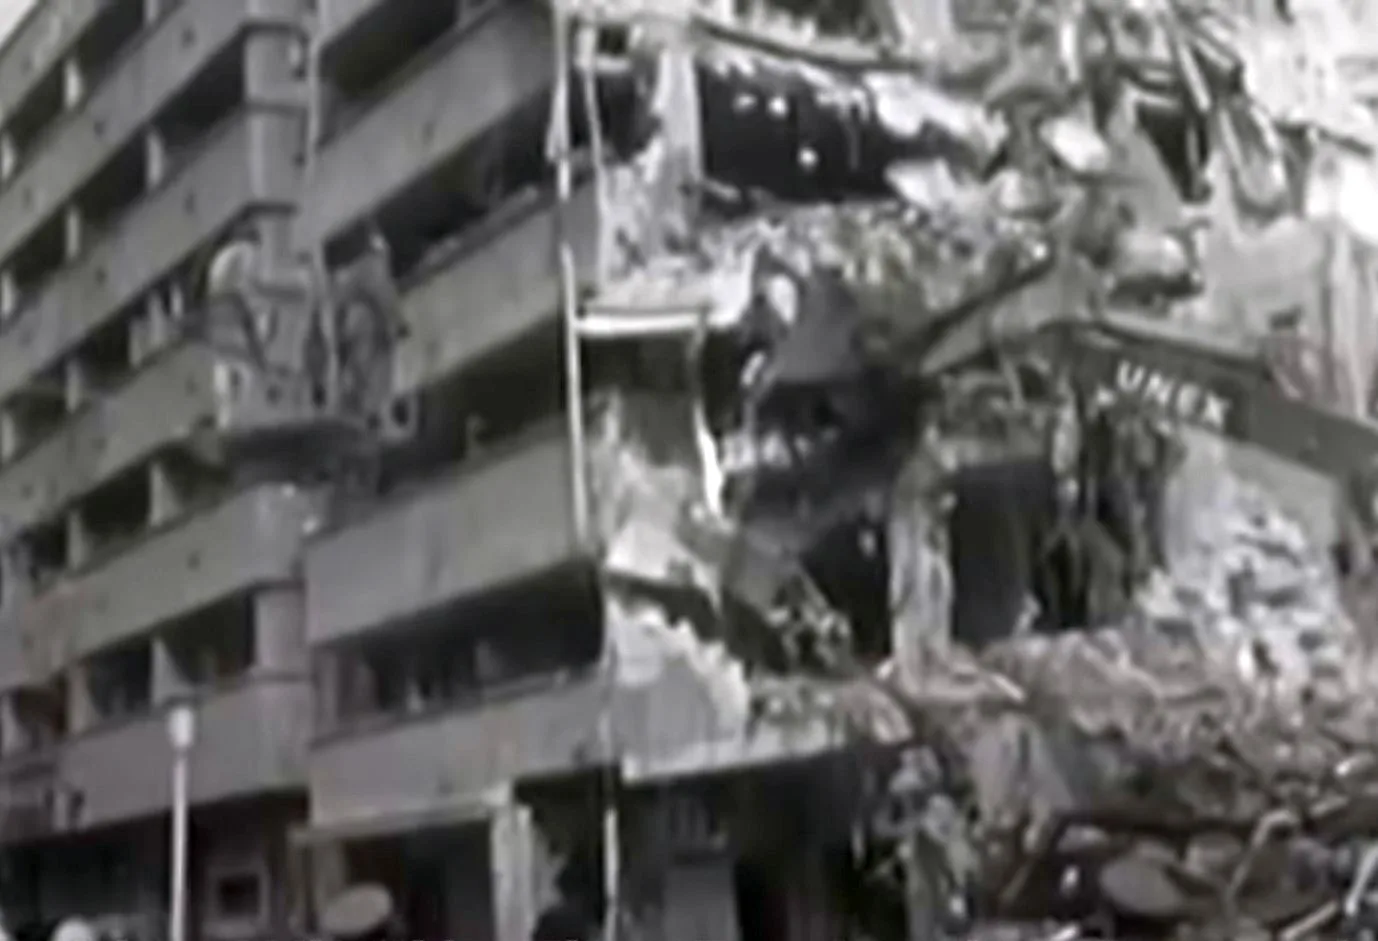
The value is not a forecast. The three scenario earthquakes are conventional design events, chosen so that localities can be compared with one another; the methodology says plainly that its results are relevant in relative terms, for comparison between administrative units. A real earthquake can produce, at a given spot, an acceleration above or below the value in the table.
Method
Table A.1 in Annex A of the RTC 18-2026 methodology has 3,181 rows: every commune, town and city, plus Bucharest as a single row. For each, the table gives three numbers: the PGA with a 10% probability of exceedance in 50 years (the value on this page), the hazard scaling factor FHS, used only to compute the fragility of buildings built between 1978 and 2006, and the slope of the hazard curve k, which is 2 for 1,014 localities and 3 for 2,167.
The values for scenarios I and III are not in the table. They are computed here with equations 2.5 and 2.6 of the methodology, from the scenario II value and the slope k:
PGA(I) = (225/475)^(1/k) × PGA(II) PGA(III) = (975/475)^(1/k) × PGA(II)
Check: for Iași, the methodology's Annex C works out 0.20 g and 0.33 g from 0.26 g and k = 3; the same calculation here gives the same numbers. For Bucharest, from 0.37 g and k = 3, it gives 0.29 g and 0.47 g. Results are rounded to two decimals, as in the source. One discrepancy: for Târgu Mureș, the methodology's example C.2 prints 0.22 g for scenario III, while the calculation gives 0.2149, rounded here to 0.21 g.
For the chosen locality, the page counts the localities with a higher, equal or lower value than its own. A plain rank would mislead: the table has only 41 distinct values, and 126 localities share first place. Names are kept as in the source, with two exceptions: capitalised particles ("Ștefan Cel Mare") were given their standard spelling, and three names with commas in place of full stops ("C,A, Rosetti") were corrected. The county appears as "Satu Mare", its official form. 256 names recur in different counties, which is why every result also shows the county.
The seismic map the ministry publishes shows the design zoning of the P100-1/2013 code, with a different parameter and a different scenario definition. The values here are not directly comparable with that map and do not describe a rise or fall in hazard relative to it.
Sources
- monitorlegal.ro: Order of the Ministry of Development no. 1,037/2026 approving the technical regulation "Methodology for drawing up seismic risk maps, code RTC 18-2026", Official Gazette of Romania, Part I, no. 771 bis, 11 September 2026. Annex A, Table A.1, pages 32–112; equations 2.5 and 2.6 on page 15; worked examples in Annex C. The order enters into force 30 days after publication, on 11 October 2026.
- monitorlegal.ro: The act's page on monitorlegal.ro, with the order's text and the PDF of the bis issue.
- observator.mdlpa.ro: The ministry's map service for seismic zones, based on P100-1/2013, with which the values here are not directly comparable.
- en.wikipedia.org: The USGS instrumental intensity scale (Worden et al., 2012), as tabulated in the Wikipedia article "Peak ground acceleration": "moderate" up to 0.115 g, "strong" up to 0.215 g, "very strong" up to 0.401 g, "severe" up to 0.747 g. The labels are indicative; the USGS scale relates acceleration to perceived shaking, not to the Romanian table.
- commons.wikimedia.org: Photo: "Bucharest-1977", Sorin Dek, CC0, Wikimedia Commons.
