mariuscomper.uk RO

What was the weather

The weather on any day since 1961, in any town in Romania

Many families have a story about the day someone was born: a frost that split stones, or heat nobody could stand. Romania’s weather service wrote that day down: its low, its high and how much rain or snow fell. Choose the date and the town.

Date

A click on the map also chooses the place.

Friday 22 December 1989, averaged over all of Romania: a low of 0.8 °C and a high of 10.7 °C, with almost no rain or snow.

Friday, 22 December 1989
°C
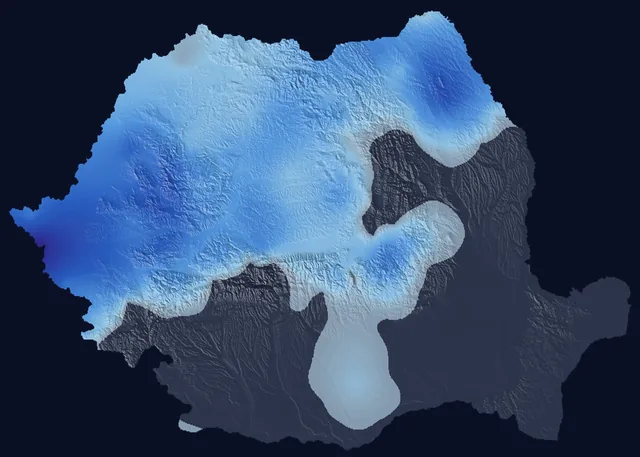
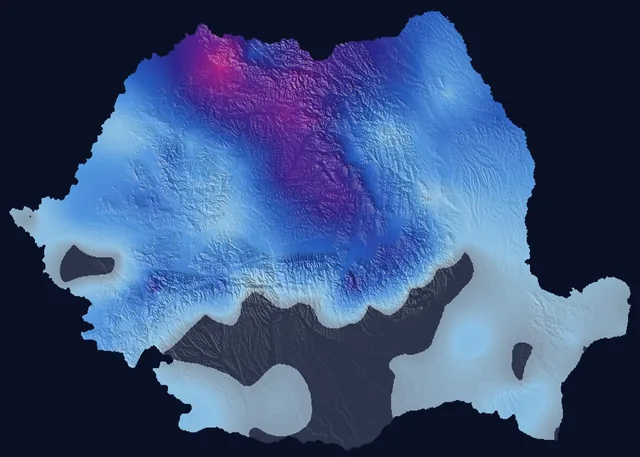
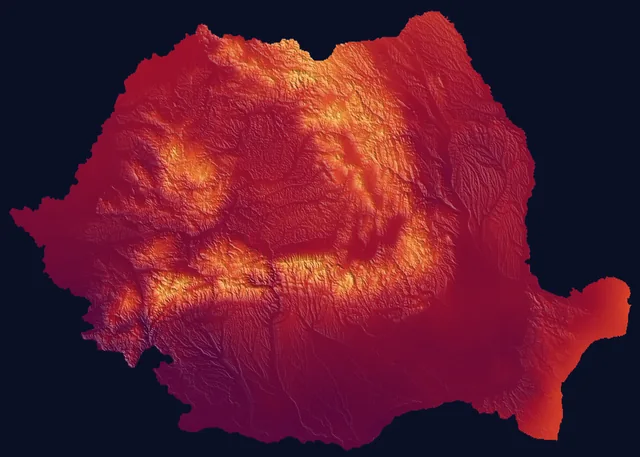
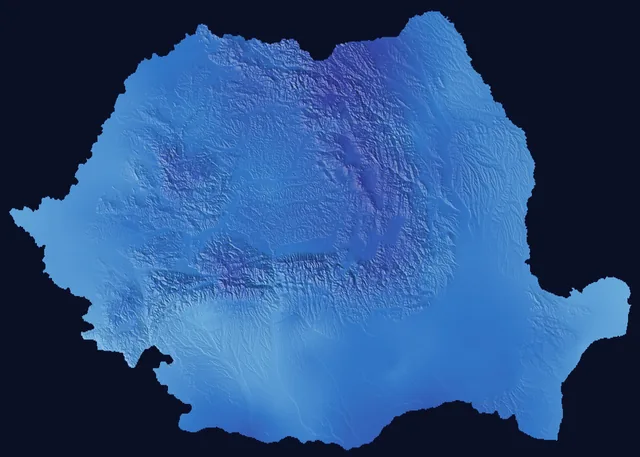
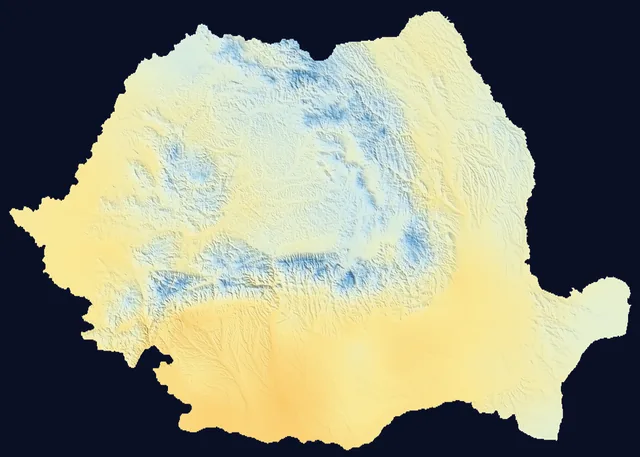
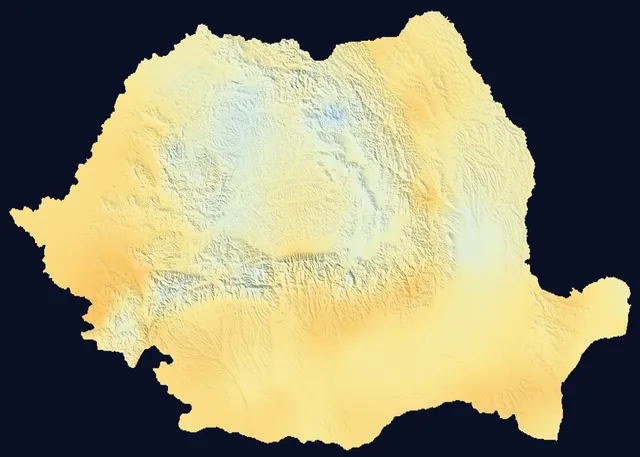
Each point of the map is a square 1 km across, coloured by the temperature or the rain of the chosen day. The shading is the relief.
Days everyone in Romania remembers

#What was the same day like in other years?

Each bar is the same calendar date in another year: its lower end is the low, its upper end the high. The blue dots underneath show how much rain or snow fell. The chosen year is outlined.

A click on a bar opens the map of that year.

#What do all the days look like together?

Each row is a year and each point a day, coloured by its high. Winters are the blue edges, summers the red middle. The chosen day is circled.

The colours are the same as on the map. A click on a day opens its map; on a phone, the first tap shows its values.

#What was the weather on the days everyone remembers?

For those years the archive keeps temperature and precipitation. It has no clouds, wind or snow depth.

Map of Romania on 4 March 1977: daily high

4 March 1977

The evening of the earthquake

The earthquake struck on Friday evening at 21:21. The day had been mild: at Bucharest’s Filaret weather station the high was 12.4 °C, 1.8 degrees above an ordinary 4 March, with no rain. In the night many people spent outdoors, the low measured there was 5.3 °C. That evening, minute by minute.

Map of Romania on 22 December 1989: daily high

22 December 1989

December 1989, as warm as spring

On the day Ceaușescu fled by helicopter from the roof of the Central Committee building, Bucharest’s Filaret weather station measured 11.5 °C. The average high across the country was 10.7 °C, 9.2 degrees above an ordinary 22 December: the second warmest 22 December of the 65 in the archive. In Timișoara on 17 December, the day the army fired on the crowd, the station measured 16.7 °C: the warmest 17 December measured there since 1921.

Map of Romania on 11 August 1999: precipitation

11 August 1999

The total solar eclipse

The archive kept no clouds, only rain. On eclipse day at least 1 mm of rain fell over 48% of the country. In Râmnicu Vâlcea, close to where darkness lasted longest, 2 minutes and 23 seconds, the station recorded no rain, and the high was 35.4 °C.

Map of Romania on 13 May 1970: precipitation

13 May 1970

The rain before the great floods

On the night of 13 to 14 May 1970 the Someș broke its dike at Satu Mare. On 13 May an average of 11.1 mm fell over the whole country, 2.6 km³ of water in one day. The station at Baia Mare measured 121.4 mm, and the one at Satu Mare 41.4 mm. In four days, 11 to 14 May, 6.7 km³ fell on Romania. The spring the water came.

Map of Romania on 24 July 2007: daily high

24 July 2007

The hottest day in the archive

Calafat station measured 44.3 °C, Romania’s record for July. The average high across the country was 37.2 °C, the highest of all 24,057 days in the archive, 10.4 degrees above an ordinary 24 July. Over 93% of the country it was above 30 °C.

Map of Romania on 1 December 2018: daily low

1 December 2018

The Great Union centenary, in Alba Iulia

Those who came to Alba Iulia a hundred years after Transylvania’s union with Romania met hard frost: the town’s station measured a low of −11.8 °C and a high of −0.6 °C. The average low across the country was −12.3 °C.

#Which were Romania’s hottest, coldest and wettest days?

The archive holds 24,057 days. The first five rows are averages over the whole country, computed from the grid; the last three are station measurements, from 1961 on.

ValueDay
Hottest dayaverage high across the country: 37.2 °C; above 30 °C over 93% of the area
Coldest nightaverage low across the country: −25.2 °C
Coldest dayaverage high across the country: −14.2 °C; nowhere on the map did the high rise above freezing
Wettest day31.6 mm on average over the whole country, or 7.6 km³ of water: what usually falls in 17 days. Almost as wet: 30 June 1974 and 12 July 2005
Sharpest cooling from one day to the nextthe average high fell from 24.8 °C to 11.5 °C: 13.3 degrees from one day to the next
Highest temperature measured at a station44.3 °C, at Calafat (Dolj county)
Lowest temperature measured at a station−38.4 °C, at Miercurea Ciuc (Harghita county)
Most rain measured in one day at a station234.7 mm, at Mangalia (Constanța county); the day is the one in the daily series, and the measurement ends the next morning

Of the 100 days with the highest average high across the country, 85 came after 2000 and 60 after 2010. Of the 100 nights with the lowest average low, 63 came before 1990, and the most recent was in 2017.

Romania’s official records were measured at stations and are older than the grid: 44.5 °C at Ion Sion on 10 August 1951 and −38.5 °C at Bod on 25 January 1942.

#What are the records of your county and town?

Every county and every weather station with a long series has its own page: the highest and lowest temperature measured, the wettest day, today’s record, the warmest years and a paragraph ready to quote.

BihorBistrița-NăsăudClujMaramureșSatu MareSălajAlbaBrașovCovasnaHarghitaMureșSibiuBacăuBotoșaniIașiNeamțSuceavaVasluiBrăilaBuzăuConstanțaGalațiTulceaVranceaArgeșCălărașiDâmbovițaGiurgiuIalomițaPrahovaTeleormanBucharestIlfovDoljGorjMehedințiOltVâlceaAradCaraș-SeverinHunedoaraTimișBihorBistrița-NăsăudClujMaramureșSatu MareSălajAlbaBrașovCovasnaHarghitaMureșSibiuBacăuBotoșaniIașiNeamțSuceavaVasluiBrăilaBuzăuConstanțaGalațiTulceaVranceaArgeșCălărașiDâmbovițaGiurgiuIalomițaPrahovaTeleormanIlfovDoljGorjMehedințiOltVâlceaAradCaraș-SeverinHunedoaraTimiș
Choose a county on the map.

#How exact are the values?

The map does not come from a thermometer in every village. The weather service measures at 160 stations and computes from them a value for every 1 km square, taking altitude into account. In a narrow valley, on a shaded slope or in the middle of a large city, the day’s real temperature may have been different.

At a station the grid repeats the measurement: of 3,450,291 station-days from 1961 to 2025, nine in ten differ by at most 0.2 °C for the high and 0.2 °C for the low. That shows the map is built on the stations, not how good it is between them: far from any station the error is larger and cannot be measured with these data.

That is why each answer also shows what the nearest station measured that day, with its distance and altitude.

Rain is harder to pin down than temperature: a summer shower can soak one village and miss the next, and between two stations the grid has no way of knowing. For a place without a station, the millimetres of a summer day are the least certain part of the answer.

#Questions

Where do the data come from?

From “Meteo România – Date deschise”, the open-data platform of Romania’s National Meteorological Administration (ANM), published under the CC BY 4.0 licence: the daily 1 km grid from 1961 and the daily series of the weather stations.

How recent is the archive?

The weather service adds new days a few days late. When this page was last updated, the last day with a high temperature was 12 November 2026; newer days are read straight from the weather service as they appear.

Did it snow that day?

The archive does not say. Snow depth enters the grid only in 2023. For earlier years the page shows precipitation and temperature: when water fell and the day’s high stayed at or below zero, it most likely snowed.

What does 1 mm of precipitation mean?

One litre of water on every square metre.

Can I find the weather before 1961?

Yes, from 1920, for places within 80 km of a station that was measuring then. The answer is the station’s measurement, not an estimate for the place. The longest series begin in 1871, but Romania adopted the Gregorian calendar only in 1919, and a date in older documents may be in the Old Style.

Why does the value differ from what the family remembers?

The grid gives one value for a 1 km square, computed from stations sometimes tens of kilometres away. A thermometer in the yard, in the sun or by a wall, usually reads differently from a station thermometer kept in the shade, two metres above grass.
#Method

Daily maximum temperature, minimum temperature and precipitation come from the weather service’s 0.01° grid (about 1 km): 277,047 squares over Romania, from 1 January 1961. The page reads from the weather service the values of the square that holds the place, and the map of the day.

For 1961–2022 the grid’s meteorological day ends at 18 UTC (8 pm Romanian winter time): the high is the afternoon’s, the low is usually the morning’s, and the rain is what fell since the evening before. From 2023 the weather service ends the day at 06 UTC for the low and for precipitation; for a calendar date the page shows the rain of the interval that covers most of it, from 06 UTC that day to 06 UTC the next.

The 1961–2022 grid was computed on a mesh slightly offset from today’s and re-laid by the weather service onto the current one; a square’s position may be off by a few hundred metres.

“An ordinary day” means the median of the highs on the same calendar date across all years of the series. The comparison of 1961–1990 with 1996–2025 uses every day within 14 days of the chosen date.

The national average is the mean of all grid squares, weighted by their area. A day’s volume of water is the precipitation in each square multiplied by its area, summed.

For a place on the border or the shore the nearest square with data is used. Days on which a station’s low appeared higher than its high were removed; “a few drops” means precipitation under 0.05 mm.

#Sources

Contains data from Romania’s National Meteorological Administration (“Meteo România – Date deschise”), under the CC BY 4.0 licence. The processing and any errors are this page’s, not the weather service’s. Relief: Copernicus DEM GLO-30.