When a big volcano throws sulphur into the stratosphere, droplets of acid spread around the hemisphere and linger for a year or two, sometimes three. Sunsets turn redder and longer. After Krakatau in 1883, sunsets blazed around the world for months; in New York, fire engines were called out. People watched, and some of them painted.
In 2007 a team led by the Greek physicist Christos Zerefos asked whether the paintings kept a trace. They gathered 554 sunsets painted between 1500 and 1900 by 181 artists and measured, on a photograph of each, how red the sky near the horizon is compared with how green: the red/green ratio. About half the paintings sit at 1.16 or below. Only 29 of 299 go past 1.6.
Over the 88 years compared, the yearly average of that ratio rises and falls with Hubert Lamb’s dust veil index: the correlation is 0.83. The paper publishes the values for 299 paintings. They are the stripes above.
One painter, before and after Laki
In June 1783 the Laki fissure in Iceland opened and poured out gas for eight months. That summer a poisonous haze spread over Europe, and the sun rose and set “blood coloured”. In 1778 John Singleton Copley had painted a calm sky behind a shark. The portrait he painted in 1784 has a blazing sunset behind it.
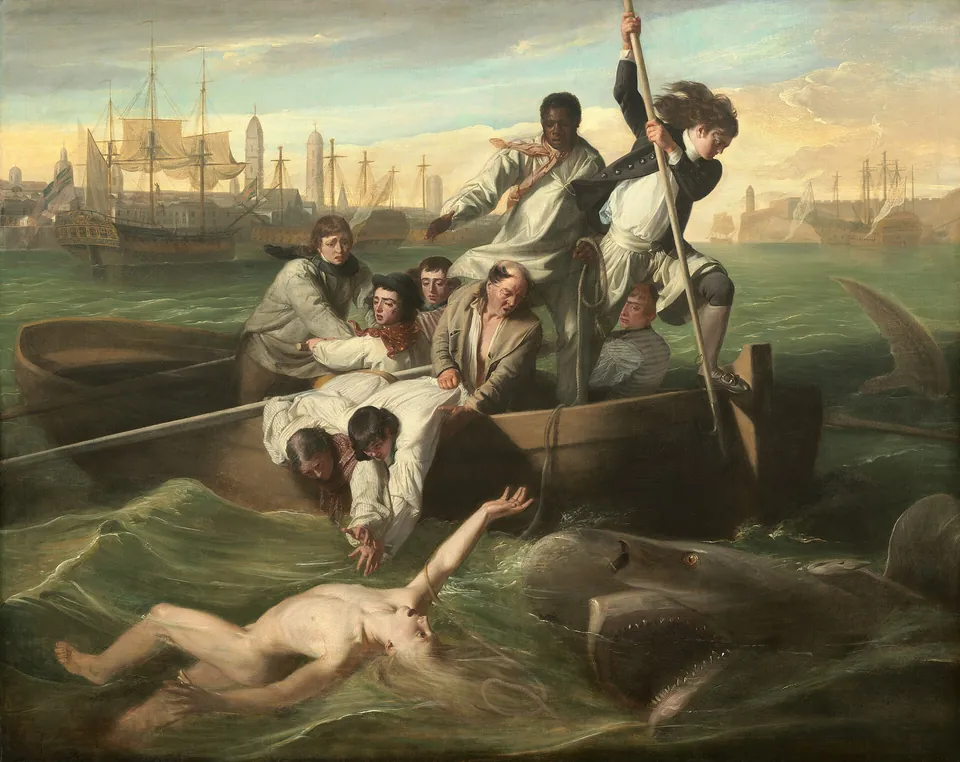
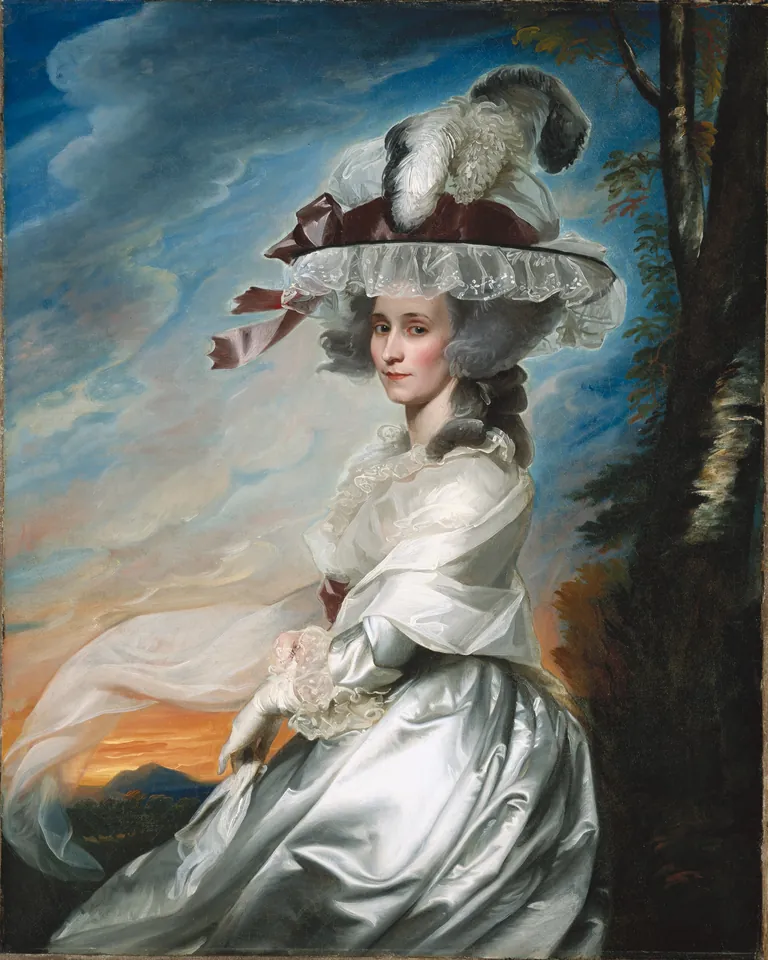
Two paintings prove nothing. A painter picks the sky a scene needs, and a portrait is not a window onto that day’s weather. That is why the study rests on hundreds of paintings, not one.
Four hundred years, one dot per painting
Each dot is one of the 299 paintings, placed at its year and its red/green ratio. The grey bars along the bottom are Lamb’s index, built mostly from historical accounts of the dust veils left by big eruptions. Touch a dot to see the painting.
After Tambora (1815) and after Krakatau (1883), the dots climb. Tambora was the largest eruption in at least 1,300 years, and 1816 became “the year without a summer”. The paper blames the 1831 eruption on Babuyan in the Philippines; a 2025 study traced it instead to the Zavaritskii caldera in the Kuril Islands.
Where it doesn’t fit
In the years after Tambora, Caspar David Friedrich painted a woman facing a sun that sets into a sky on fire. At about the same time he painted his wanderer above the sea of fog, under a cool grey sky. Same painter, same year in the table, two skies.
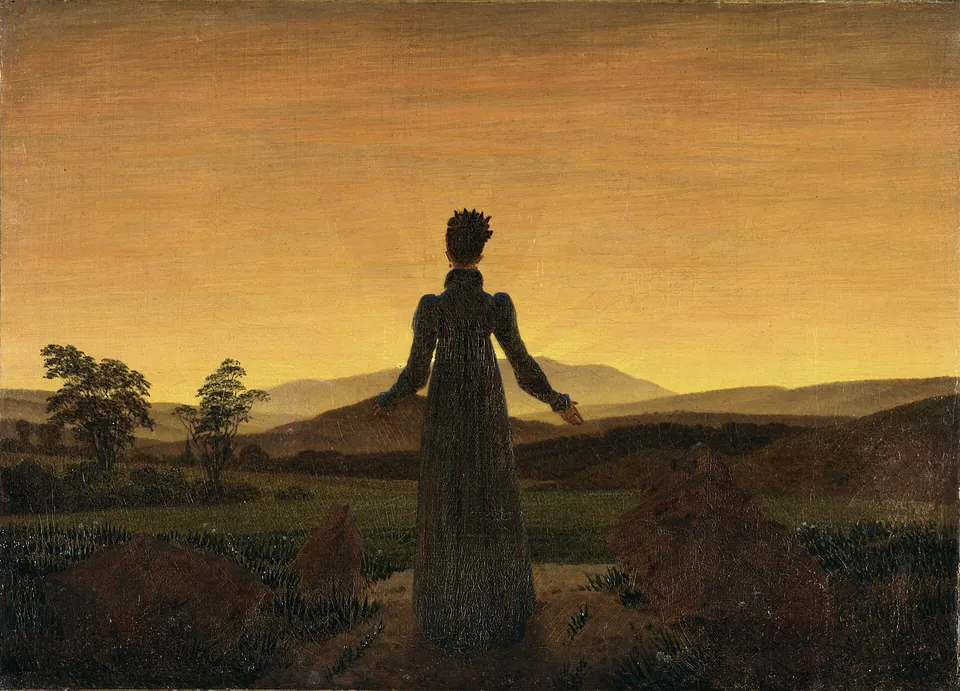
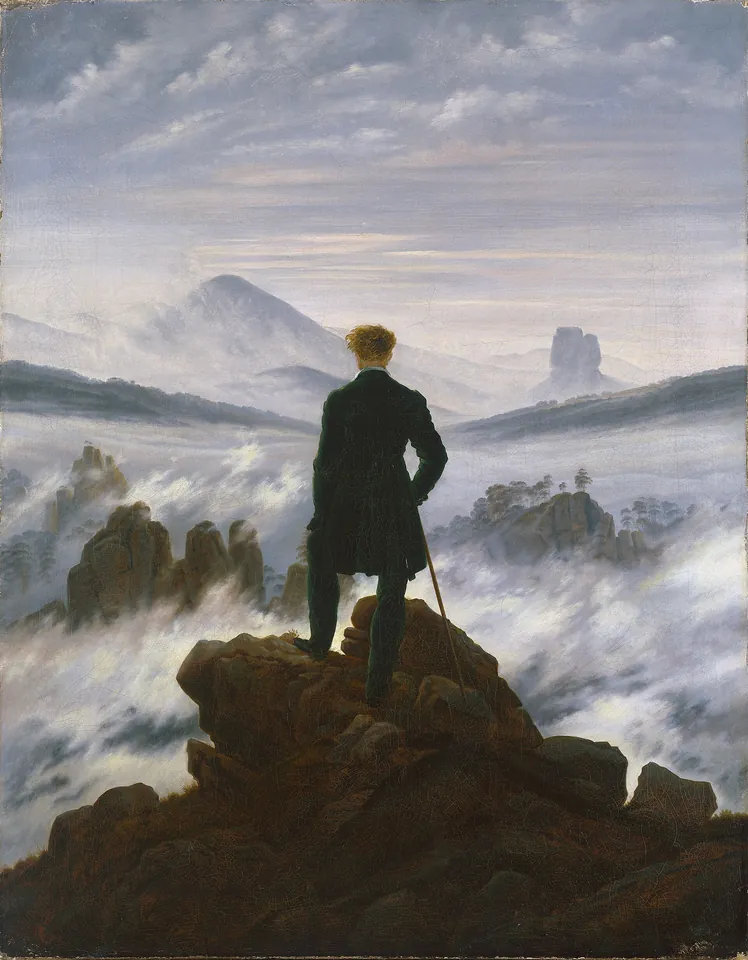
The table puts two Friedrichs in 1835, the year Cosigüina erupted in Nicaragua: a Gothic ruin with the sunset burning through it, and a shore with ships under a faded yellow sky.
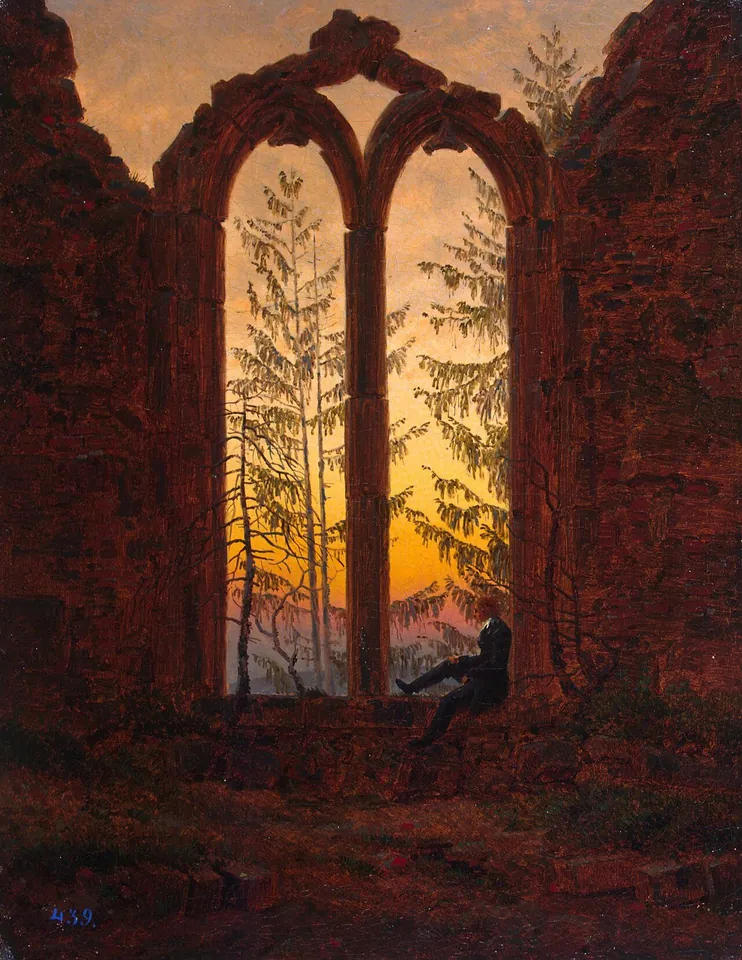
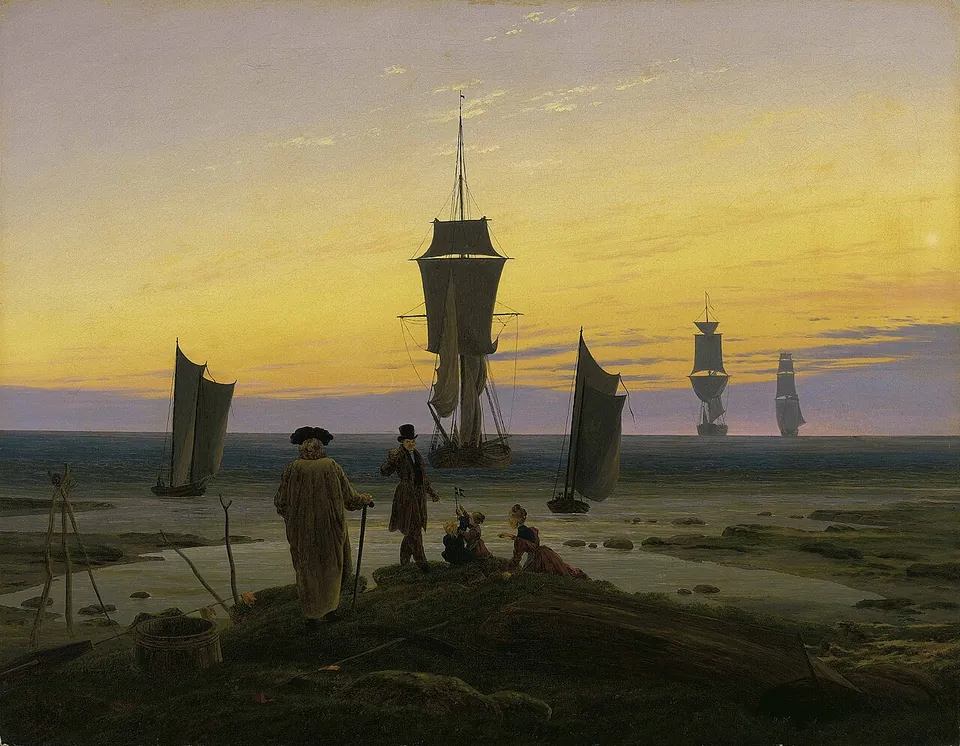
A painting is not an instrument. The painter chooses, exaggerates, works from memory, and many works are only roughly dated. The signal appears only on average, across many canvases.
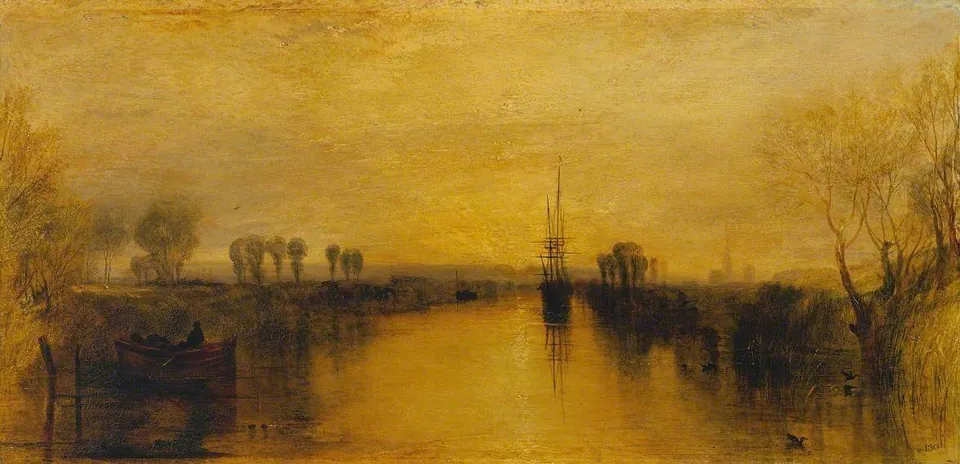
The reddest sky in the table is also Turner’s: The Scarlet Sunset, at 2.40. It was painted some time in the 1830s, so it can’t be tied to any one year, let alone one eruption.
The Scream
The sky in Edvard Munch’s The Scream goes past 2.10, redder than almost anything in the table. The authors still left it out, because its date is disputed. They still suggest that red may be the painter’s memory of the sky after Krakatau.
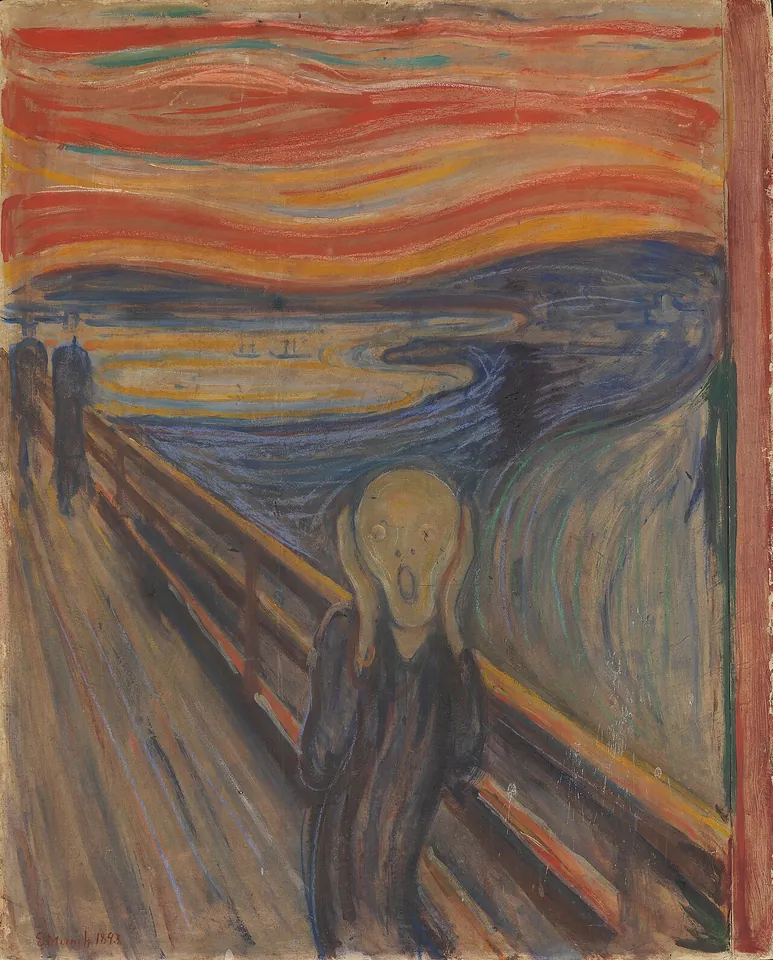
In 2004 the astronomer Donald Olson and colleagues argued that Munch painted his memory of the post-Krakatau sky he saw in Oslo in the winter of 1883–84. In 2018 Fred Prata, Alan Robock and Richard Hamblyn proposed something else: nacreous clouds, which form high over Norway in winter. They don’t close the case either. The volcanic explanation, like the painter’s state of mind, “cannot be ruled out”, they write.
A painter put to the test
In June 2010 a cloud of Saharan dust passed over the Greek island of Hydra. The painter Panayiotis Tetsis painted the sunsets on 19 and 20 June while instruments beside him measured how much dust was in the air. The red/green ratio in his canvases followed what the instruments showed, from heavy dust to less; on the dustiest day the estimate was off from the measurement by about 30%.
It is one painter and one episode, and Tetsis is himself an author of the 2014 paper. It shows that a fine colourist can record the air. It doesn’t show that every painter did.
How sure is this
The authors say the reddening can be “tentatively attributed” to the eruptions. There are reasons for caution:
The yardstick isn’t fully independent. Lamb’s index is built mostly from historical accounts of the sky, that is, from what people saw at sunset. Part of the match may come from there.
The model didn’t come out red. Bernhard Mayer, one of the reviewers, noted that the model’s sky almost always gave a ratio below 1, “blue or grey”. The painted values had to be reduced by 30% to be comparable with the model. He also points out that clouds redden a sunset with no volcano at all.
The uncertainty is large. David Stevenson showed, in one worked example, that the haziness inferred from a single painting could lie anywhere between 0.22 and 1.0.
What remains is a small and strangely beautiful result. Across 400 years, hundreds of painters who knew nothing of aerosols left the sky, on average, redder in just the years that Lamb’s index marks as veiled by volcanic dust.
What is measured and what is imagined
Measured: the red/green ratio of each of the 299 paintings, as Zerefos and colleagues published it, taken from photographs of the works. The horizon colour of each stripe has exactly that ratio. Years, painters, titles and museums are those given in the paper. Where it gives only a range, such as 1830–40, the stripe and the dot sit at the first year.
Imagined: the rest of the sky. The blue, the fade to the upper sky, the brightness and the water below are our choices, made so it can be seen. The stripes are equal in width and in date order, so between 1800 and 1850, when paintings are many, time moves more slowly.
Sources
- C. S. Zerefos, V. T. Gerogiannis, D. Balis, S. C. Zerefos, A. Kazantzidis, “Atmospheric effects of volcanic eruptions as seen by famous artists and depicted in their paintings”, Atmospheric Chemistry and Physics 7, 4027–4042 (2007). Table B1: the 299 paintings and their red/green ratios. doi.org
- The open review of the 2007 paper: comments by B. Mayer (S1324), D. Stevenson (S2141) and anonymous referee #4 (S2152), with the authors’ replies. doi.org
- C. S. Zerefos, P. Tetsis et al., “Further evidence of important environmental information content in red-to-green ratios as depicted in paintings by great masters”, Atmospheric Chemistry and Physics 14, 2987–3015 (2014). The Hydra experiment and the Lamb index series. doi.org
- F. Prata, A. Robock, R. Hamblyn, “The sky in Edvard Munch’s The Scream”, Bulletin of the American Meteorological Society 99 (7), 1377–1390 (2018). doi.org
- Sky & Telescope, press release on the study by D. Olson, R. Doescher and M. Olson (2004) linking The Scream to the post-Krakatau sky. skyandtelescope.org
- W. Hutchison et al., “The 1831 CE mystery eruption identified as Zavaritskii caldera, Simushir Island (Kurils)”, PNAS 122 (2025). doi.org
- Tate, catalogue entry for J. M. W. Turner’s Chichester Canal (c. 1828). www.tate.org.uk
- Wikipedia: “Laki”, “1883 eruption of Krakatoa” and “Year Without a Summer” (with the link between Chichester Canal and Tambora). en.wikipedia.org
- Painting images: Wikimedia Commons, public domain. commons.wikimedia.org