Temperature
We compare the June, July and August means separately, selecting the point with the smallest root mean square temperature difference. The remaining difference, displayed in °C, shows how imperfect the match is.
An atlas of Romanian summers
Bucharest’s summers averaged 24.7°C in 2021–2025. Their monthly temperatures resemble those near Aydın, Turkey, in 1971–1990. Include rain and the match changes. Then look up your Romanian locality.
Type at least two letters. Romanian accents are optional.
ERA5 · June–August · historical baseline: 1971–1990
Brighter points: monthly temperature mismatch below 1°C.
București ↗ near Aydın2021–2025 → 1971–1990 · ERA5
summer mean change from 1971–1990
monthly temperature mismatch (RMS)
2026 is excluded: the APDRC archive used here ends in July.
Reading the map
An average can hide a cool June and a hot August. Compare the months, then see what happens when you include rain.
| Month | Here | Historical match |
|---|---|---|
| June | 22.9 °C59.8 mm | 22.7 °C18.7 mm |
| July | 25.9 °C40.1 mm | 25.8 °C5.2 mm |
| August | 25.3 °C41.6 mm | 25.3 °C4.3 mm |
Two places, two periods
The map starts with a question about home: which past summers resemble the ones we experience now? For each selected place, it searches for the closest monthly temperatures across Europe and the Mediterranean region in 1971–1990. The line connects two places and two periods. Each end describes the same three summer months.
The geographical match depends on the comparison. Two regions can share similar temperatures while receiving different amounts of rain. Switch to “Temperature + rain” and see whether the destination stays the same.
The limits of a likeness
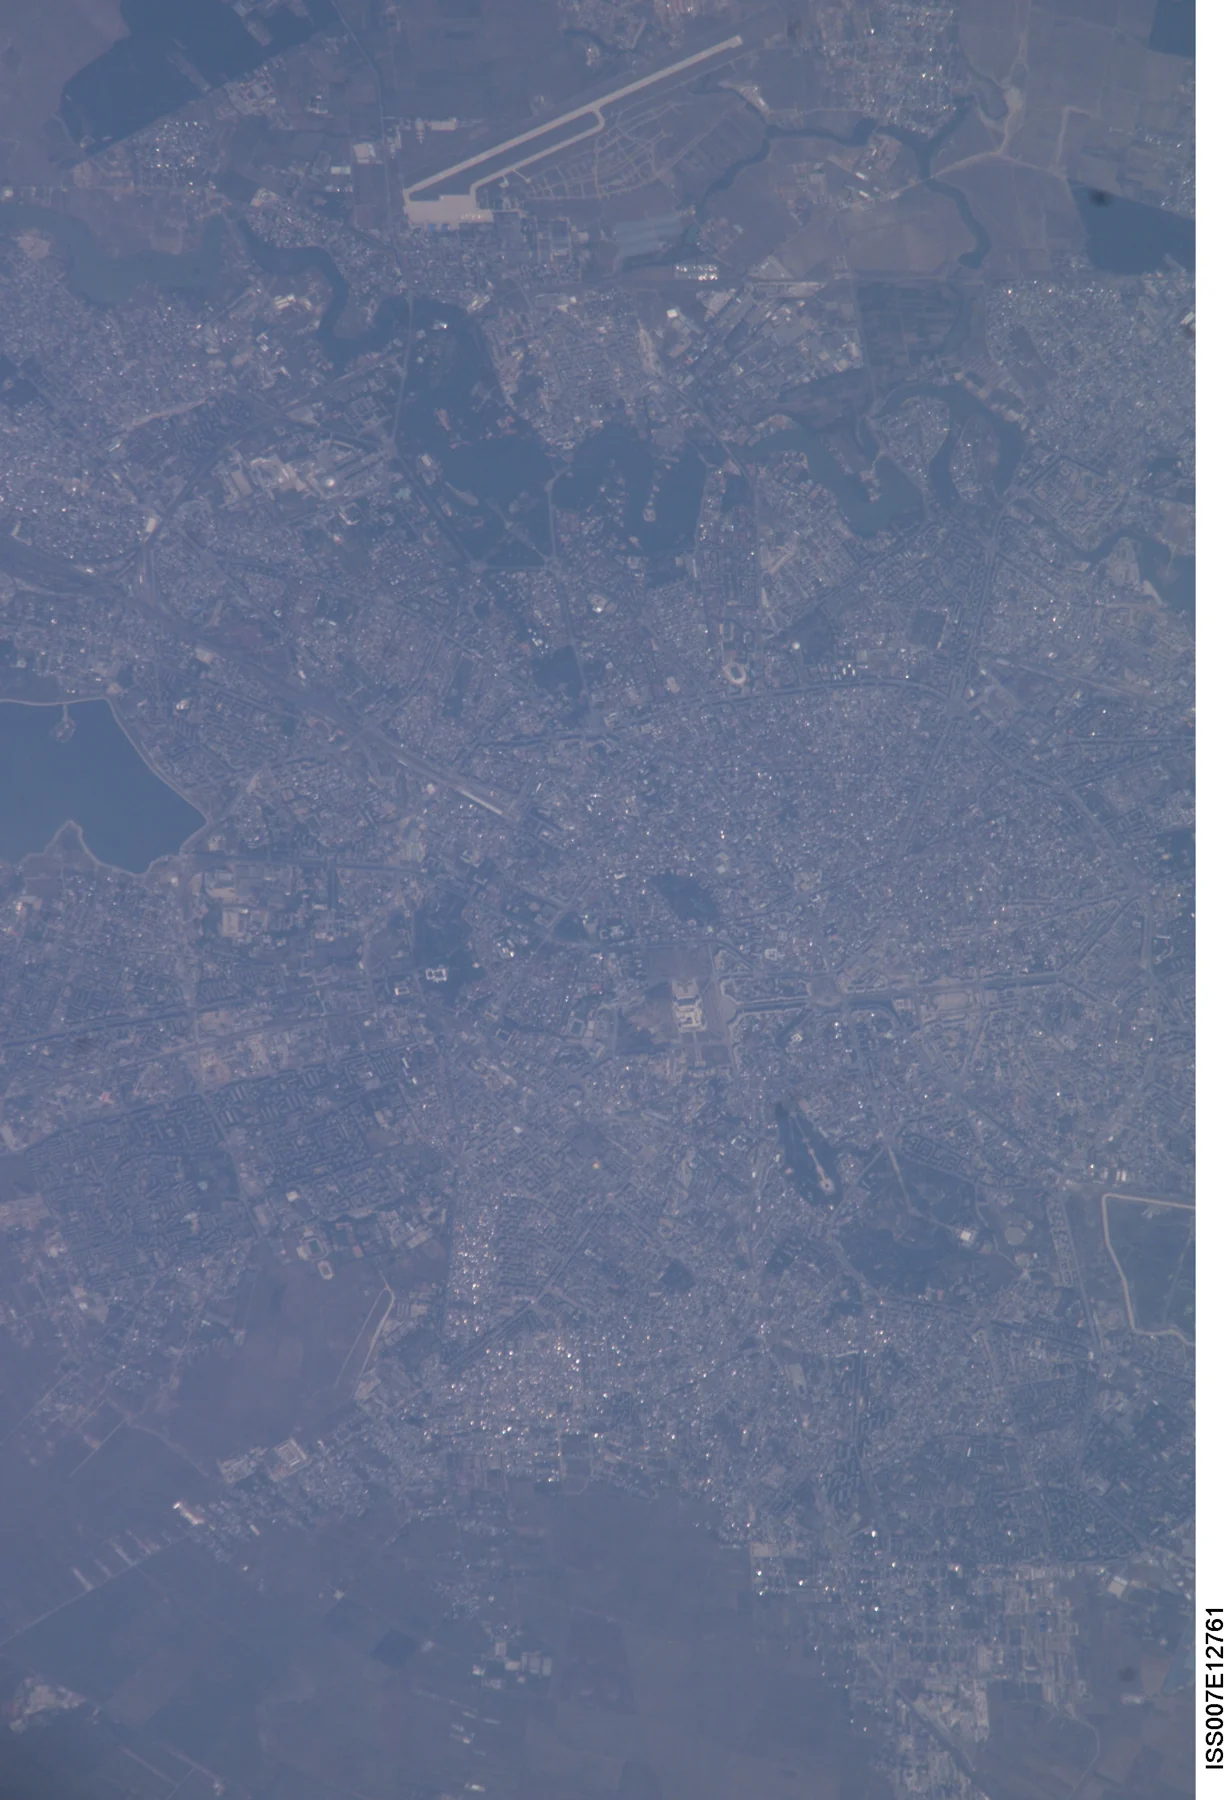
Terrain, distance from the sea and built surfaces shape local conditions. ERA5 describes areas tens of kilometres across. Several villages may share one climate cell, while a cold valley can differ from its cell average. The photograph shows Bucharest from orbit; the comparison uses a data grid.
ERA5 / 1950–2025
We compare the June, July and August means separately, selecting the point with the smallest root mean square temperature difference. The remaining difference, displayed in °C, shows how imperfect the match is.
The combined comparison includes monthly precipitation. Temperature and rainfall are put on comparable scales before matching. Temperature differences are divided by 3.764°C and rainfall differences by 39.284 mm: the spatial standard deviations of the 3,280 reference cells. The two groups have equal weight. These scales describe variation among reference places, rather than observational uncertainty.
Each decade contains ten summers; 2021–2025 contains five. The 1971–1990 reference contains twenty. These windows describe the selected periods; standard climate normals use thirty years. The recent result is more sensitive to a few unusual years.
The search samples native 0.25° ERA5 cells at 0.5° intervals within the declared domain. Coastal cells can mix land and sea influences. Even the closest result can be a poor match. Mean temperature and rainfall alone do not describe heatwaves, drought, humidity or the climate of the whole year.
Two-metre air temperature and precipitation come from ECMWF/Copernicus ERA5 reanalysis, accessed through the University of Hawaii’s APDRC archive. Reanalysis combines observations with a physical model of the atmosphere.
Download the comparison data ↓