What do the data show about warm nights and local health services?
Choose a locality and inspect separate measures: tropical nights, population aged 65 or over, a listed primary-care practice and straight-line distances to reported services. The measures use different dates and definitions.
Find your locality
Search by locality or county. The filters count records that match each condition; they do not calculate a score.
Type at least two letters or choose a condition. Documented examples are below.
Four localities that meet all three conditions
Of the 3,077 localities with all these records, 15 had no listed primary-care practice in 2024 and were more than 30 km straight-line from a locality reporting continuous-admission beds in 2024. Four of them fall in the top tenth for tropical nights in this joined group (at least 13.4 per summer on average in 2016–2025). These conditions describe the records; they do not establish health effects.
Conditions found in the four localities
Locality
Mean tropical nights / summer (2016–2025)
Population aged 65+ on 1 Jan 2026
Primary-care practice (2024)
Distance to a locality with a hospital (2024)
Distance to a locality with a listed primary-care practice
The 65+ share uses 2026 population by domicile; distances are measured between the geometric centroids of administrative areas and do not show a road route.
What each dataset measures
Tropical nights: Average number of summer nights when minimum temperature stayed at or above 20 °C, 2016–2025. E-OBS v34.0e, 0.1° grid; the value describes the grid cell at the locality’s representative point.
Population aged 65+: INS TEMPO POP107D, on 1 January 2026; population by domicile. The percentage uses the locality total from that same series as its denominator.
Primary-care practice: INS SAN101B and SAN104B, 2024. The recorded measure includes family or general-medicine practices, civil medical partnerships, dispensaries, health centres and localities with a registered family doctor. Other medical services are outside this measure.
Distance to a locality with a hospital: INS SAN102C, continuous-admission beds, 2024. A locality is included when it reported such beds. Distance to the nearest qualifying locality is measured straight-line between the geometric centroids of the administrative areas; 0 km means beds are reported in the same locality. Hospital addresses, roads and journey times are not used.
Distance to a locality with a listed primary-care practice: For localities without a listed practice, the straight-line distance between the geometric centroids of the administrative areas to the nearest locality with the service recorded in 2024.
The full set has 3,181 localities. The night-time source has 3,085 locality-seat records; eight of those lack the required health-service table records. The shared group has 3,077 localities. Night values here describe the E-OBS grid cell at each locality’s representative point and are not population-weighted; the climate project’s national summary uses 2021 census weights. Practices and beds are reported for 2024; the 65+ population is by domicile in 2026.
Tropical nights: for each complete summer from 2016 to 2025, count June–August nights with minimum temperature at or above 20 °C; then average the ten annual values.
Share aged 65+: (population aged 65–79 + population aged 80 or over) ÷ total locality population × 100. All values use population by domicile in POP107D on 1 January 2026.
The comparison group contains 3,077 localities with all four datasets. Of those, 15 had no primary-care practice listed in 2024 and were more than 30 km straight-line from a locality with a hospital reporting continuous-admission beds. Four of the 15 averaged at least 13.4 tropical nights a summer in 2016–2025, the 90th-percentile threshold in the comparison group.
Distances are between the geometric centroids of administrative areas; they are not road routes, hospital-address distances or journey times. The results describe separate records and do not measure anyone’s exposure or medical risk.
Primary sources and reuse
E-OBS v34.0e — daily minimum temperatures on a 0.1° grid; data used for non-commercial research and education with source acknowledgement.
INS TEMPO-Online — POP107D (age), SAN101B and SAN104B (primary care), SAN102C (continuous-admission beds). Check INS terms before reusing its data.
Required acknowledgement: “We acknowledge the E-OBS dataset and the data providers in the ECA&D project (https://www.ecad.eu).” Do not redistribute the daily temperature values.
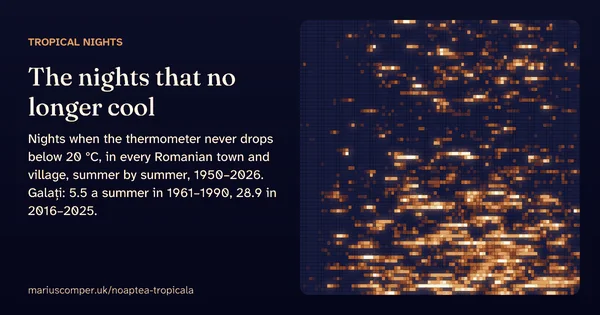
A tropical night is one when the minimum temperature never drops below 20 °C. Galați, in Romania’s eastern lowlands, averaged 5.5 a summer in 1961–1990 and 28.9 in 2016–2025; Craiova 1.9 and 12.4. Every summer since 1950, night by night, for any Romanian town or village.
The median age of each of Romania’s 3,181 localities, computed from the registered population by single year of age (INS, POP107D), on a map with every real boundary. Search your locality, see how old it is against the country and the county, its age fingerprint in one hundred squares, its pyramid by sex and its path from 1992 to 2026. In 528 localities there are now more registered people aged 80 or over than children under 10; in 1992 there were 9.
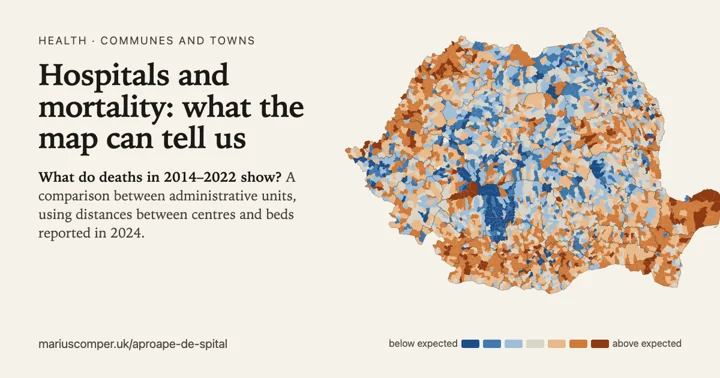
A comparison between administrative units: deaths in 2014–2022, registered-domicile population and distances between geographic centres towards units with hospital beds in 2024. The 87 units beyond 30 km contain 1.1% of the analysed population. It does not measure each person’s journey or establish an individual risk threshold.
Doctors, family doctors, dentists, pharmacies and hospital beds per 10,000 residents, for each of Romania's 3,181 localities, today and twenty years ago. Doctors per 10,000 residents rose from 21.2 in 2004 to 34.0 in 2024, but towns have 56.4 and communes only 5.8; 315 localities lost their last doctor, and 566 have never had a pharmacy or a hospital.