The lake that warms itself
Lacul Ursu, Sovata: 21 °C at the surface, 56 °C at about 1.3 m, measured on 22–27 July 1901, then the same lake up to 2016.
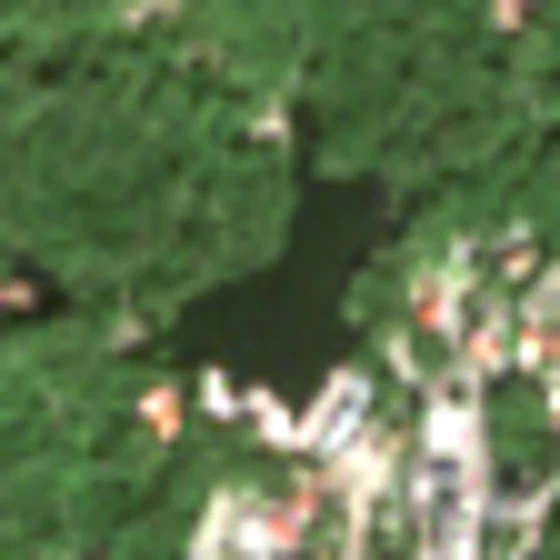
Seen by Sentinel-2 on 9 September 2026, 10 m pixels. The lake formed in the 1870s when a cavern in the rock salt collapsed. Bar: 100 m.
Scroll ↓
Into the lake
Each colour is a temperature that Alexander von Kalecsinszky measured here on 22–27 July 1901, from the surface down to 12 m; the dots are his readings, between them the colour is interpolated.
At the surface the water is 21 °C, about the air temperature. At 0.1 m it already holds 5 % sodium chloride; where the stream flows in, the surface has almost no salt.
Keep scrolling: the dashed line is the depth you are at.
It gets hotter as you go down
39 °C at 0.42 m. 52 °C at 0.82 m. 56 °C at 1.32 m, in July, in a lake in the Carpathians.
Kalecsinszky's daily maxima at that depth rose from 55 °C on 22 July to 63 °C in early August 1901.
And colder again below
47 °C at 2.32 m, 35 °C at 3.82 m, 29 °C at 7.32 m, 20 °C at 12.32 m. As Kalecsinszky wrote, the hottest layer floats between two cold ones; the part warmer than 40 °C is more than 2 m thick.
The deepest temperature reading in this table is 12.32 m. The lake was recorded as 23 m deep in 1904 (Maxim 1929, via USGS); the stippled area marks depths this profile does not cover.
Why: lighter water on heavy brine
Such lakes are called heliothermal: the sun warms the water below the surface, and salt that increases with depth keeps that warm water from rising. The brine is denser than the fresher water above it, so it mixes little and loses its heat slowly.
The salt content rises steeply with depth. In 1901 the water holds 5 % sodium chloride at 0.1 m and 23 % at 1 m. A modern profile (5 July 2004, Alexe & Șerban 2014) shows the same step in grams per litre: 56–57 g/l down to 1.5 m, 62 at 2 m, 178 at 2.5 m, 309 at 4 m. The temperature peak (38.1 °C) sits at 2.5 m, on the step. The explanation is Kalecsinszky's (1901): the less salty layer above slows heat loss to the air. In 2016 (2 July, thesis estimates of salt) the step and the peak are at the same depths as in 2004.
The year turns
Illyés Kálmán, a district notary, measured the hottest layer with a thermometer that keeps the highest reading it reached, from September 1898 to May 1899. He recorded 65 °C in mid-September, 40 °C on 22 December, a low of 26.25 °C on both 2 and 8 April, and 55 °C again on 10 May. Kalecsinszky printed the series. The owner, Sófalvi Illyés Lajos, also reported water at 30 °C under the ice in the winter of 1900–01.
The series follows the hottest layer, whose depth can vary.
The same lake in 2012
Alexe and Șerban profiled the lake on four dates in 2012. 20 February: ice on the surface, 7 °C at 1.5 m, warmer water below. 12 June: 39.5 °C at 1 m. By 1 September the hot layer has faded; on 1 September and 15 November the deeper water is roughly 22–26 °C, and the surface in November is about 6 °C.
I read these four curves off the paper's figure by measuring pixels. My estimate of the error is ±1 °C and ±0.2 m, and ±1.5 °C and ±0.3 m for the September curve.
Measured peaks, 1898 to 2016
Thirteen summers side by side, each strip one profile; scroll to step along them. Peak temperature in the summer profiles: 70 °C in 1898 (USGS table; Roth's own figure for that day is 67.5), 56 in 1901, 41 in 1925, 38.1 in 2004, 39.5 in 2012 (±1), 38.8 in 2016. A ≥ before the number (1906, 1907) marks profiles that stop at their hottest reading, so the true peak may be deeper.
The measured summer peaks fell early: 56–70 °C in the profiles of 1898–1902, 41–50 °C in 1904–09, and about 38–41 °C in the four summer profiles from 1925 to 2016. Alexe and Șerban propose reasons: heavy use for bathing and treatment, water taken out and returned in larger amounts with lower salinity, and fresh water from a lake upstream that was drained in 1997. I did not test them. Apart from 28 April 1926, printed only as a figure, I found no dated profile before 2003.
Your day on the lake
Pick a date. The page takes the profile closest to that date in the calendar and gives the water at 1.5 m only if 1.5 m lies within that profile's readings.
What I checked, and what I did not
My minimum before building: at least three published, dated profiles with depth and temperature. Passed with 17: 3 read at source (Kalecsinszky 1901, Alexe & Șerban 2014, Blain 2019), 4 traced from a figure, and 10 taken from a 1980 USGS table whose originals (Rigler 1903, Schafarzik 1908, Hankó 1910, Rózsa 1915, Maxim 1929) I could not open.
● read at source · ○ via the USGS 1980 table · ≈ traced from a figure. On the stage: filled dot = read at source, ring = USGS table, grey band = traced.
| Date | Depths read | Hottest | At depth | Source |
|---|---|---|---|---|
| ○23 September 1898 | 7 | 70 °C | 1.3 m | L. Roth von Telegd, reported by Kalecsinszky 1901; numbers via USGS Table I-1 via USGS 1980 (original not opened) |
| ●22–27 July 1901 (mean of the days) | 17 | 56 °C | 1.32 m | Kalecsinszky 1901, Földtani Közlöny 31, p. 415 (German) = p. 337 (Hungarian) read at source |
| ○July 1902 (day not given) | 9 | 60.5 °C | 1 m | Rigler 1903, via USGS Table I-1 via USGS 1980 (original not opened) |
| ○9 August 1904 | 9 | 45.6 °C | 2 m | Schafarzik 1908, via USGS Table I-1 via USGS 1980 (original not opened) |
| ○7 August 1905 | 10 | 41 °C | 2.3 m | Maxim 1929, via USGS Table I-1 via USGS 1980 (original not opened) |
| ○23 July 1906 | 5 | 50 °C | 2 m | Hankó 1910, via USGS Table I-1 via USGS 1980 (original not opened) |
| ○28 August 1907 | 6 | 42.5 °C | 2.3 m | Rózsa 1915, via USGS Table I-1 via USGS 1980 (original not opened) |
| ○June 1908 (day not given) | 6 | 50 °C | 2 m | Rózsa 1915, via USGS Table I-1 via USGS 1980 (original not opened) |
| ○4 August 1909 | 8 | 41.5 °C | 2.3 m | Hankó 1910, via USGS Table I-1 via USGS 1980 (original not opened) |
| ○3 May 1921 | 6 | 29.5 °C | 2 m | Maxim 1929, via USGS Table I-1 via USGS 1980 (original not opened) |
| ○7 August 1925 | 10 | 40.8 °C | 2.5 m | Maxim 1929, via USGS Table I-1 via USGS 1980 (original not opened) |
| ●5 July 2004, 14:00 | 10 | 38.1 °C | 2.5 m | Alexe & Șerban 2014, Carpathian J. Earth Environ. Sci. 9(2), Fig. 3A (values printed on the figure) read at source |
| ≈20 February 2012, 12:00 (ice on the lake) | 13 | 24 °C | 6 m | Alexe & Șerban 2014, Fig. 3B, curve traced from the figure traced from a figure, ±1 °C, ±0.2 m |
| ≈12 June 2012, 13:00 | 13 | 39.5 °C | 1 m | Alexe & Șerban 2014, Fig. 3B, curve traced from the figure traced from a figure, ±1 °C, ±0.2 m |
| ≈1 September 2012, 12:00 | 10 | 25.5 °C | 4 m | Alexe & Șerban 2014, Fig. 3B, dotted curve read by eye traced from a figure, ±1.5 °C, ±0.3 m |
| ≈15 November 2012, 12:00 | 10 | 25.7 °C | 3 m | Alexe & Șerban 2014, Fig. 3B, grey curve read by eye traced from a figure, ±1 °C, ±0.2 m |
| ●2 July 2016 | 11 | 38.8 °C | 2.5 m | Blain 2019, QUB MPhil thesis, Table 3.1 (11 samples from the centre of the lake) read at source |
The tests: initial rules and three dated amendments
The rules are in docs/PREREG, with dates. A hot layer counts when the peak is not the first or last reading, is at least 30 °C, and is at least 8 °C above the deepest reading.
- Peak between 1.0 and 2.5 m. As first written, this test failed: it counted the February and November 2012 curves as hot layers. Under the amended rule, all 9 of the 9 qualifying profiles pass. Five have their measured peak on a boundary: 1902 and June 2012 at 1.0 m; 1925, 2004 and 2016 at 2.5 m. In June 2012 the readings at 0.75 and 1.0 m differ by less than my trace error. Not testable under this rule: 1906 and 1907 end at their hottest reading; 1908 and 1909 have peaks only 5 and 0.5 °C above their deepest reading; May 1921 and February, September and November 2012 have peaks below 30 °C and less than 8 °C above their deepest reading.
- Surface to peak, June–September: 25.8 °C on average over the 7 qualifying profiles that have a surface reading (USGS quotes 26 °C over 11).
- Cooling: over the 13 June–September profiles (median slope, rank correlation, and the chance of so steady a fall when the order is shuffled) the line falls 1.9 °C per decade; rank correlation −0.88, one-sided permutation p = 0.0001. Almost all of the fall is before 1905: from 1905 on, 9 profiles, the line falls 0.34 °C per decade (p = 0.013). The set includes 1908 and 1909, which fail the hot-layer rule, and the lower bounds of 1906 and 1907; 1 September 2012 is left out.
Where the sources disagree
| Item | Original paper | USGS 1980 |
|---|---|---|
| Roth's 66.2, 67.5, 69.5 °C | 1898 (Kalecsinszky p. 340) | USGS: 1899 |
| Illyés Lajos, 70–71 °C | summer 1900 (Kalecsinszky, by word of the owner) | USGS: summer 1901 |
| Hottest single reading in the 1901 series | 63 °C on 2 August in the Hungarian edition, 3 August in the German one | USGS: 3 August |
| Roth's highest reading, 69.5 °C | 25 September in the Hungarian edition, 24 September in the German one | USGS: 24 September |
| The 23 September 1898 profile | Roth's measurement, quoted by Kalecsinszky | USGS labels it Kalecsinsky 1901 |
| Kalecsinszky's depth column ends 41.82 m → 19 °C | same in the German and Hungarian editions; left out as a probable misprint | — |
| Peak on 23 September 1898 | 67.5 °C (Roth, in Kalecsinszky p. 340) | USGS Table I-1: 70 °C at 1.3 m |
Also
- Kalecsinszky's sampler was 32 cm tall; he gave salt depths at its opening and temperature depths at the thermometer bulb below.
- The 7 August dates of 1905 and 1925 follow USGS Table I-1; I could not check them against Maxim's original.
- USGS also prints single peaks for 6 July 1910 (52 °C at 2 m, Rózsa 1911) and 28 April 1926 (36 °C at 2.5 m, Maxim 1929), with the full profiles only as figures; not used. Not opened: the originals of Rigler, Schafarzik, Hankó, Rózsa and Maxim.
- The satellite outline is a locator, not a survey. The 10 m pixels that read as water add up to about 3 ha; a survey reported 45,696 m² for 1904. The two are not comparable, because the mask drops mixed shore pixels. The USGS summary dates the lake's formation to 1879; Alexe and Șerban give 1875–1879.
- The 2016 salinity values are the thesis's own estimates. Not retrieved: the supplementary tables of Baricz et al. 2021 (profiles 2015–16) and the open data of Andrei et al. 2015 (October 2013).
Sources: Kalecsinszky Sándor, A szovátai meleg és forró konyhasóstavakról / Über die ungarischen warmen und heissen Kochsalzseen, Földtani Közlöny 31 (1901), real-j.mtak.hu; Alexe M. & Șerban G., 2014, Carpathian J. Earth Environ. Sci. 9(2), 103–111; Blain D., 2019, MPhil thesis, Queen's University Belfast, Table 3.1; Kirkland D.W., Bradbury J.P. & Dean W.E., 1980, USGS Open-File Report 80-807; Sentinel-2 L2A, scene S2C_35TLM_20260909 (Copernicus, via Element 84 Earth Search).