01A view from before
What does the c.1700 view show?
A panorama is not a survey of the streets
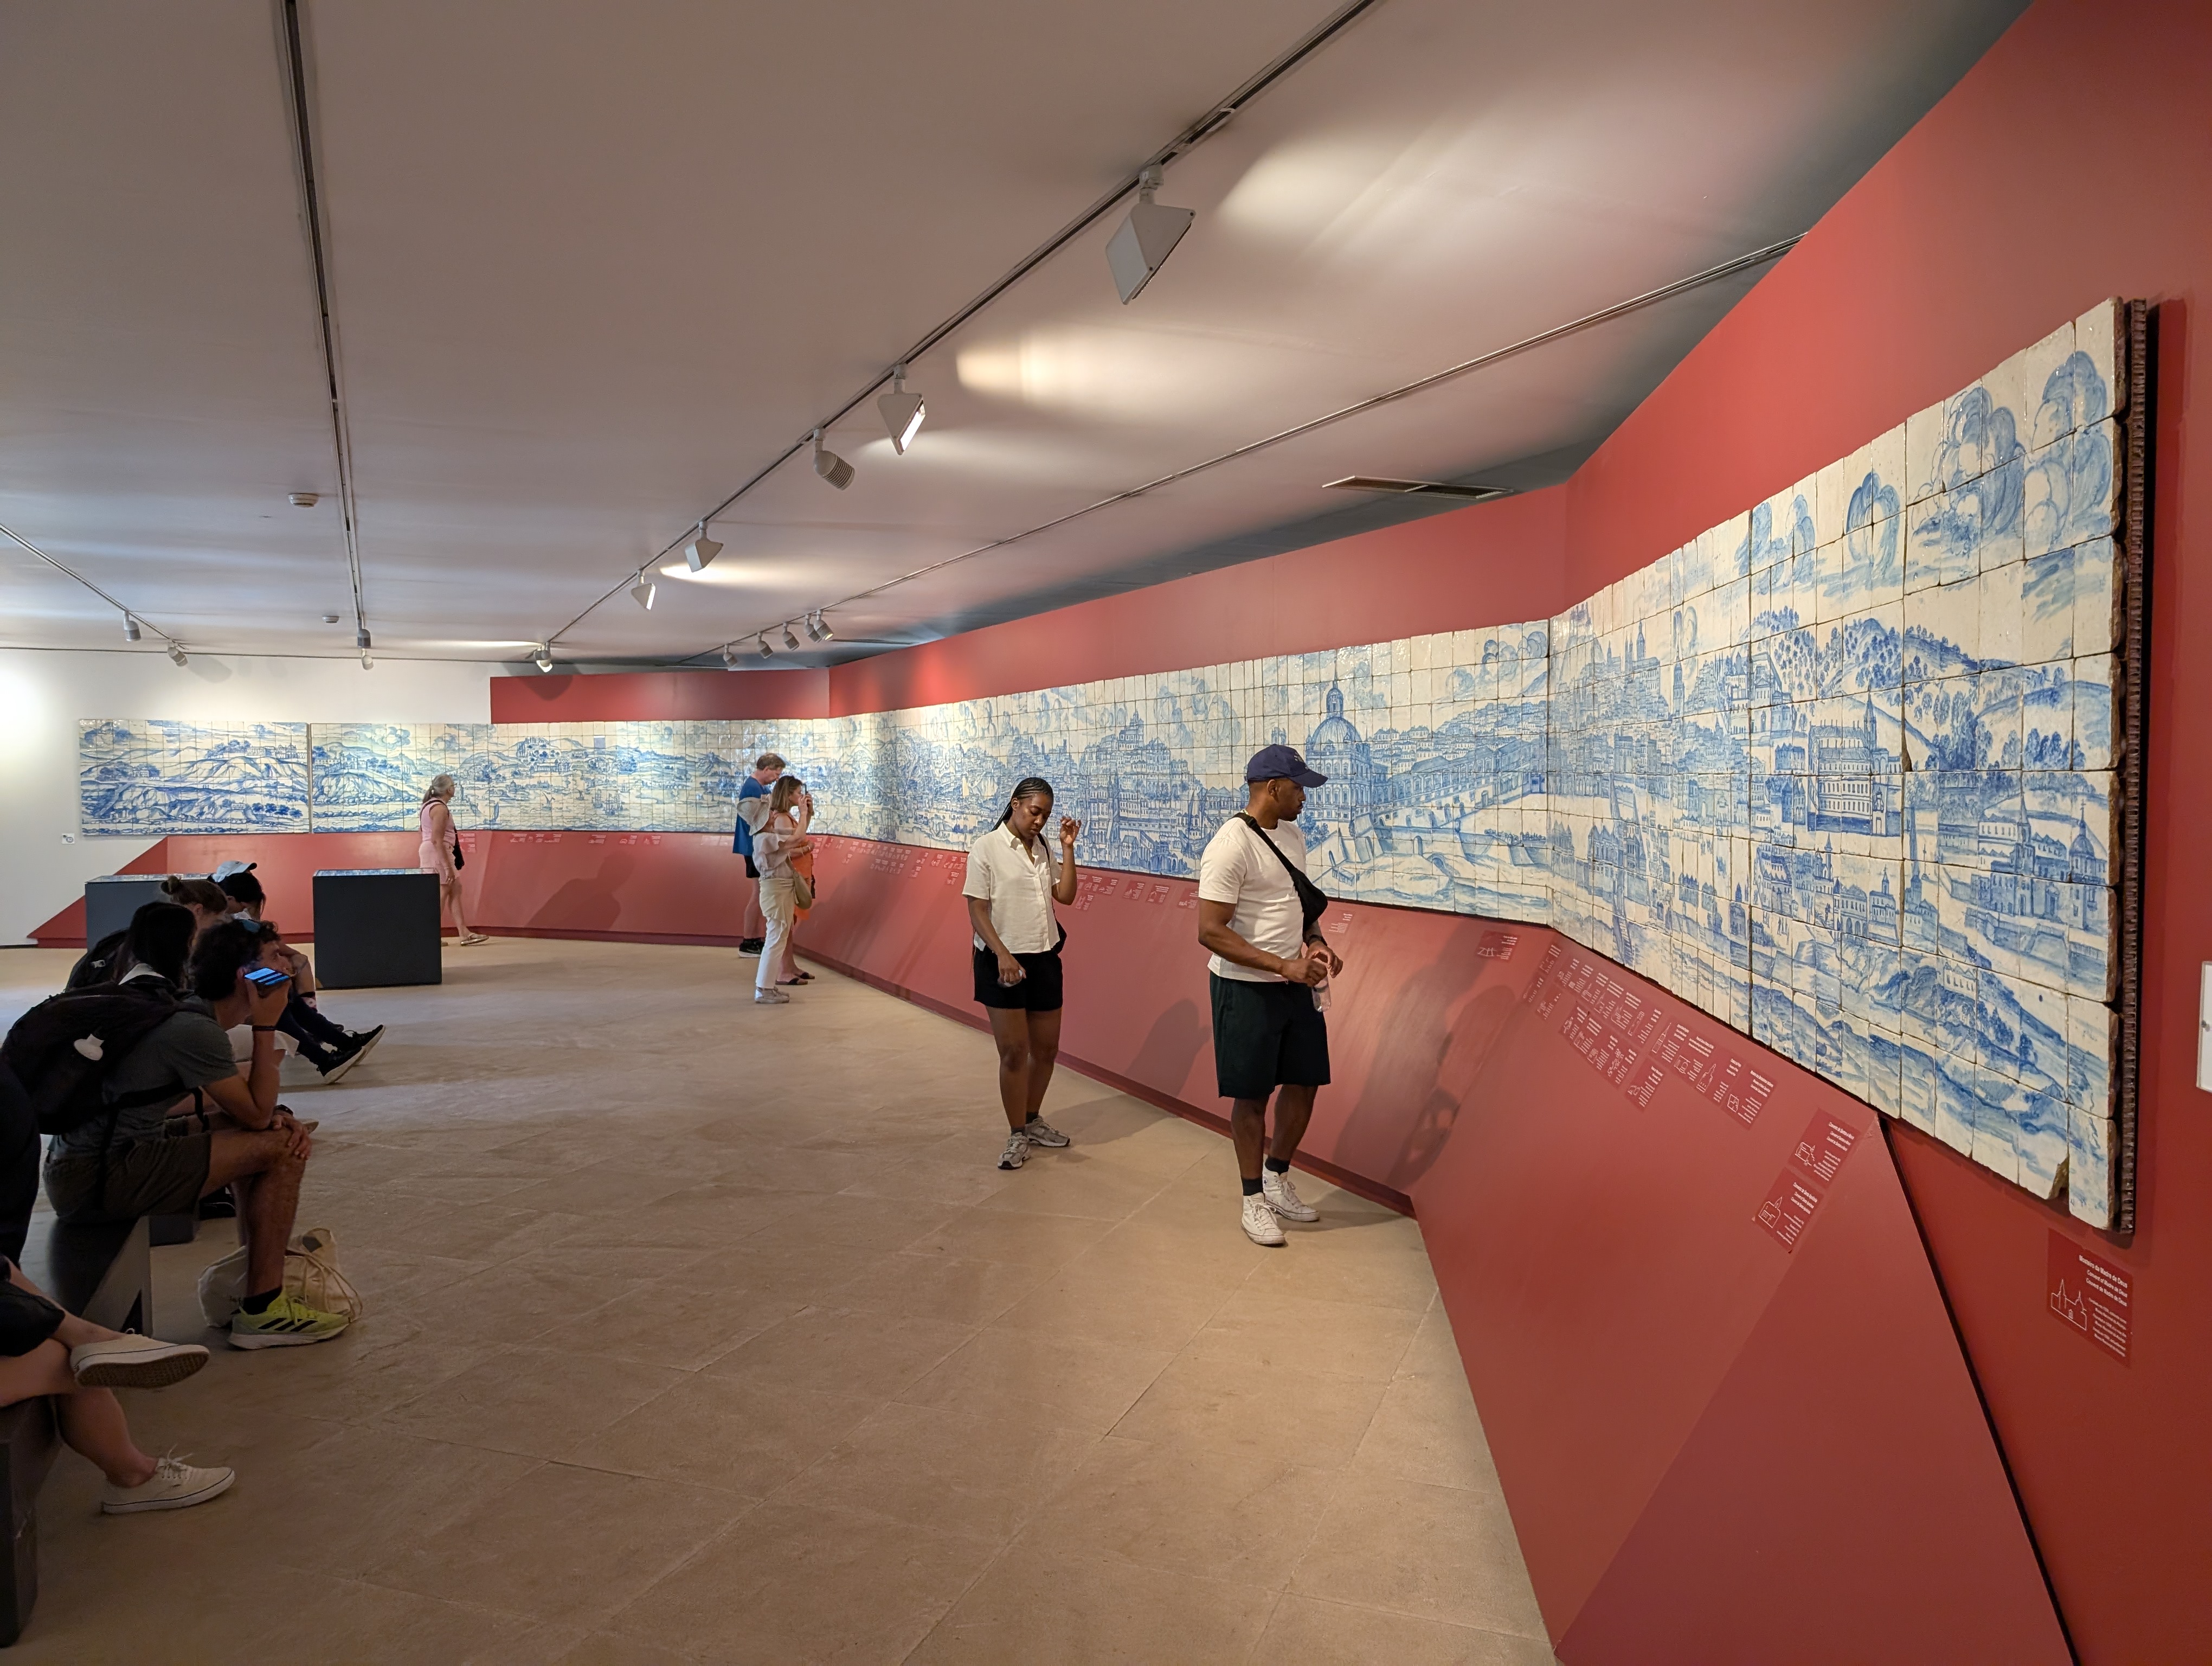
A long wall of painted tiles shows Lisbon from a distance. It does not document every street on the eve of the earthquake. V10 V11
The work known as the Grande Panorama de Lisboa is dated to around 1700. The museum attributes it, with qualification, to Gabriel del Barco. The photograph here was made much later: the image and the photograph have separate dates and histories. V10 V11
A broad view helps us picture the city, but it does not locate every building or show what would happen in 1755. V10
021 November 1755
How did the shocks unfold?
Earthquake, tsunami, then fires
On All Saints’ morning, the city was struck by an earthquake, followed by a tsunami and fires. The sequence is better established than any universal minute for the wave or a single duration for the fires. V03 V01
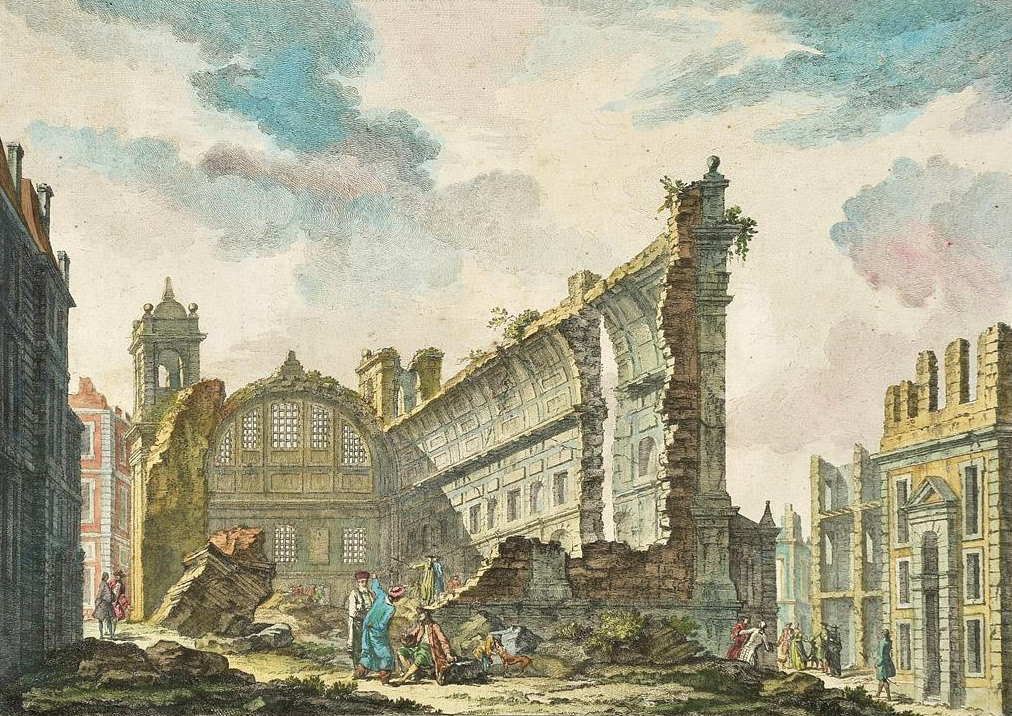
An engraving made by Jacques Philippe Le Bas in 1757 shows the ruins of São Nicolau church. It depicts one place at a moment after the disaster, not a damage map of the whole city. V03 V12
In the 2019 study’s numerical model, the tsunami reaches its defined downtown study area after about 60 minutes. That is the result of that model for that area, not a universal arrival time for Lisbon. V01
03Two studied territories
What does “uneven damage” mean?
One catastrophe, different local patterns
This is not a complete map of the ruins. Two studies document different experiences in bounded areas, using different methods and asking different questions. V01 V02
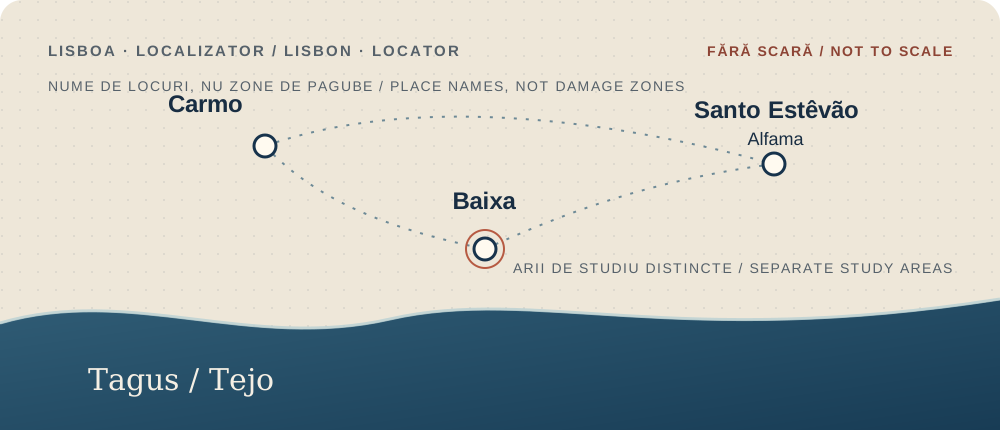
In the central area studied in 2019, the authors conclude that the earthquake did not significantly damage most of their study area; fire caused most property damage there, while their tsunami model shows effects in central and western sections. This finding belongs to that territory, not every Lisbon neighbourhood. V01
The 2022 study follows Santo Estêvão, part of Alfama. Documents, fieldwork and modelling show substantial local effects. A fall in households or residents describes population change; it is not a percentage of buildings destroyed. V02
04From proposals to rules
How was the new Baixa planned?
Rebuilding was a process, not one drawing
Manuel da Maia organized the reconstruction debate, which produced several proposals. The May 1758 law and the separate June record are distinct milestones. V03 V05 V06
The Commons file page dates the chart below to 1756 and names Eugénio dos Santos and Carlos Mardel. Research on the cartography warns that the dates of related charts, and their relationship to the final plan, are not fully established. This image records the proposals; it does not prove the approved final plan. V05 V13
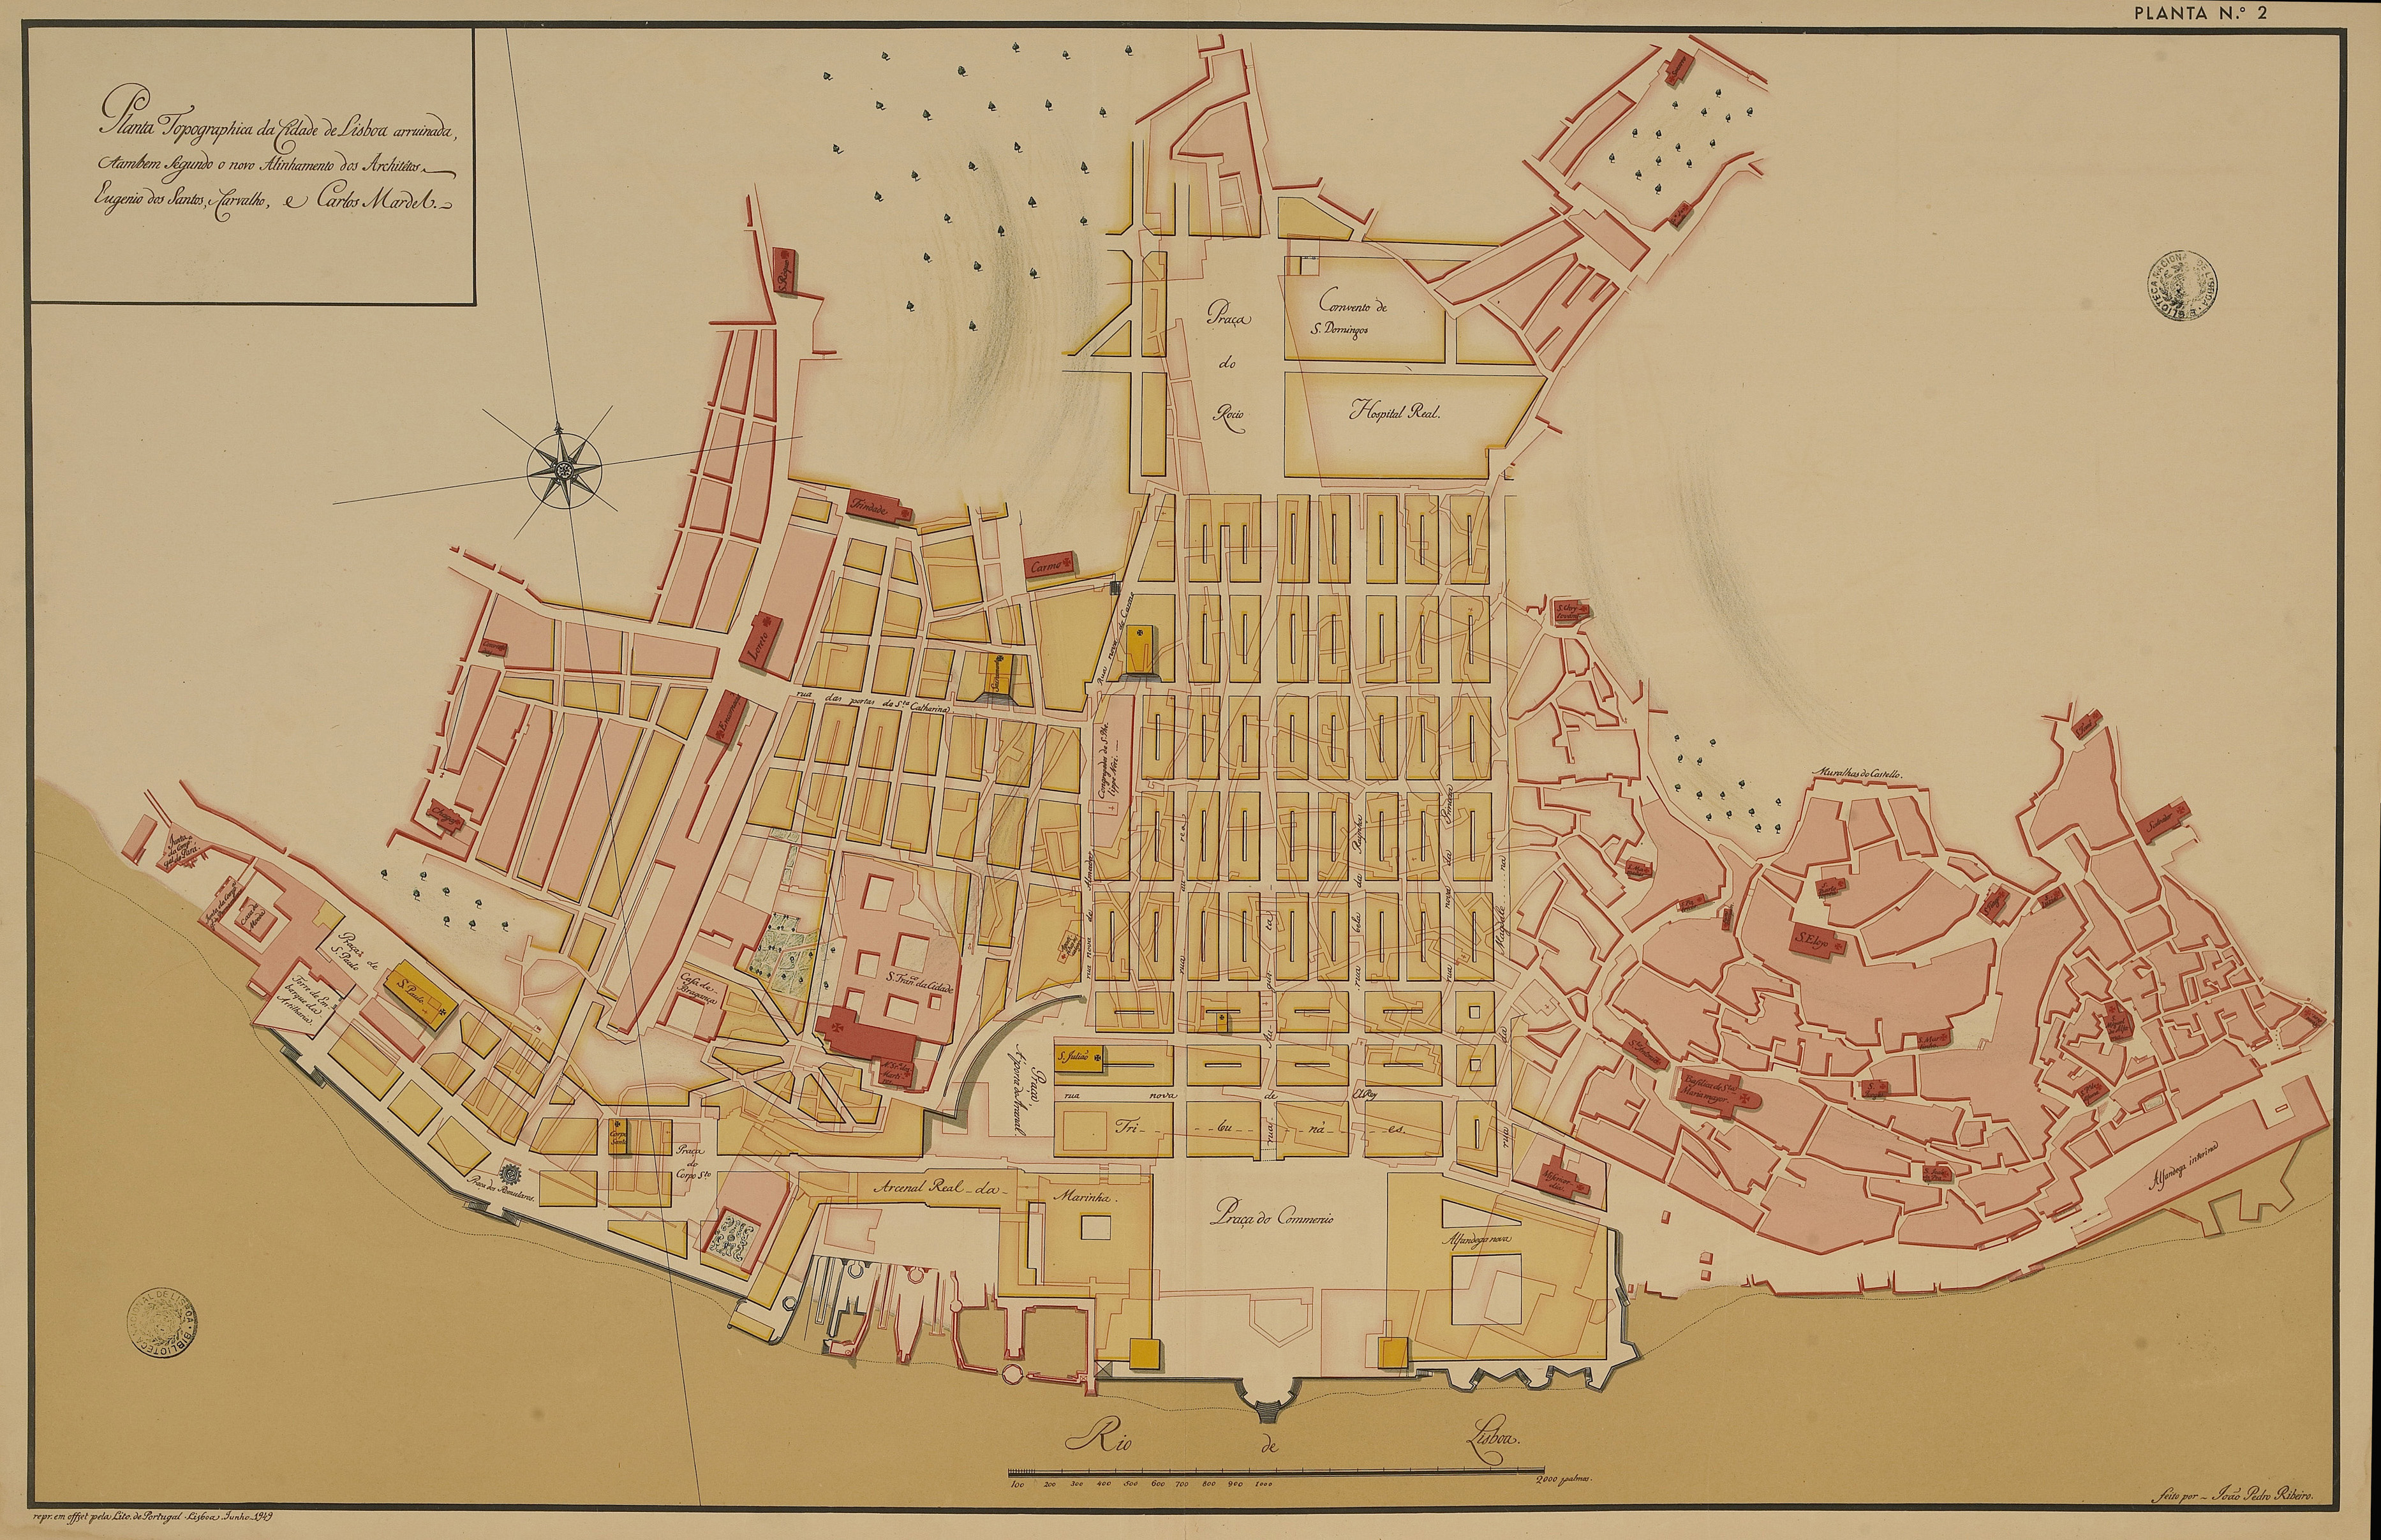
The University of Coimbra archive separately records the royal law of 12 May 1758 on rebuilding and an alignment record dated 12 June. Carvalho e Melo, a minister during the crisis and later known as the Marquis of Pombal, had a major political role; no unverified quotation is attributed to him here. V03 V06 V18 V19
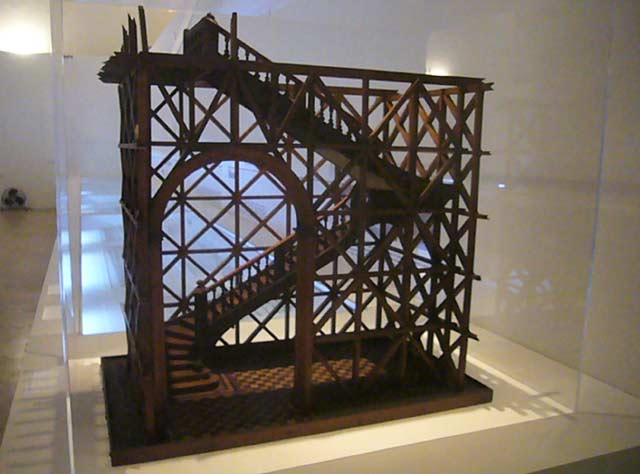
The model shows a gaiola: timber framing tied to masonry, intended to improve seismic performance. It is an explanatory model, not a measured wall section or a promise of absolute protection. V09 V16
05Two traces in the present city
What does present-day Lisbon show?
Baixa adapted; Carmo became a memorial
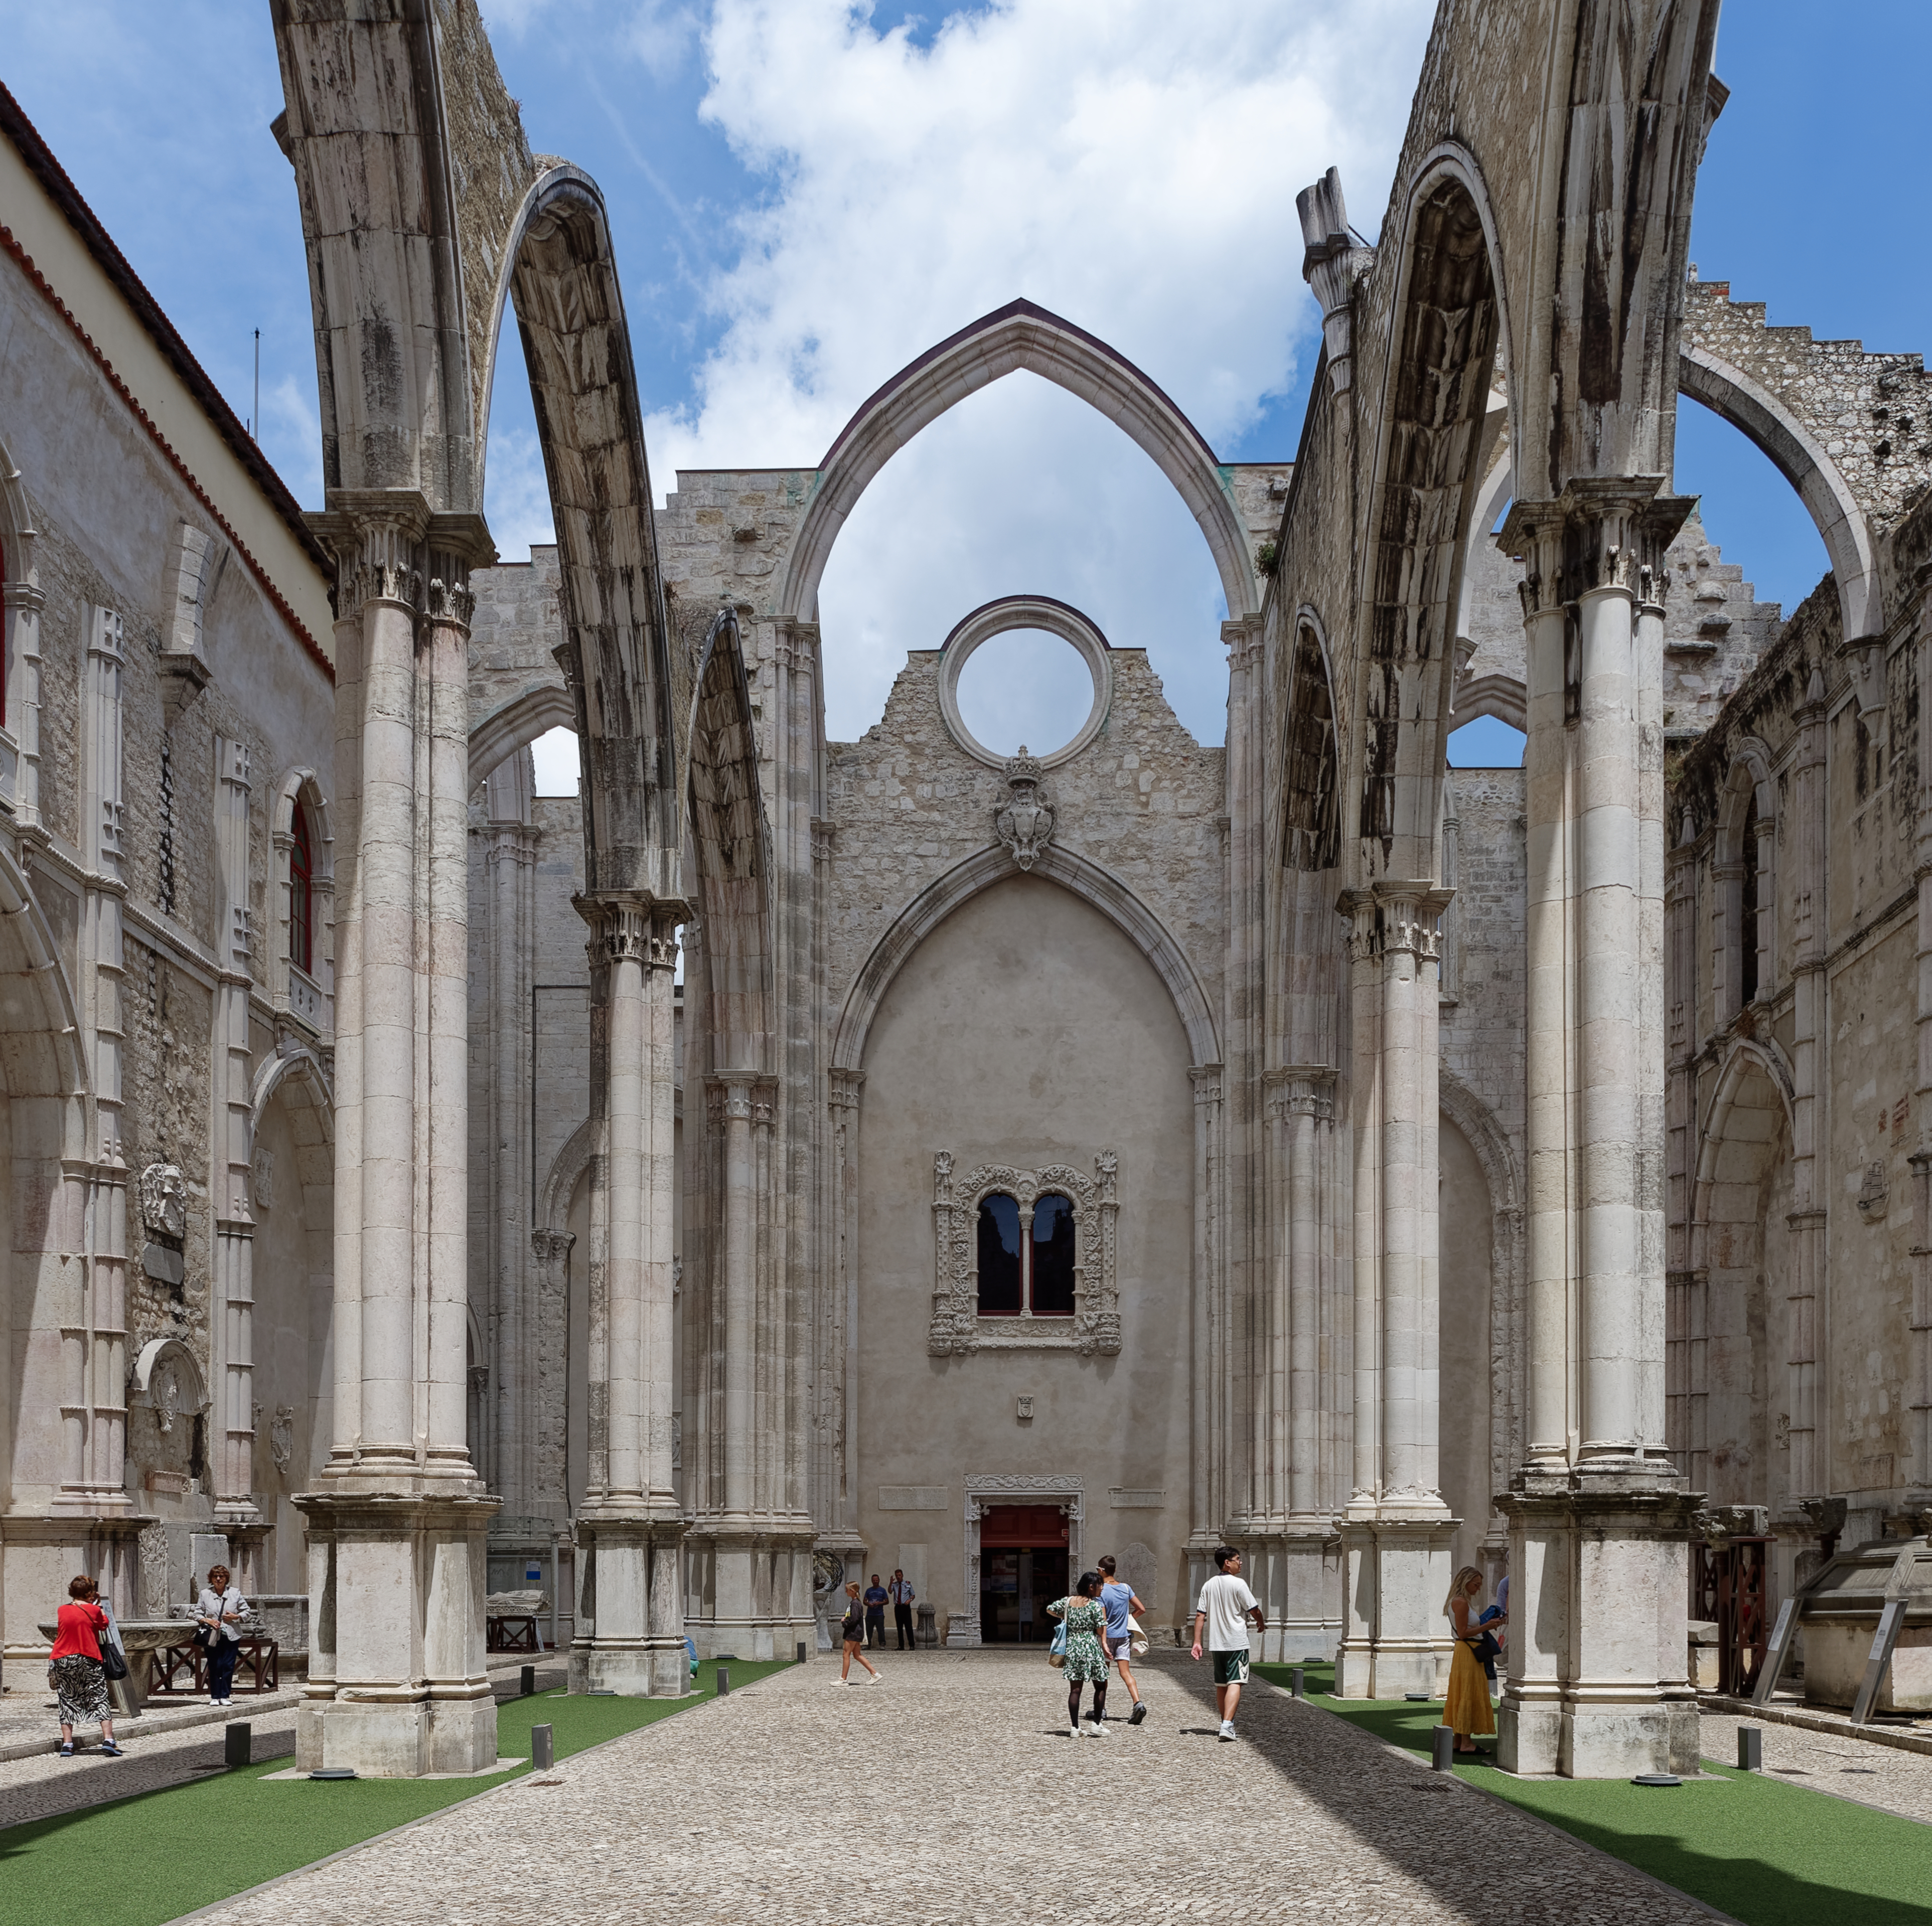
The regular grid and standardised façades remain visible in Baixa, but the city changed over time. At Carmo, the sky above the nave reflects a later memorial decision. V07 V08
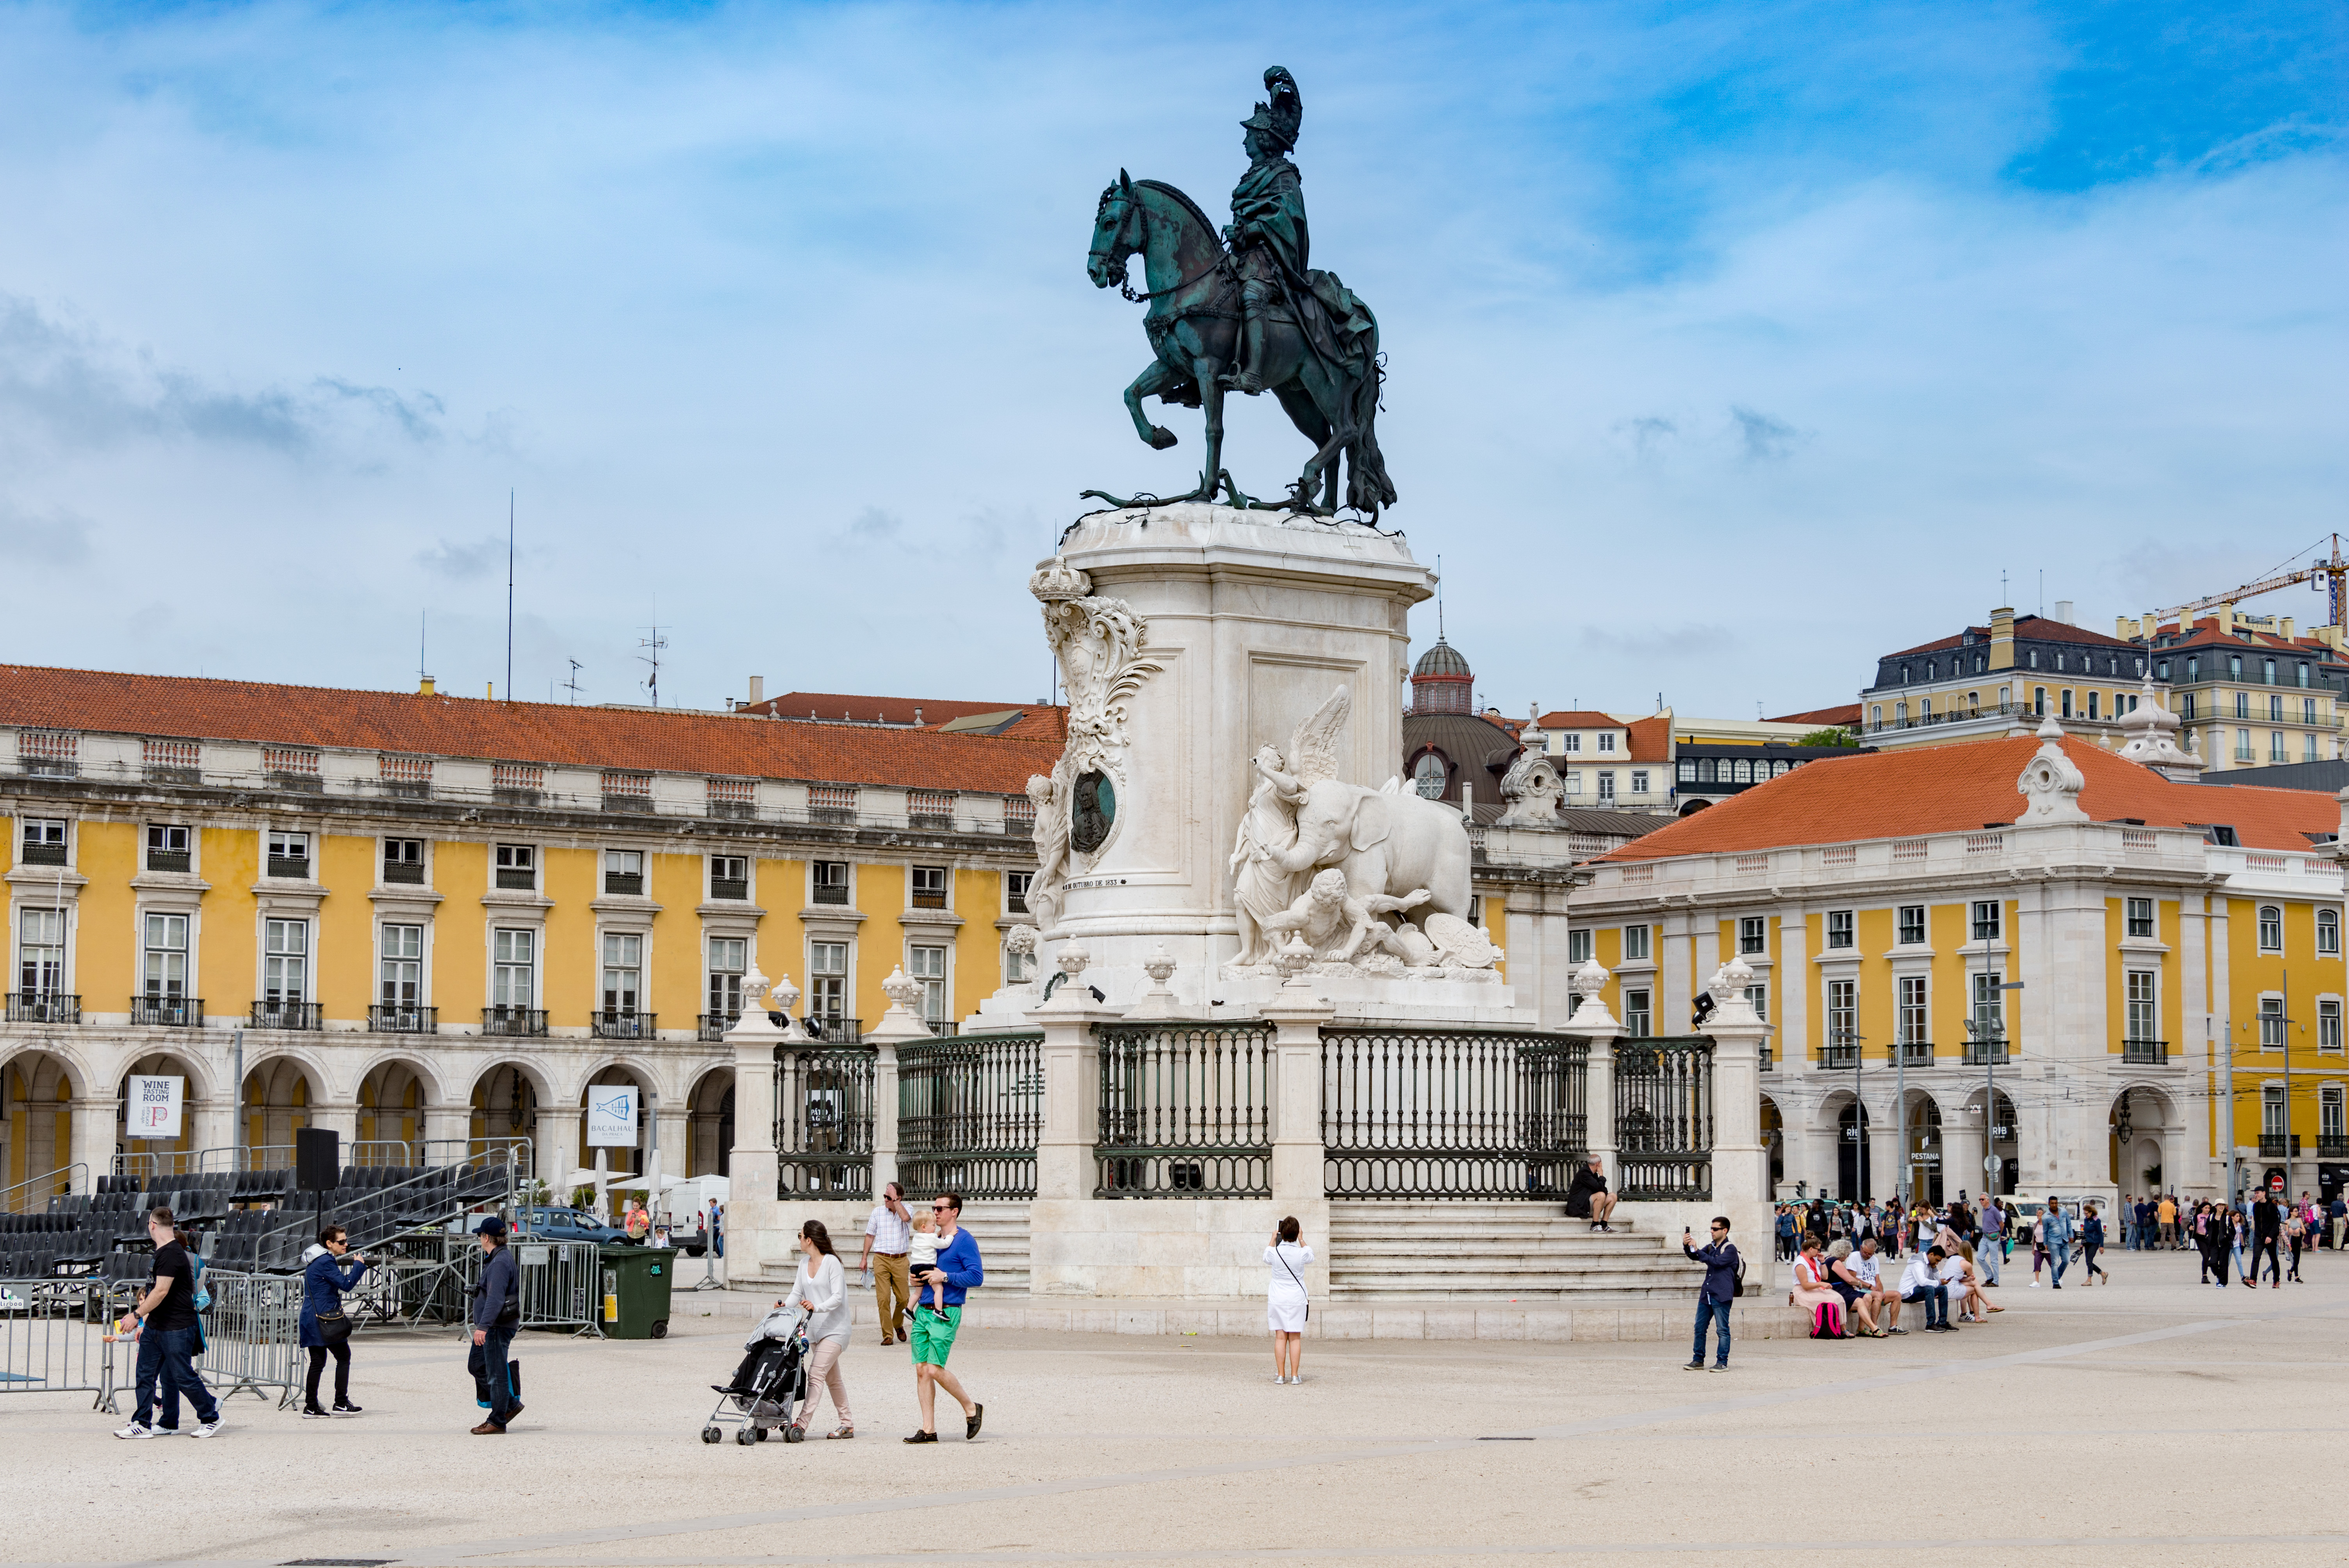
Research on the urban form describes a persistent order, not a district frozen in 1758. The plan was interpreted, completed and adapted; the photograph below records a street in 2017. V07 V14
At Carmo, rebuilding began in 1756 and stopped in 1834. A mid-19th-century decision to leave the nave open to the sky made the building a memorial; the archaeological museum was founded in 1864. V08 V15