The sky, dragged back in time
The Moon is leaving at almost the speed your fingernails grow
Drag back through 640 million years of sky. The Moon looms larger, the day gets shorter, and every number tells you whether it was measured, counted in rock or only calculated.
Marius Comper · 28 September 2026
Drag the sky back in time
Choose how far back to look. The Sun and the Moon are drawn at their relative sizes for that age, as they would look from Earth.
- Length of day
- Days in a year
- Distance to the Moon
- Moon, apparent width
- Central eclipses in this sky
The Sun is drawn at the size it had then, from the standard solar model: 640 million years ago it was 2.1% smaller than today.
Days in a year, through time
- measured today
- counted in fossils or rock
- worked out from rock cycles
- another reading of the same rocks
- model and its range
The blue line is a published model, fitted only to today's rate and to the Moon's age, not to these fossils. The dots come from rock and shell. Where they meet the line, two independent sources back each other. Where they do not, the page says so.
The model's numbers, briefly
| Age | Length of day | Days a year | Distance (km) | Moon, apparent width | Sun, apparent width |
|---|---|---|---|---|---|
| today | 24 h 00 min | 365 | 383,600 | 29.4–33.6′ | 31.4–32.5′ |
| 72 million years ago | 23 h 35 min | 372 | 380,800 | 29.6–33.8′ | 31.4–32.4′ |
| 200 million years ago | 22 h 57 min | 382 | 376,300 | 30.0–34.2′ | 31.2–32.3′ |
| 385 million years ago | 21 h 48 min | 402 | 367,700 | 30.7–35.0′ | 31.0–32.1′ |
| 635 million years ago | 20 h 27 min | 429 | 356,500 | 31.7–36.1′ | 30.8–31.8′ |
| 1 billion years ago | 19 h 29 min | 450 | 347,500 | 32.5–37.1′ | 30.4–31.4′ |
| 1.4 billion years ago | 18 h 39 min | 470 | 339,200 | 33.3–38.0′ | 30.0–31.1′ |
| 2.46 billion years ago | 16 h 59 min | 516 | 320,500 | 35.2–40.2′ | 29.1–30.1′ |
How fast it leaves
How do we know it is leaving now?
Three Apollo missions and the two Soviet Lunokhod rovers left special mirrors on the Moon: sets of corner-cube reflectors, which send light straight back the way it came. Observatories on Earth fire short laser pulses at them and time the round trip.
A laser pulse leaves Earth, hits the reflector and comes back.
At the Moon's mean distance, light takes 2.56 seconds to make the trip; from the nearest point of its orbit to the farthest, between 2.38 and 2.71 seconds. The newest reflector reached the Moon in March 2025 aboard Firefly's Blue Ghost lander, and its first measurement gave 358,727.670 km, with a statistical uncertainty of 0.8 mm.
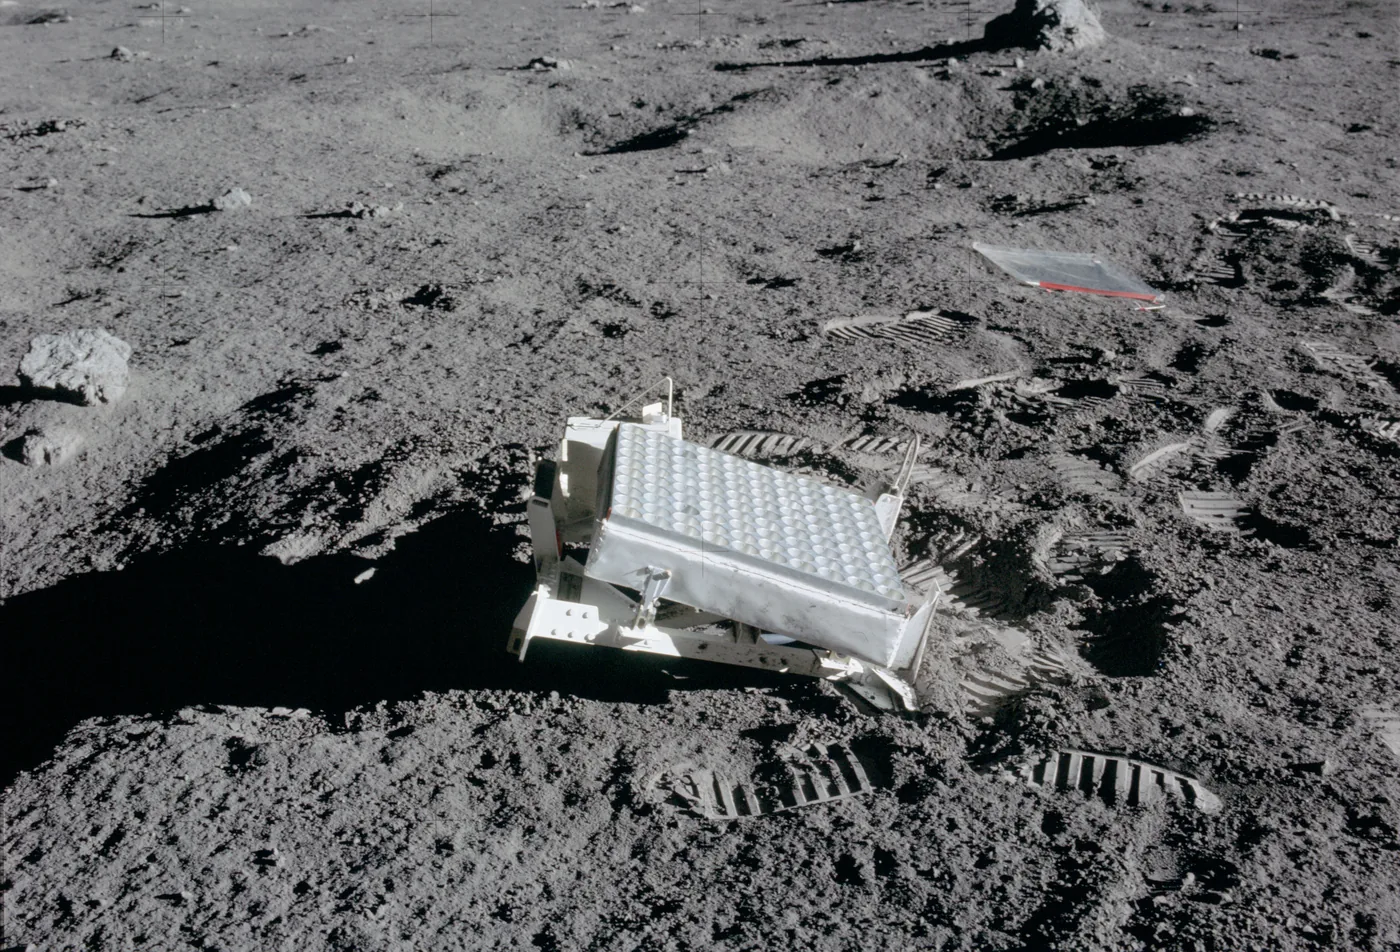
Decades of such measurements show the average distance growing by 38.30 ± 0.08 millimetres a year. A separate solution by the JPL team gets 38.08 ± 0.04 and warns that converting the raw data to this rate may hide an error of up to 0.5%, about 0.2 millimetres a year. That leaves no room for large doubt, and none for extra decimals.
The motion is not even. The nearest point of the orbit recedes by 30.4 mm a year, the farthest by 46.2 mm a year: the orbit is stretching.
Earth spins faster than the Moon circles it. The tidal bulge the Moon raises in the oceans is carried forward by Earth's rotation, so it pulls the Moon along the way it is already moving. The Moon gains orbital energy and climbs to a wider orbit, while Earth spins ever slower. In a simplified picture, one effect, the main lunar tide, accounts for 81% of the measured recession.
How do we know it was closer?
Nobody measured the Moon 400 million years ago. But some animals and some sediments kept a calendar. A well-preserved fossil coral can show one growth line a day, so a year is a set of lines. Tidal mud records the fortnightly cycle of the tides. Count the lines and you learn how many days made a year.
Middle Devonian corals
Wells, 1963
Corals from New York and Ontario, about 383–393 million years old, show around 400 lines a year, with extremes of 385 and 410. Wells gave no error, and Scrutton, quoted by Williams, warns that such counts should be treated as approximations.
Tidal layers of the Elatina Formation
Williams, 2000
Layers of sand and mud laid down by tides in South Australia, read from drill cores: 400 ± 7 days a year, 13.1 ± 0.1 synodic months a year and a day of 21.9 ± 0.4 hours, about 635 million years ago (Williams wrote "about 620"). The model gives 428 days, not 400. Another reading of the same rocks, by Sonett and Chan, gives a 20.56-hour day, close to the model; Williams rejects it as unwarranted because the raw data they used are corrupted. The rocks alone do not settle it.
A Cretaceous rudist shell
de Winter and colleagues, 2020
A single specimen from Oman, late Campanian (at least 72 million years old), with 372 laminae a year and an uncertainty of 8.4 days, which makes a day of 23 hours 31 minutes. One specimen, nine growth years, three methods combined.
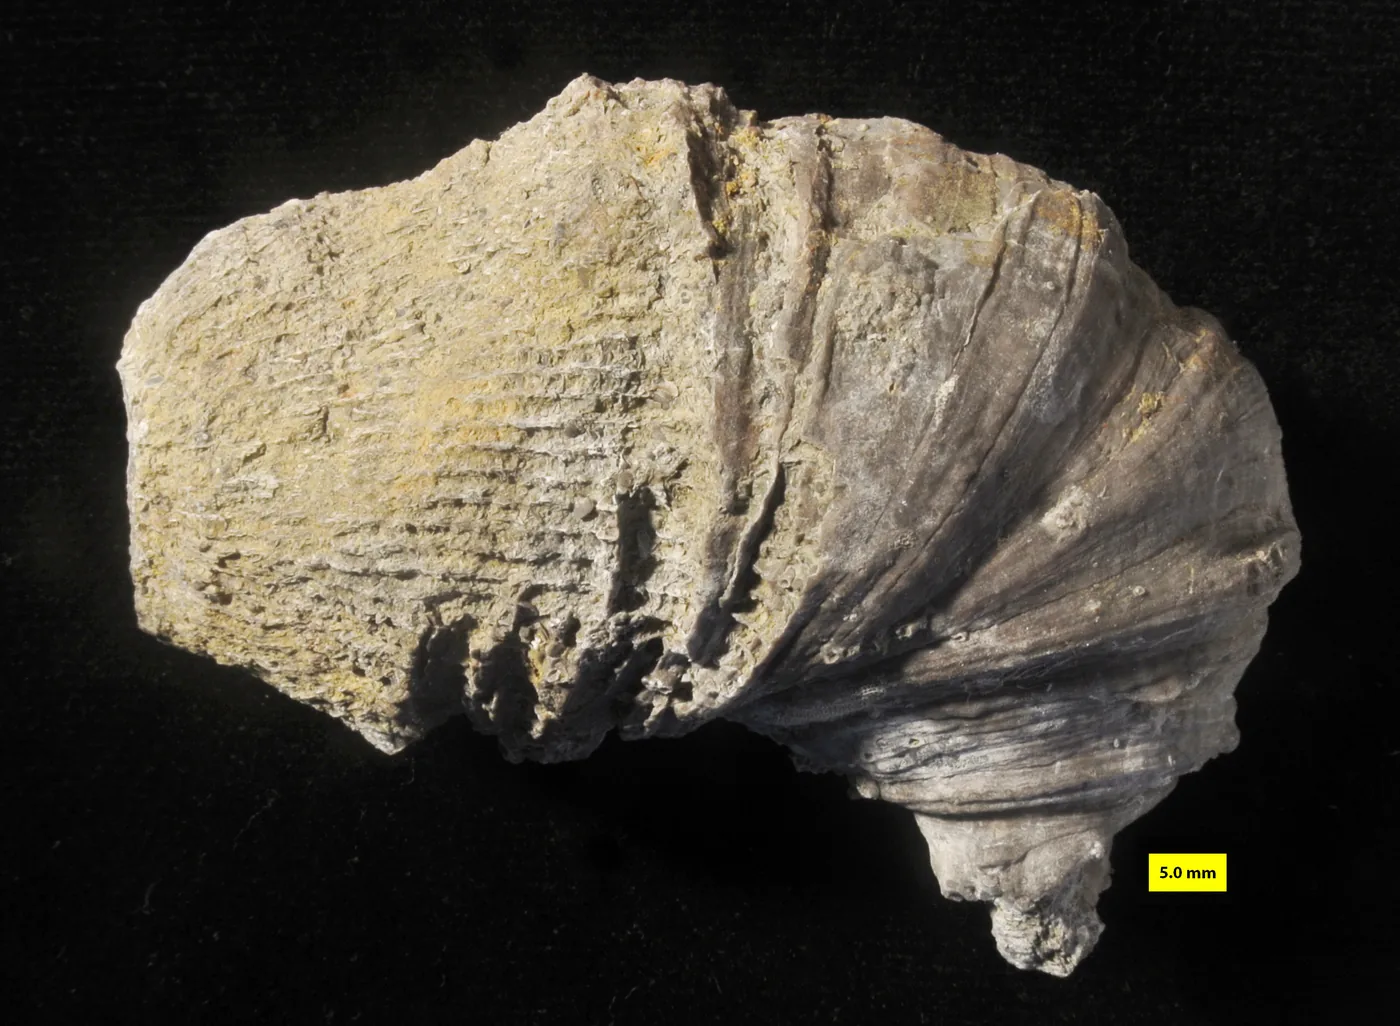
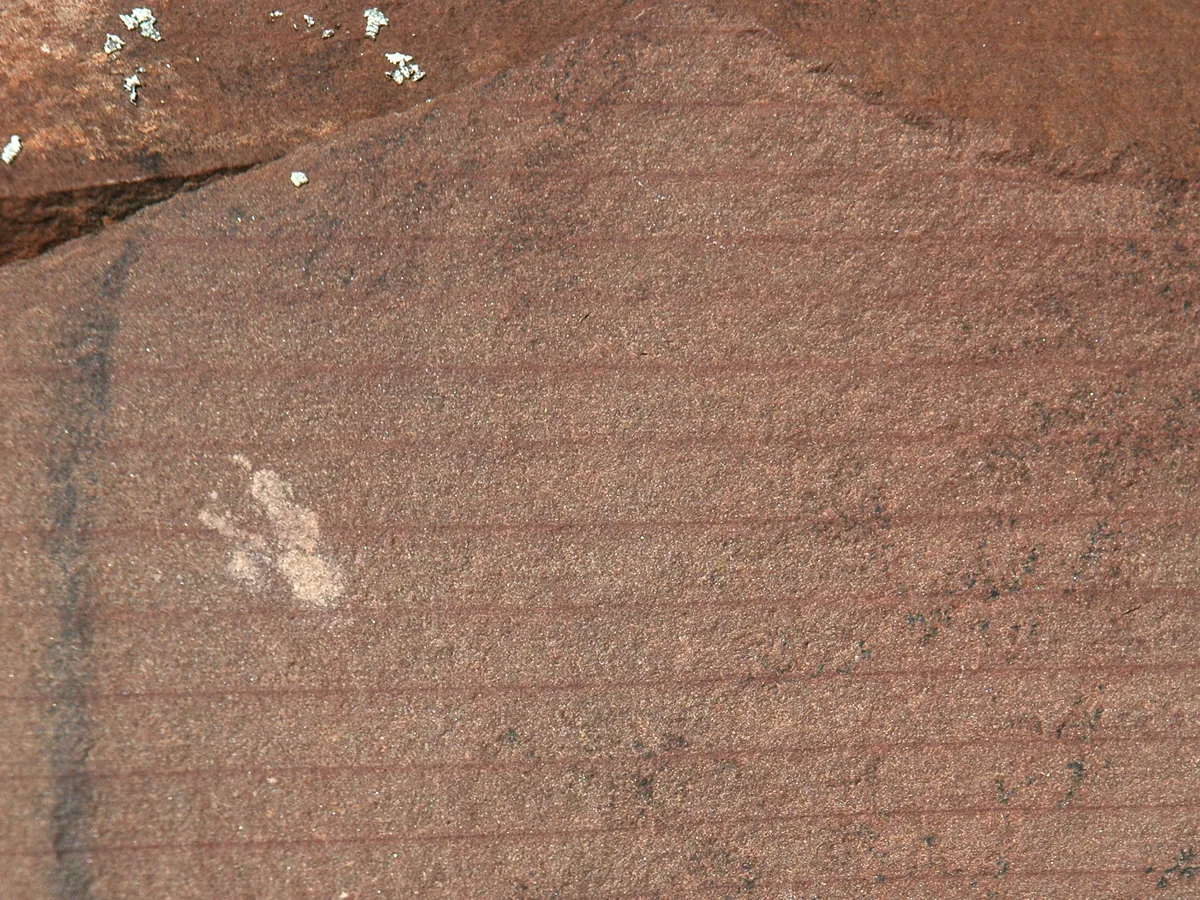
Further back in time, the numbers are read from Milankovitch cycles preserved in rock. In a banded iron formation in Australia, 2.46 billion years old, Lantink and colleagues read a Moon at 321,800 ± 6,500 km and a day of 16.9 ± 0.2 hours. And Huang and colleagues show that the day did not lengthen smoothly: between 650 and 280 million years ago it rose in steps, with a pause between 500 and 350 million, by about 2.2 hours in all.
Why can't we wind the clock back in a straight line?
The two easiest calculations give impossible answers.
- published model and its range
- constant rate: 215,000 km at 4.4 billion years
- constant friction: zero at 1.5 billion years
- the Moon's age, about 4.4 billion years
Constant rate. If the Moon had always receded at 3.83 cm a year, it would take about 10 billion years to go from zero to today's distance. Even 4.43 billion years ago, the Moon's age, it would still have been about 215,000 km away. Yet models of its formation put it much closer to Earth.
Constant friction. In a simple tidal model that keeps the braking strength at today's level, the force grows as the Moon comes closer, and the Moon would have touched Earth about 1.5 billion years ago. But the Moon is about 4.4 billion years old (4.425 ± 0.025).
The way out is a model in which the oceans' shapes and resonances change with the continents. Today's rate looks unusually high: Williams found that, averaged since the Elatina rocks formed (about 620 million years ago, in his dating), it was only 57% of today's. The curve above, published by Farhat and colleagues in 2022, has sudden steps at resonances precisely because the rate changes. It is fitted only to today's rate and the Moon's age, not to any fossil.
The curve is a model. Another published model, by Daher and colleagues in 2021, puts the Moon at 44.0–49.6 Earth radii 4.5 billion years ago, much farther out than its formation requires. That is why every number below carries a label: measured, counted or calculated.
When will the last total solar eclipse be?
Right now the Moon and the Sun look almost equally big in the sky. The Moon spans between 33.5′ at its nearest point and 29.4′ at its farthest, the Sun between 31.45′ and 32.5′. That is why both kinds of eclipse occur: in NASA's catalogue for 2000 BCE to 3000 CE, of the central eclipses 51.4% are annular, 41.2% total and 7.4% hybrid. Annular ones already outnumber total ones.
Every year adds a little. To lose the last total eclipse, the Moon has to move another 23,500 km beyond its closest approach today, counted from Earth's centre, or 29,800 km as seen from the spot on Earth directly beneath it. Pick a rate: whatever you assume, that is how long it takes.
Last possible total eclipse, in
Sun at today's size
Sun growing, as in the standard solar model
The first value is counted from Earth's centre, the second as seen from the spot beneath the Moon.
Published estimates differ for the same reason. Meeus, quoted in Eos, puts the first losses at about 620 million years from now and the last total eclipse at about 1.2 billion, from the same distance of about 23,000 km. Choose Williams's average since Elatina and the same geometry gives 1.1 to 1.4 billion. The Sun grows too: in the standard solar model it is 4.7% wider in 1.2 billion years, which brings the date forward. The result shows both cases. The rate will not stay constant for a billion years, so the results are arithmetic on assumptions, not forecasts.
Nobody will notice the change. At 3.83 cm a year, the Moon moves 3.8 metres farther in a century.
What people say, and what holds
The Moon moves away about as fast as your fingernails grow.
Holds, roughly.
38.3 mm a year against 41.6 mm a year: 92%. The fingernail number comes from one study of 22 adults, so the comparison is approximate.
Wind the clock back at today's rate and the Moon touches Earth 1.5 billion years ago.
Does not hold.
At a constant rate the sum gives about 10 billion years. The 1.5 billion appears only if you hold the tidal friction constant. Either assumption contradicts what we know about the Moon.
Total eclipses will end in 600 million years.
Does not hold as an end date.
About 600 million years is what today's rate gives if it continued. Meeus, quoted in Eos, calls it the start of the losses and puts the last total eclipse at about 1.2 billion, close to what the same geometry gives at Williams's slower rate. A growing Sun would bring either date forward.
Fossil corals show that the Devonian year had 400 days.
Holds, with reservations.
Wells counted about 400 lines a year, between 385 and 410, and gave no error. Fossil counts are approximate and, as Williams notes, may be biased toward the expected result, but rocks, shells and sediment cycles point the same way.
Sources and method
Distance, day length and days in a year on the chart come from the Farhat et al. 2022 model; days in a year is 8,766 hours divided by the length of day, for a year of 365.25 days. The points are those published by the cited authors. The model's mean distance today is 383,598 km and the textbook mean distance is 384,400 km; the page uses each where it applies.
Apparent sizes come from the Moon's radius (1,737.4 km), the Sun's radius (695,700 km) and the extreme distances of the Moon (356,375 and 406,720 km, kept as proportions of its mean distance when the sky is drawn for the past) and of Earth from the Sun. The Sun's radius in the past and future is that of the standard solar model of Bahcall, Pinsonneault and Basu (2001), interpolated linearly. The eclipse arithmetic applies the chosen rate directly to the Moon's closest approach. Estimates for the future are arithmetic on stated assumptions, not forecasts.
- Williams & Boggs 2016, Celestial Mechanics and Dynamical Astronomy 126:89 doi.org
- Williams, Boggs & Ratcliff 2016, Lunar and Planetary Science Conference, abstract 1096 hou.usra.edu
- Dickey et al. 1994, Science 265:482 doi.org
- Folkner et al. 2014, JPL Interplanetary Network Progress Report 42-196 ipnpr.jpl.nasa.gov
- Murphy et al. 2011, Icarus 211:1103 (Lunokhod 1 reflector found again) arxiv.org
- University of Maryland, first ranging of the NGLR-1 reflector, March 2025 physics.umd.edu
- Wells 1963, Nature 197:948 doi.org
- Williams 2000, Reviews of Geophysics 38:37 doi.org
- de Winter et al. 2020, Paleoceanography and Paleoclimatology 35:e2019PA003723 doi.org
- Lantink et al. 2022, PNAS 119:e2117146119 doi.org
- Huang, Ma, Laskar & Sinnesael 2024, PNAS 121:e2317051121 doi.org
- Farhat, Auclair-Desrotour, Boué & Laskar 2022, Astronomy & Astrophysics 665:L1 (tidal history model and data) doi.org
- Bahcall, Pinsonneault & Basu 2001, Astrophysical Journal 555:990 (solar radius through time) arxiv.org
- Daher et al. 2021, Journal of Geophysical Research: Planets 126:e2021JE006875 doi.org
- Meeus 2002, More Mathematical Astronomy Morsels, as quoted in Eos, 26 March 2024 eos.org
- Espenak & Meeus, NASA Five Millennium Canon of Solar Eclipses eclipse.gsfc.nasa.gov
- Yaemsiri et al. 2010, Journal of the European Academy of Dermatology and Venereology 24:420 (nail growth) doi.org