In short
How many Romanian localities have no sewerage?
In 2025, 1,696 of Romania's 3,181 localities appear in the INS statistics with a public sewerage network. That leaves 1,485 without reported sewerage. Of those with a public water network, 1,065 still have no sewerage.
The map below lets you search any commune or town and see when water, sewerage, gas and district heating first appear in the statistics.
The explorer
Your locality's timeline
Search for a locality or tap it on the map. The panel on the right shows, for each of the four networks, the first year it appears in the statistics and how it has grown since. The year control under the map replays the country from 1990 onwards, and the buttons above it change what the map colours.
Colours show which network a locality has in the chosen year, as reported in the institute's annual series. A coloured locality has pipes on its territory; how many households are connected to them is a separate question.
The layers
Water came first, sewerage came later
In 1990, of today's 3,181 localities, 1,349 had a drinking-water network, 520 had sewerage and 311 had gas pipes. All 103 cities had water and sewerage, but only 74 also had gas. Of the 2,627 communes of the time, 1,037 had a water network, 223 had sewerage, 148 had gas and 1,522 had none of the three. By 2025 water reaches 2,740 localities, sewerage 1,696 and gas 1,006. The three lines climbed at different speeds and at different moments.
Water had its wave in the 2000s: in 2004 alone 121 new localities appear in the series with a water network, the most in any single year, and between 2004 and 2010 another 506 join. Sewerage waited. In the two decades from 1991 to 2010, 372 new localities appear with sewerage; in the fifteen years after 2010, 915 do. The year of EU accession, 2007, sits right on the boundary between the two waves. The accession treaty gave Romania until the end of 2018 to collect and treat waste water in every settlement above 2,000 population equivalents; the deadline passed, an infringement procedure is under way, and networks keep appearing at the fastest pace in the whole series.
Gas follows a different logic, that of gas fields and trunk pipelines: 311 localities had it in 1990, almost three in five of them in just eight counties, Mureș, Sibiu, Alba, Cluj and Brașov in Transylvania, Prahova, Dâmbovița and Argeș in Wallachia, and 1,006 have it in 2025. Even so, 64 of the country's 319 towns and cities have no gas pipes in 2025, among them Borșa, with 28,653 residents, Băilești, Vicovu de Sus, Cernavodă and Calafat.
The sanitation gap
How long it takes from the tap to the sewer
For localities where both water and sewerage appear in the series after 1990, the distance between them can be measured. There are 679 such localities that already existed in 1992. In 188 of them the two networks appear in the same year. In 473 the sewer comes later, at a median distance of 11 years. In 277 localities the gap exceeds ten years, and in 85 it exceeds twenty.
The record belongs to , a commune of 1,181 people on the Timiș plain: water appears in the statistics in 1992, sewerage in 2025. Luciu (Buzău), Livada (Arad) and Hoghilag (Sibiu) waited 32 years. Larger still is the group that is still waiting: 891 localities existing in 1992 have a water network in 2025 and no sewerage, and 322 of them have had water since before 1990, that is, for at least 35 years. The most populous is , a town in Suceava county with 17,842 residents and a water network since 1990.
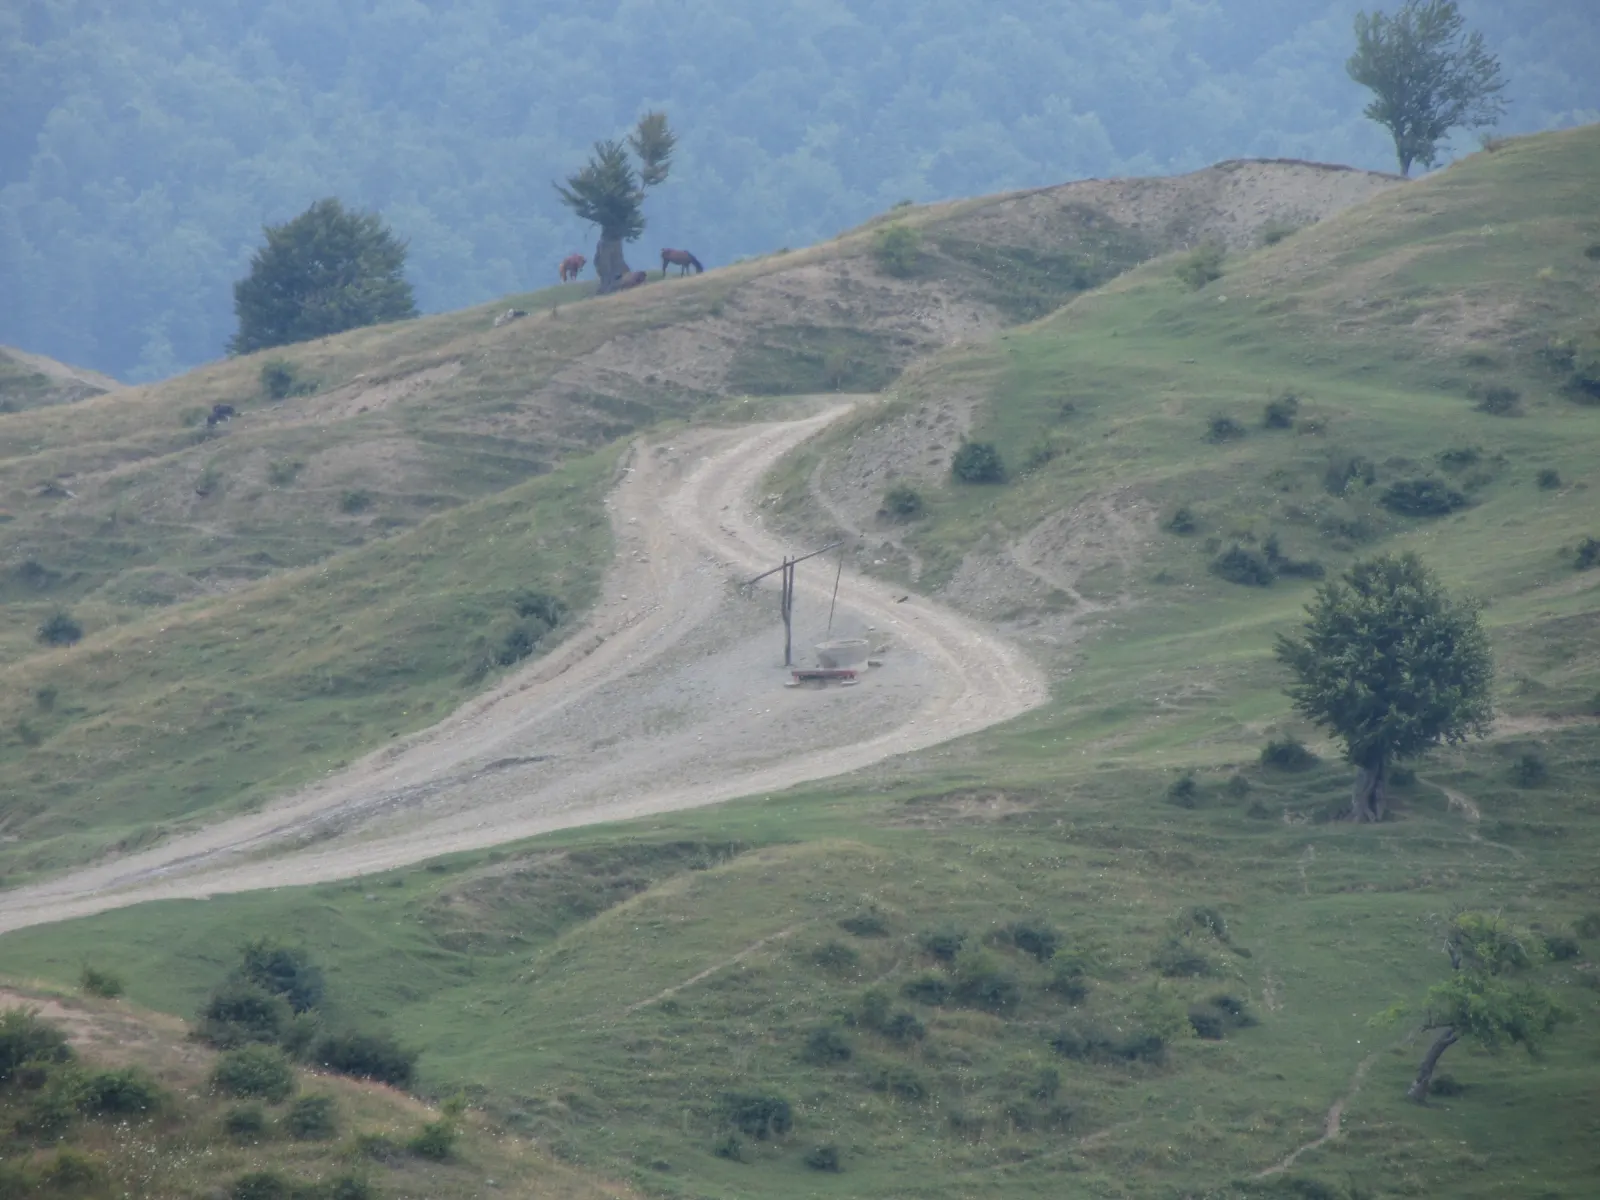
Romania with water but no sewer
A country that grew until 2010 and is only now shrinking
If water comes before sewerage, then every wave of water pipes creates, for a while, localities with a tap and no drain. Their number rose from 846 in 1990 to 1,465 in 2010, when two out of three localities with a water network had no sewerage. It has fallen every year since, to 1,065 in 2025. The sewerage wave after 2010 was, in good part, the repayment of this debt.
Counted in people, on the basis of the registered population, 2.96 million Romanians live in 2025 in a locality that has a water network but no sewerage, 13.7% of the population. In 2010 the share was 21.6%. Another 1.26 million, 5.8%, live in a locality with no water network at all; in 1992 it was one in four. The counties with the most localities without piped water are Suceava (40), Dolj (33), Teleorman (33), Botoșani (27) and Giurgiu (27).
Among towns, four have no sewerage in 2025: Vicovu de Sus, Milișăuți and Miercurea Sibiului never had it in the series, and , in Dâmbovița county, had it in 1990 and drops out of the statistics after 2004. Three towns have no water network either: Miercurea Sibiului, Milișăuți and Cajvana, a town of 10,577 people in Suceava county that reports a water network up to 2003 and not after.
The year of completion
When your locality joined the Romania with water, sewerage and gas
For each locality one can find the first year in which all three basic networks are present at the same time in the statistics. For 187 localities, mostly towns and cities, that year is 1990 or earlier: they already had them when the series begins. Another 551 localities existing in 1992 completed the set between 1991 and 2025, more than two thirds of them, 381, after accession in 2007. In 2025 there are 736 localities with all three, and 2,445 without, most of them because sewerage or gas is missing.
The year of completion is the year of first appearance in the statistics; the inauguration may be far older. Networks that existed in 1990 may be far older, and a commune created in 2004 enters the series only from 2004, even if its villages had water from the parent commune. Each locality's panel says so where it applies.
The layer that left
How district heating died
In 1993, the first year with locality-level data, 330 towns and communes received heat through a public network, 36.3 million gigacalories in all. In 2025 there are 56 localities and 5.7 million gigacalories, 84% less. Of the 382 localities that ever appear in the series with heat distributed, 326 have dropped out of it: 107 by 2000, another 110 by 2005, the rest in a trickle that has not stopped even after 2020. Seven communes still have district heating in 2025, among them Tașca and Alexandru cel Bun in Neamț county and Lovrin in Timiș.
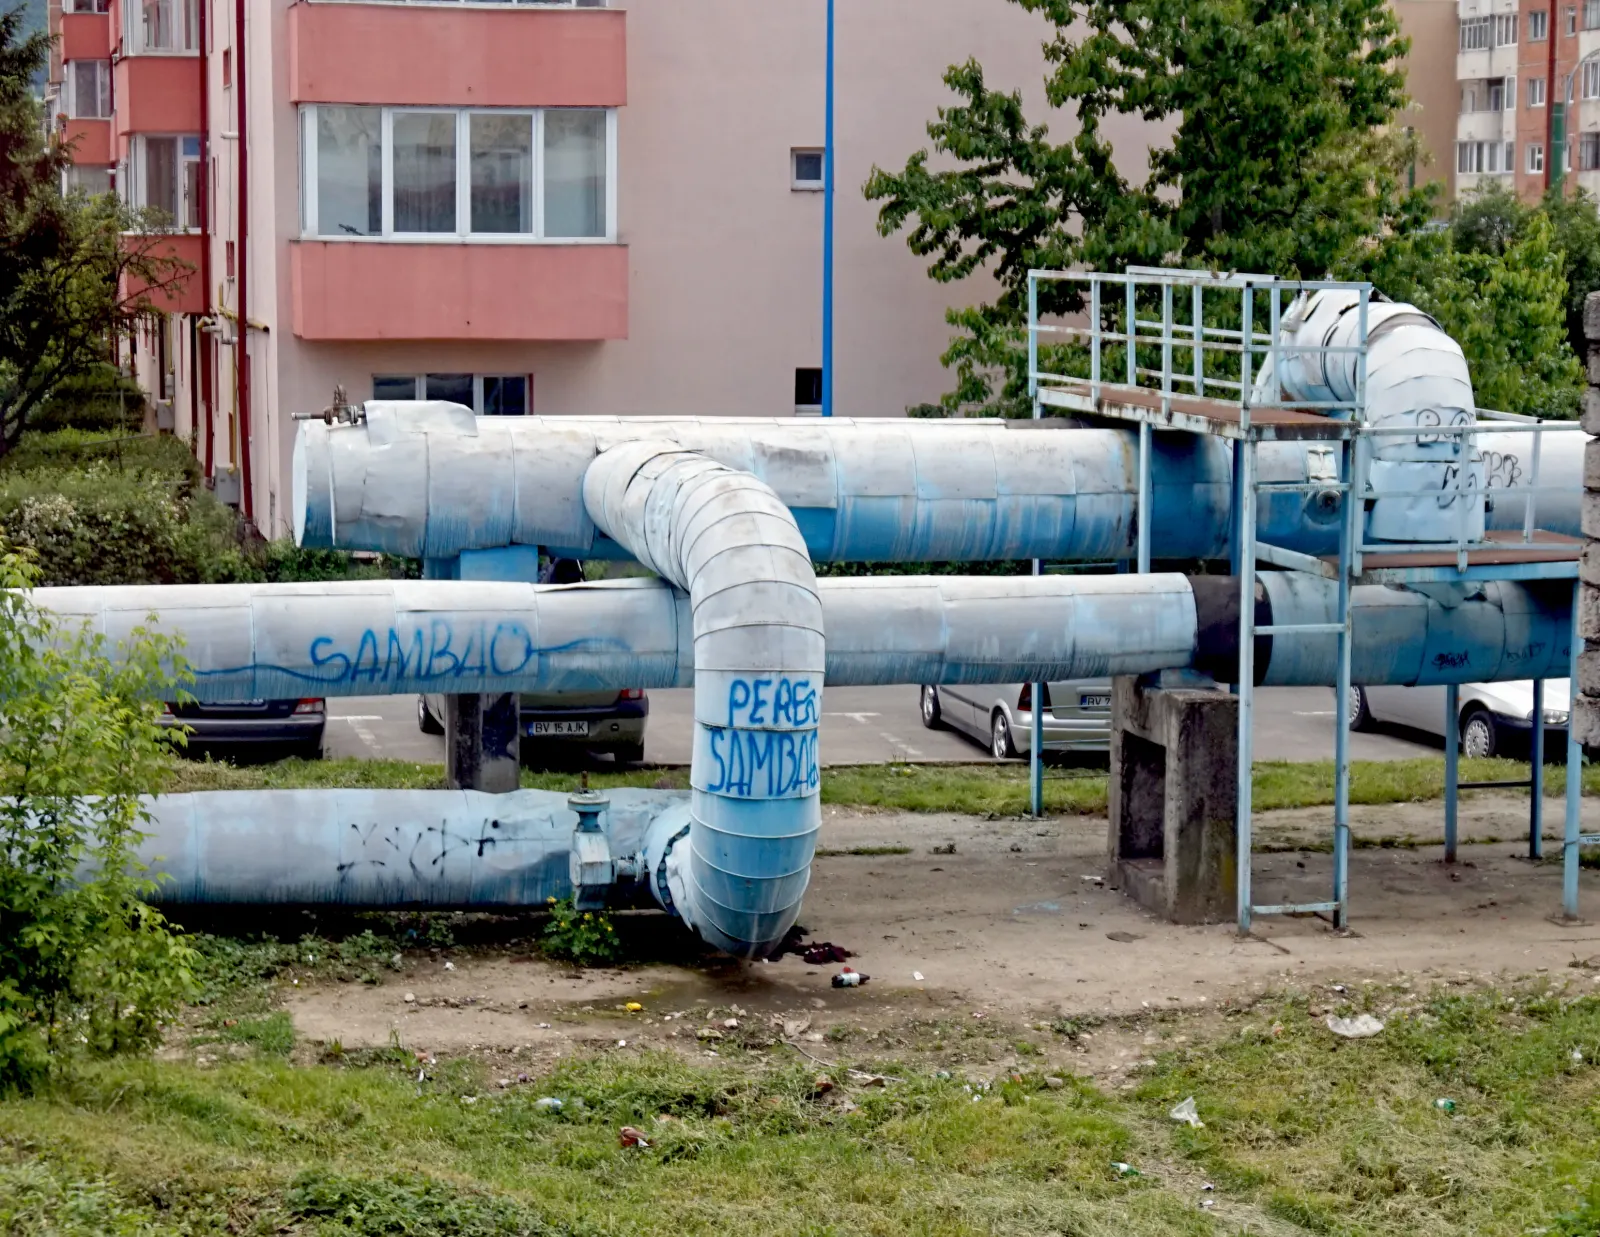
Surviving in the series is not the same as being healthy. Of the 56 systems left, 20 deliver less than a tenth of their peak in 2025: fell from 1.17 million gigacalories to 26,572, from 1.08 million to 12,882, Sfântu Gheorghe from 662,000 to about 3,000, Baia Mare from 653,000 to about 2,000. Bucharest, which delivered 9.55 million gigacalories in 1997, still delivers 2.64 million, but that now amounts to 46.5% of everything distributed in the country. The exceptions are few and each has a local explanation: Oradea peaked in 2005 and keeps a third of that, Ploiești peaked only in 2013, and Cernavodă distributes almost as much in 2025 as in its peak year, 2021.
Dropping out of the series means the locality no longer reports heat distributed; the pipes may stay in the ground for years afterwards. 53 localities have gaps in their reporting, with missing years between years with values, and for 45 of them the series ends before 2025 anyway. A few return after a pause, like Tașca in Neamț county, absent in 2001 and present without interruption afterwards; the data cannot tell a restart from a missing report.
One more layer
The paved streets of the towns
For the 319 towns and cities, the institute also reports the length of streets and the length of those that are paved, with asphalt, concrete or cobblestone. In 1990, 12,082 of 21,065 kilometres of urban streets were paved, 57.4%. In 2025 it is 24,554 of 32,465, 75.6%. The median town went from 55.6% to 78.0%. In , where the panel above starts, the share rose from 49.0% to 72.6%. Each town's panel shows both figures.
Method
Where the figures come from and what they do not say
All data come from the National Statistics Institute's TEMPO-Online database, chapter “Public utilities of local interest”, the matrices by county and locality: GOS106B (length of the simple drinking-water distribution network), GOS110A (length of sewer pipes), GOS116A (length of gas distribution pipes), GOS109A (heat distributed), GOS104A and GOS105A (length of urban streets and of paved streets). The matrices were last updated on 27 August 2026 and cover 1990–2025, or 1993–2025 for heat.
- What “has a network” means. The institute records a value for a locality and a year only if pipes of that network exist on its territory. A missing value is the only signal of absence: these matrices contain no zeros and no cells flagged as missing. A coloured locality on the map has a network on its territory, which says nothing about how many households are connected.
- First year in the series. “Appears in 2004” means 2004 is the first year with a value in the statistics, whatever the year of inauguration. For networks present from 1990 the year of inauguration may be decades earlier, which is why they are labelled “before 1990”. The water-to-sewer gap and the year of completion are computed only for localities where the relevant networks appear after 1990.
- Communes created after 2000. 235 of today's localities have no registered population on 1 January 1992 in the institute's records, a sign that they were created later, most between 2003 and 2006. Their series start when they did, so the year a network “appears” may simply be the year of creation. They are excluded from the gap and completion calculations and carry a note on their panel.
- Dropping out of the series. When a locality has no value after a given year, the text says it is absent from the series; the data say nothing about the physical fate of the network. 276 localities have gaps in the water series, 150 in sewerage and 53 in heat; the map shows each year's presence as reported.
- Checks. The number of localities with each network, computed from the locality matrices, matches the counts the institute publishes in the summary matrices GOS106C and GOS110C for 2010, 2020 and 2025 (2,252, 2,605 and 2,740 for water; 1,696 for sewerage in 2025). The locality sums of kilometres and gigacalories match the published national totals in every year. For gas, the locality matrix gives 1,006 localities in 2025 and the summary matrix 1,030; the text uses the locality-matrix figure throughout.
- People. Population shares use the registered (domicile) population on 1 January of the following year (INS POP107D): 21.65 million on 1 January 2026. The registered population is larger than the resident population because it includes people living abroad who kept their Romanian domicile.
- The map. The outlines of the 3,181 administrative units come from geo-spatial.org and ANCPI (CC BY-SA 4.0), matched to the institute's data by SIRUTA code. Bucharest's sectors are merged into a single unit, as the institute reports them.
The data can be downloaded directly from TEMPO-Online, and the accession-treaty deadlines and the state of the infringement procedure are described in the European Commission's 2022 report on the urban waste water directive.