
Soho, London, September 1854
They took the handle off the pump when the cholera was already in retreat
In six weeks, 616 people died of cholera around one street pump. The story goes that Dr John Snow stopped the epidemic by having its handle removed. Snow's own table says otherwise. And the proof came from a clergyman who expected to show that Snow was wrong.
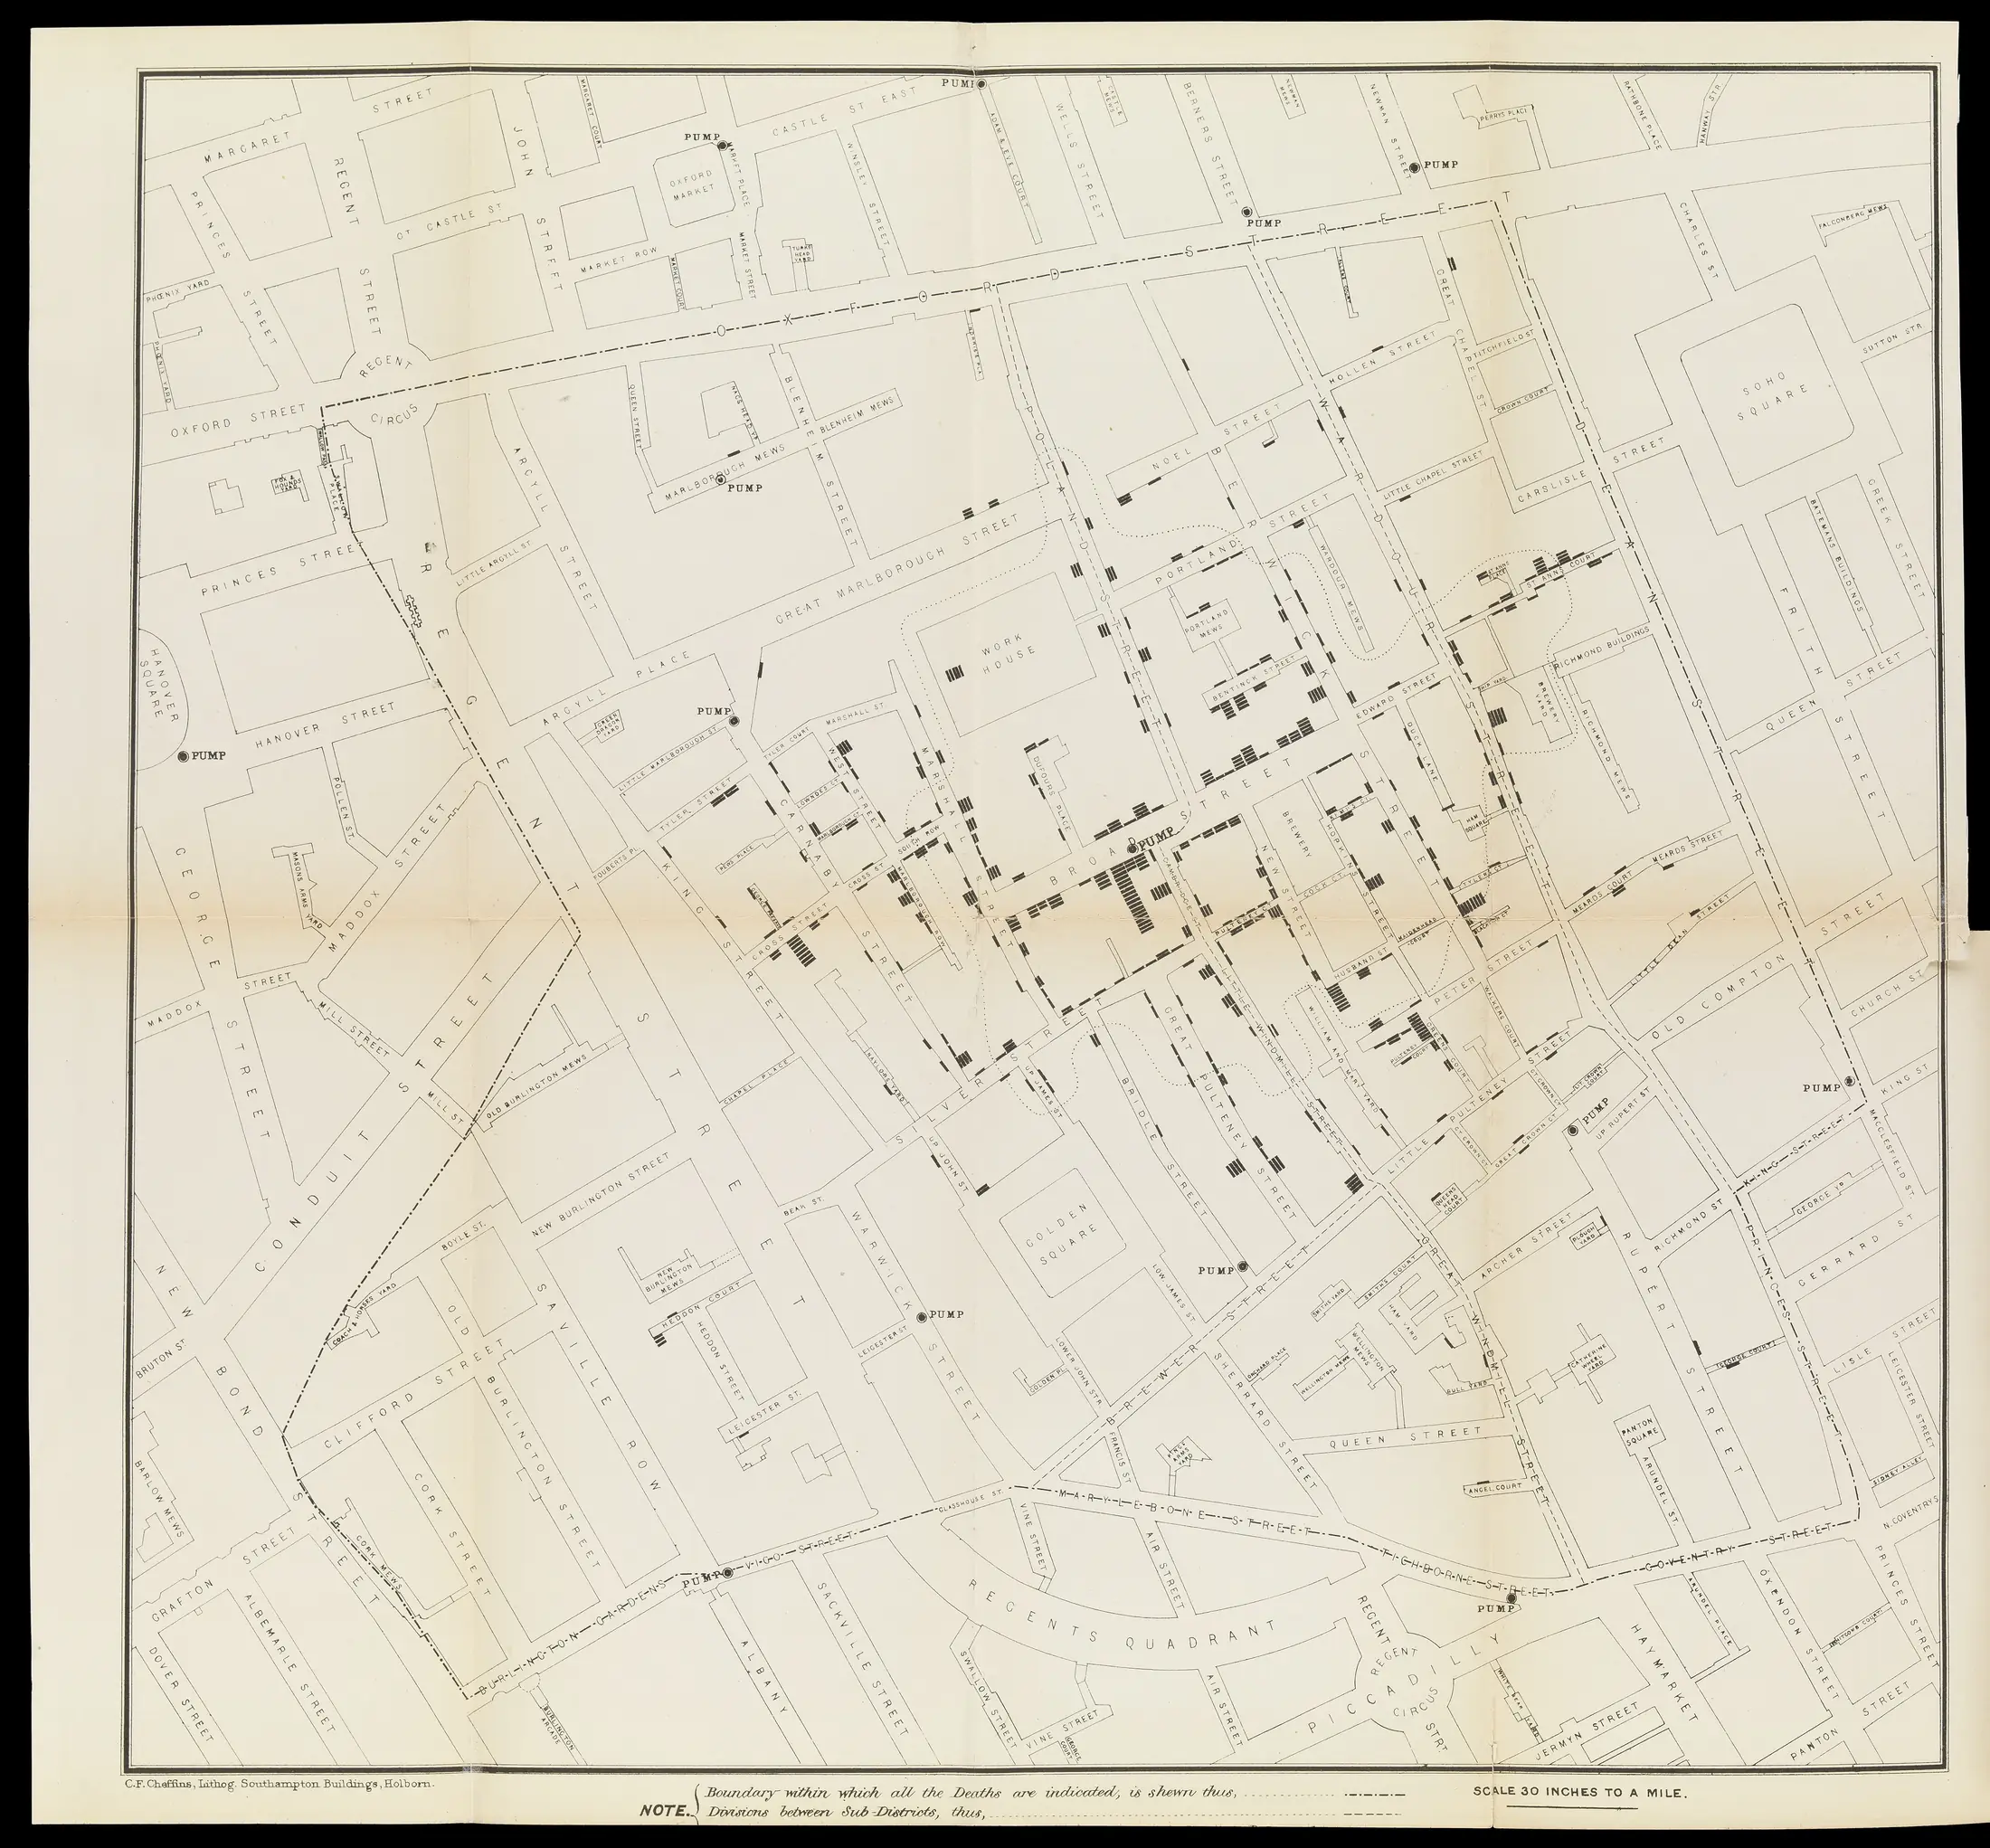
Scroll downJohn Snow, 1854 (lith. C. F. Cheffins) · public domain

What Snow's table shows
Fatal cases had been falling for a week when the handle came off
In his 1855 book Snow printed the count day by day: how many fatal cases began on each day from 19 August to 30 September. The outbreak began in the night between 31 August and 1 September. On 1 September, 143 new fatal cases began. On 8 September, the day the parish Board of Guardians removed the pump's handle at Snow's request, 12 did. Of the 616 cases, 571 have a known starting day; 516 of those had already begun.
516 of 571 dated cases had already begun
Snow's table, day by day
| Day | Fatal cases | Deaths |
|---|---|---|
| 19 August | 1 | 1 |
| 20 August | 1 | 0 |
| 21 August | 1 | 2 |
| 22 August | 0 | 0 |
| 23 August | 1 | 0 |
| 24 August | 1 | 2 |
| 25 August | 0 | 0 |
| 26 August | 1 | 0 |
| 27 August | 1 | 1 |
| 28 August | 1 | 0 |
| 29 August | 1 | 1 |
| 30 August | 8 | 2 |
| 31 August | 56 | 3 |
| 1 September | 143 | 70 |
| 2 September | 116 | 127 |
| 3 September | 54 | 76 |
| 4 September | 46 | 71 |
| 5 September | 36 | 45 |
| 6 September | 20 | 37 |
| 7 September | 28 | 32 |
| 8 September | 12 | 30 |
| 9 September | 11 | 24 |
| 10 September | 5 | 18 |
| 11 September | 5 | 15 |
| 12 September | 1 | 6 |
| 13 September | 3 | 13 |
| 14 September | 0 | 6 |
| 15 September | 1 | 8 |
| 16 September | 4 | 6 |
| 17 September | 2 | 5 |
| 18 September | 3 | 2 |
| 19 September | 0 | 3 |
| 20 September | 0 | 0 |
| 21 September | 2 | 0 |
| 22 September | 1 | 2 |
| 23 September | 1 | 3 |
| 24 September | 1 | 0 |
| 25 September | 1 | 0 |
| 26 September | 1 | 2 |
| 27 September | 1 | 0 |
| 28 September | 0 | 2 |
| 29 September | 0 | 1 |
| 30 September | 0 | 0 |
| date unknown | 45 | 0 |
| Total | 616 | 616 |
Snow himself said so. New attacks had fallen so far, he wrote, that “it is impossible to decide whether the well still contained the cholera poison in an active state”, or whether the water had become free of it. There was also a plainer reason for the fall: people had fled. Within six days the worst-hit streets were “deserted by more than three-quarters of their inhabitants”, and without that flight, Snow believed, the toll would have been much greater.
So the missing handle proved nothing about the water. The evidence came in the months that followed, from Snow's map and from an inquiry in which a local clergyman did the house-to-house work.
The map, December 1854
578 bars, each one a person
Snow drew the map after the epidemic, for the second edition of his book on cholera; the preface is dated 11 December 1854. Every death is a black bar at the house where the person lived. Here the bars sit on the streets of today's Soho; Broad Street is now Broadwick Street.
Rusty Dodson and Waldo Tobler's digitisation of the map counts 578 bars, fewer than the 616 cases in the table. Some people died in hospital or in other parts of London, and the house they came from was not recorded. Snow marked the deaths “as far as I could ascertain them”.
On foot, by the streets
Two in three of the dead lived nearer the Broad Street pump than any other
In 1854, drinking water came by the bucket from pumps in the street. Snow measured distance the way people walked it, along the streets, and on a second map he drew the line of points equally far from the Broad Street pump and its neighbours.
Redone on today's streets for all 13 public pumps on the map, the calculation gives the same picture: 378 of the 578 dead lived nearer, on foot, to the Broad Street pump. Half of them had at most 148 metres to walk to it.
The pump people avoided
Neighbours disliked their own pump and walked to Broad Street
Another 71 of the dead lived nearer the pump at the end of Carnaby Street, which Snow calls “the pump in Marlborough Street” and Whitehead the Little Marlborough Street pump. Snow found out why that mattered: its water “was so impure that many persons avoided using it”, and those who died near it in early September had water from the Broad Street pump.
Broad Street water was sought after. It was served in coffee-shops at dinner time, mixed with spirits in the public houses, and sold in little shops “with a teaspoonful of effervescing powder in it, under the name of sherbet”. Of 48 people who died in houses nearer other pumps, Snow found that 28 had drunk Broad Street water from preference shortly before falling ill.
The workhouse in Poland Street
535 people in the workhouse, five deaths
The parish workhouse was more than three-quarters surrounded by houses where someone had died. Of its 535 inmates, five died of cholera.
It had its own pump-well, besides water from the Grand Junction company, and “the inmates never sent to Broad Street for water”. Had its death rate matched the streets around it, Snow wrote, upwards of a hundred people would have died.
The brewery
The brewery men did not drink the water
A few steps from the pump, Mr Huggins's brewery employed more than 70 men. None suffered from cholera in a severe form; two were “indisposed, and that not seriously”. They were allowed a ration of malt liquor, and Huggins believed “they do not drink water at all”. The brewery had a deep well of its own.
In the same street, at No. 37, a percussion-cap factory kept two tubs “always supplied with water from the pump in the street” for anyone who wanted a drink. Of its roughly 200 workers, 18 died of cholera.
West End, Hampstead
A widow five kilometres away who drank only Broad Street water
Another doctor, Dr Fraser, pointed Snow to an entry in the weekly return of deaths for 9 September: a woman of 59, the widow of a percussion-cap maker, dead of cholera on 2 September at West End, Hampstead. She “had not been in the neighbourhood of Broad Street, for many months”. But she preferred its water, and a cart that went from Broad Street to West End every day brought her a large bottle of it.
The water was taken on Thursday, 31 August. She drank it that evening and on Friday, fell ill on Friday evening and died on Saturday. A niece on a visit drank it too, went home to “a high and healthy part of Islington”, and died. “There was no cholera at the time” in either place. Snow called the two deaths “perhaps the most conclusive of all”.
Try it
How far was the nearest pump?
Pick any street on the map to see the walk to the nearest public pump of 1854, and the distance to Broad Street. The streets are today's; a few courts of 1854 are gone and a few passages are new, so the distances are approximate.
April 1855
The clergyman who expected to disprove Snow found the proof
Henry Whitehead was a Church of England clergyman in the parish, and he visited the sick throughout the outbreak. Of those he saw on 1 September, only one recovered. On the evening of 3 September he drank some of the pump water himself, “cold with brandy”.
When he heard Snow's theory, he told a medical friend that “a careful investigation would refute it”. The parish set up an inquiry committee, and Whitehead went from house to house in Broad Street. What he found changed his mind: of 100 residents of the street who had cholera or diarrhoea, 80 had drunk the pump water. Of 336 who had neither, only 57 had.
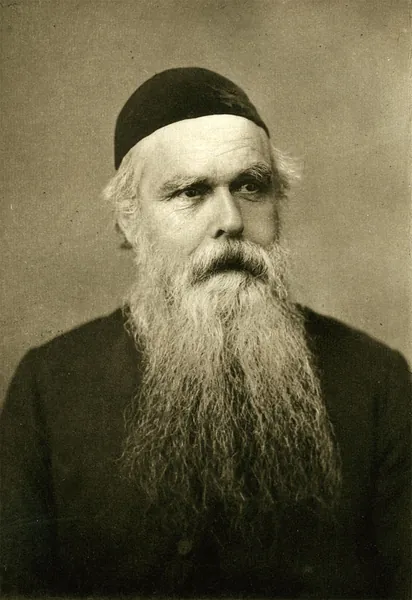

Near the end of the inquiry he came upon a return he had passed over: “At 40, Broad Street, 2nd September, a daughter, aged five months.” The mother told him the child had been taken ill on Monday 28 August, three days before the outbreak. The napkins had been steeped in pails, and the water poured partly “into a cesspool in the front area”, beside the pump's well.
On 23 April 1855 John York, the committee's secretary, opened the cesspool. Its bricks “were easily lifted from their beds without any, the least force”. The wall of the vault beside the cesspool abutted the brickwork of the well, and the house drain ran “only a space of 2 feet 8 inches” from it. The ground between them was “black, saturated, swampy”. The same cesspool had been opened seventeen years earlier “on suspicion of contaminating the well water, and the suspicion proved to be correct”.
The doctor who had attended the child doubted it was cholera, and the committee did not claim the outbreak began with her. It concluded, unanimously, that the outbreak was “in some manner attributable to the use of the impure water of the well in Broad Street”.
1855 and after
The government's health board rejected it
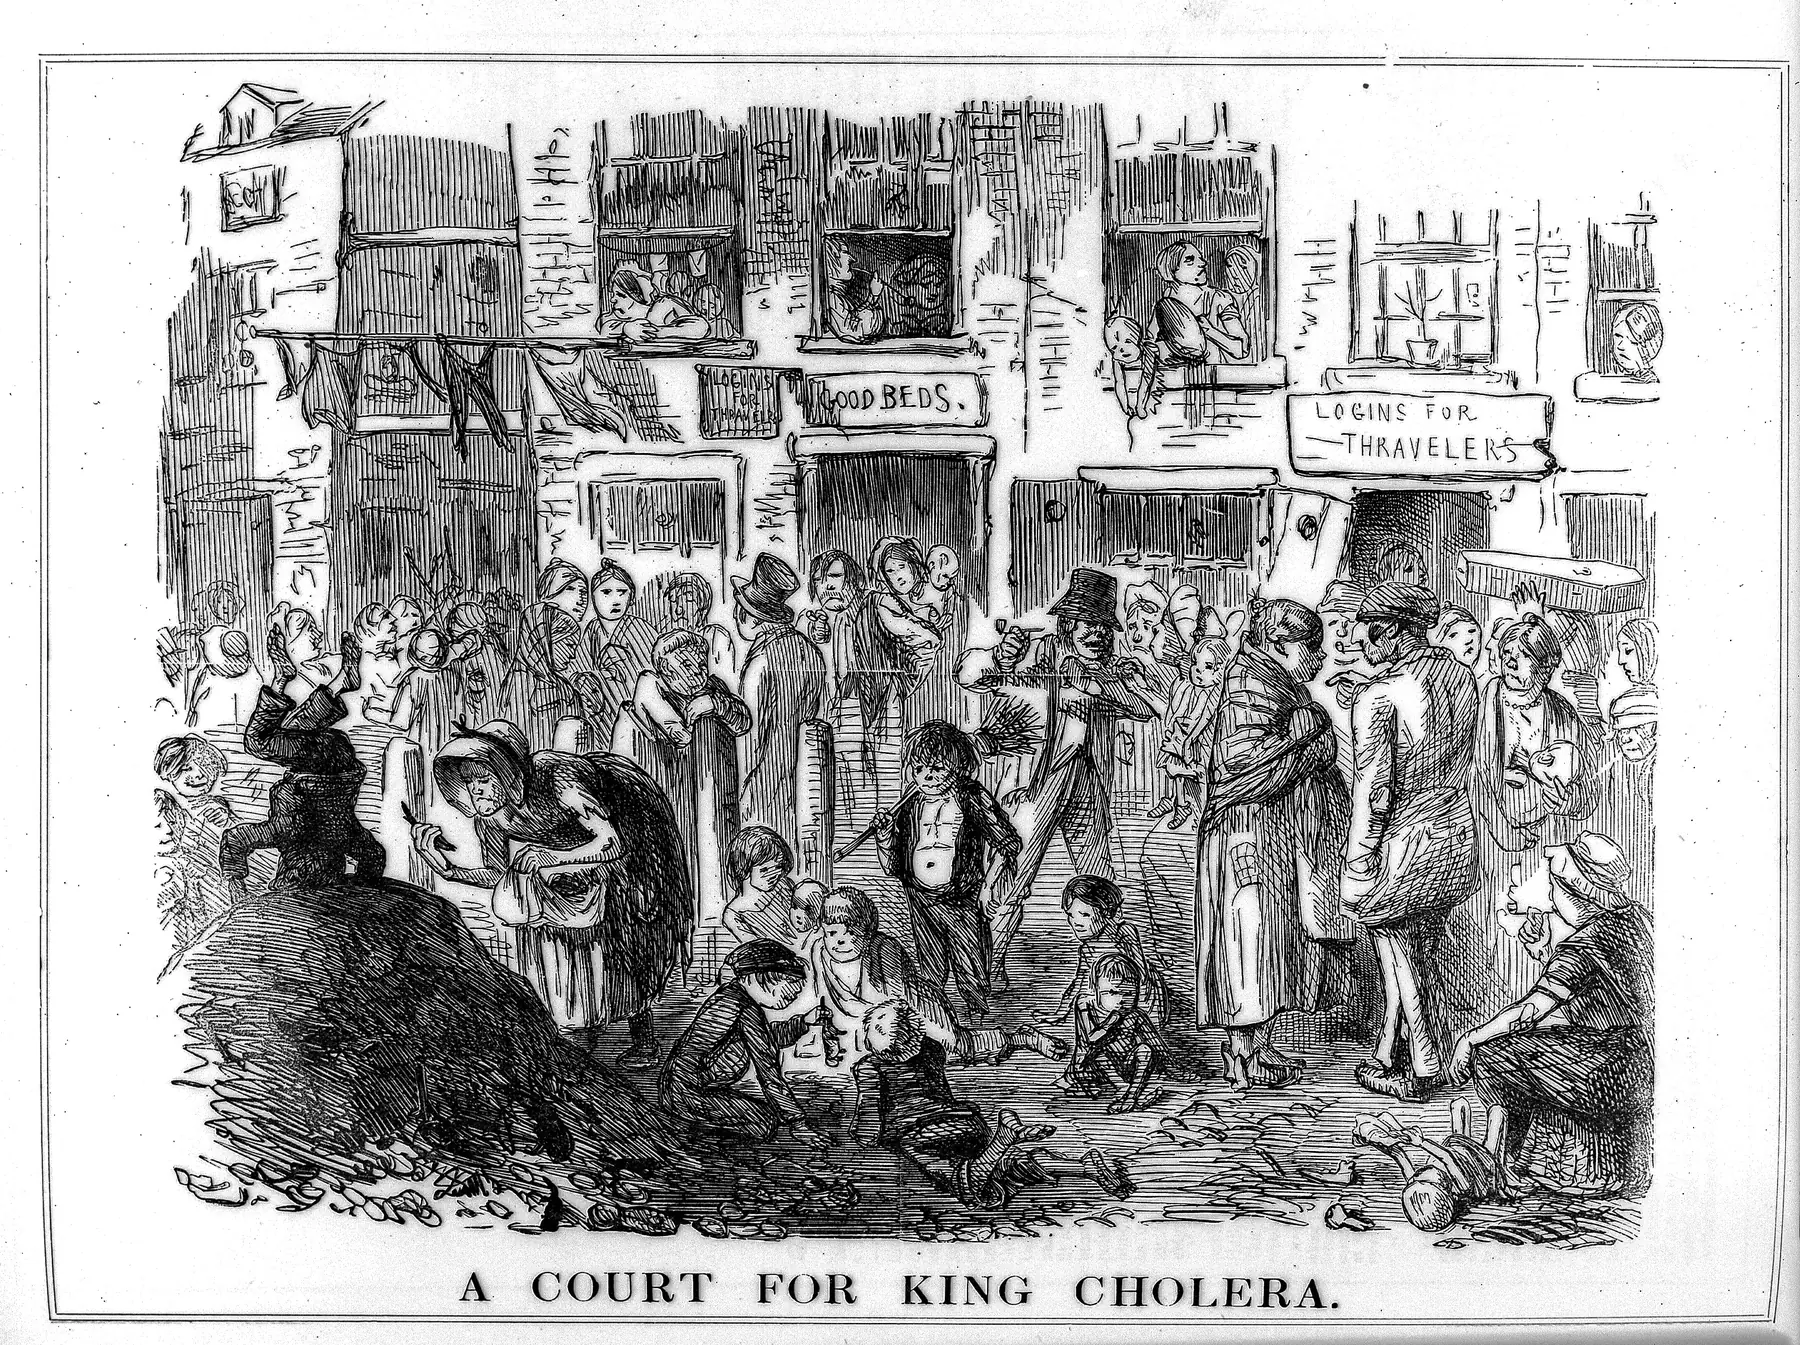
The General Board of Health, the government's public-health authority, investigated the outbreak too. Its verdict, in 1855: “After careful inquiry, we see no reason to adopt this belief.” If the pump water played any part, the report suggested, it was by “having participated in the atmospheric infection of the district”. Cholera was blamed on foul air and filth, as in the cartoon below.
Snow had other evidence, gathered in south London, where two companies piped water into the same streets, one from the dirty Thames in town, the other from upstream. In the first seven weeks of the 1854 epidemic, houses supplied by Southwark & Vauxhall had 315 cholera deaths per 10,000 houses; those supplied by Lambeth had 37. Snow died in June 1858. William Farr, the statistician at the General Register Office, came round to the water explanation only after the epidemic in east London in 1866.

Broadwick Street, today
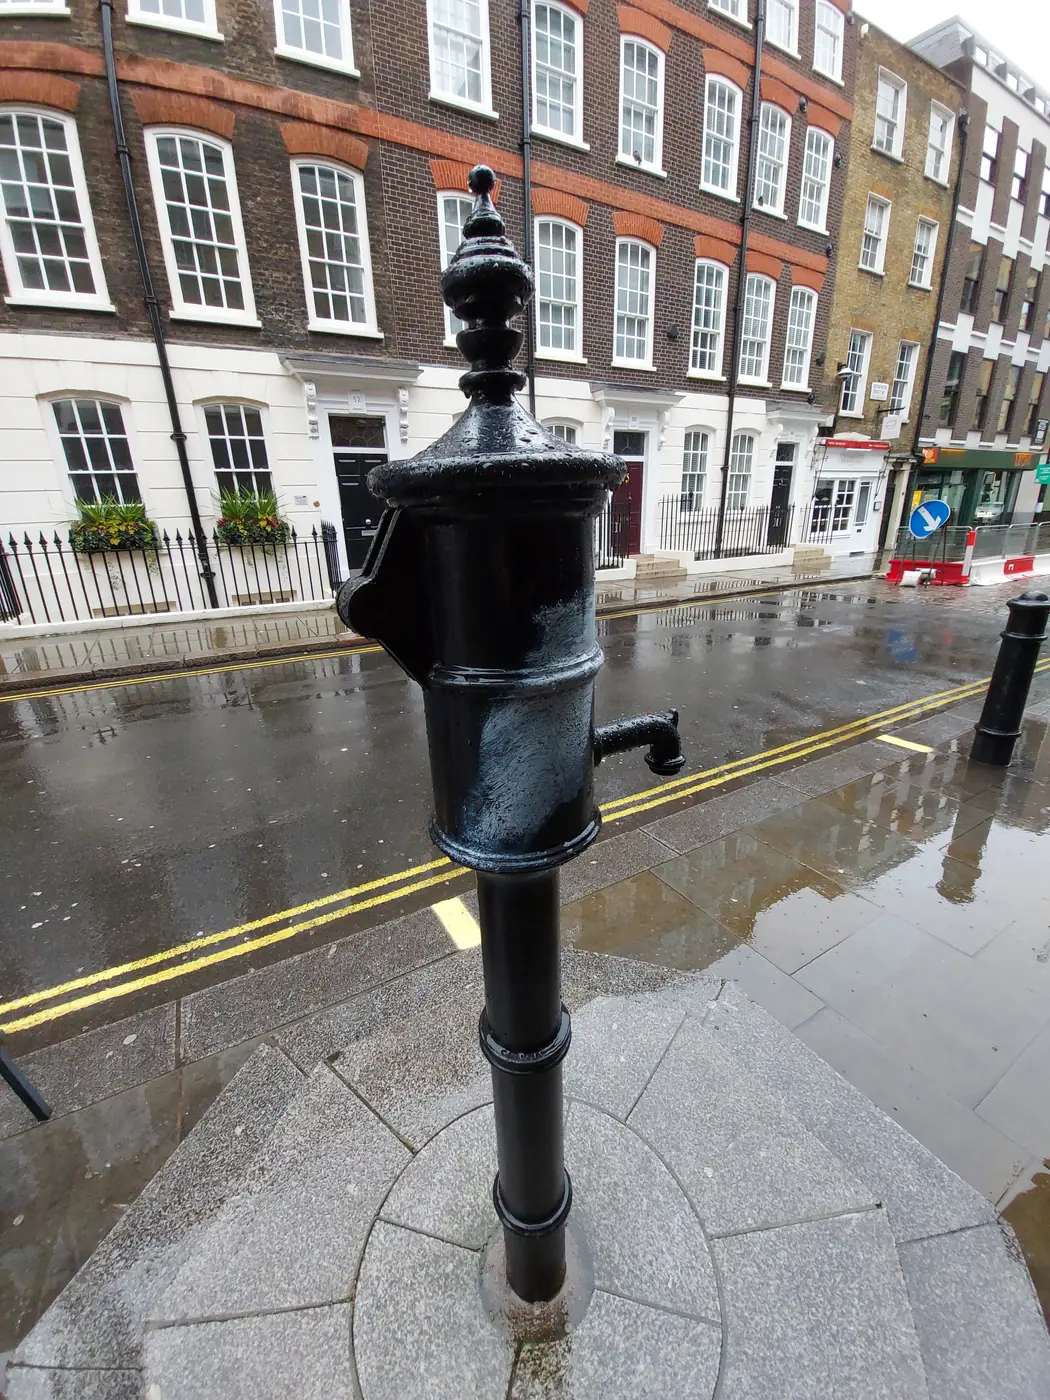
Today's pump has no handle
Since July 2018 a replica of the pump has stood on the right spot, beside the pink granite kerbstone that marks where the original stood, at the corner of Lexington Street, formerly Cambridge Street. The replica is, on purpose, without a handle. Next to it is a pub named the John Snow, formerly the Newcastle-upon-Tyne.
The 1855 reports do not say what became of the original handle. On 1 May 1855 the committee's secretary still wrote of the pump as one that might “continue to be used hereafter”. After York's discovery the well was closed for six weeks and then pumped out three times. The committee recommended that the parish's surface wells “be closed altogether”.

Sources and method
The numbers come from Snow's “On the Mode of Communication of Cholera” (second edition, 1855), from the report of the St James parish Cholera Inquiry Committee (1855) with the reports of Snow, Whitehead and York, from Whitehead's article in Macmillan's Magazine (1865), and from the General Board of Health's report (1855). The curve reproduces Snow's Table I.
The positions of the 578 deaths are Rusty Dodson and Waldo Tobler's digitisation of Snow's map (1992), in the corrected version in the HistData package. Eight pumps take the positions surveyed by Robin Wilson (2011); the other five, and the deaths, were placed on today's map by a transformation fitted to those eight (mean error under 4 m). Walking distances are computed on today's streets and footpaths from OpenStreetMap. The section through the well is a schematic after York's description.
- John Snow, On the Mode of Communication of Cholera, 2nd ed., London, 1855 (Internet Archive, Wellcome copy). archive.org/details/b28985266
- Cholera Inquiry Committee, Report on the Cholera Outbreak in the Parish of St. James, Westminster, during the Autumn of 1854, London, 1855. archive.org/details/b21363870
- Henry Whitehead, “The Broad Street pump: an episode in the cholera epidemic of 1854”, Macmillan's Magazine, 1865. archive.org/details/b22449231
- General Board of Health, Report of the Committee for Scientific Inquiries in Relation to the Cholera-Epidemic of 1854, London, 1855. archive.org/details/b2146876x
- Death positions: R. Dodson and W. Tobler (1992), in the R package HistData (Snow.deaths2). cran.r-project.org/package=HistData
- Pump positions: Robin Wilson, “John Snow's famous cholera analysis data in modern GIS formats”, 2011. blog.rtwilson.com/john-snows-famous-cholera-analysis-data-in-mod
- Today's streets: © OpenStreetMap contributors, ODbL. www.openstreetmap.org/copyright
- John M. Eyler, “The changing assessments of John Snow's and William Farr's cholera studies”, Sozial- und Präventivmedizin, 2001 (on Farr and the 1866 epidemic). johnsnow.matrix.msu.edu/documentUploads/15-78-DD/15-78-DD-22-200
- John Snow Society, “The return of the pump”, 20 July 2018. johnsnowsociety.org/2018/07/20/the-return-of-the-pump/
Images
- John Snow's map of the cholera deaths around Broad Street: John Snow, 1854 (lith. C. F. Cheffins) · public domain
- Snow's second map, with the line of equal walking distance: John Snow, 1855 · Wellcome Collection · CC BY 4.0
- John Snow: after an 1856 photograph · public domain
- Henry Whitehead: Scott and Sons, 1884 · public domain
- “A Court for King Cholera”, Punch, 1852: Punch, 1852 · Wellcome Collection · CC BY 4.0
- The replica pump in Broadwick Street: Jamzze · CC BY-SA 4.0

