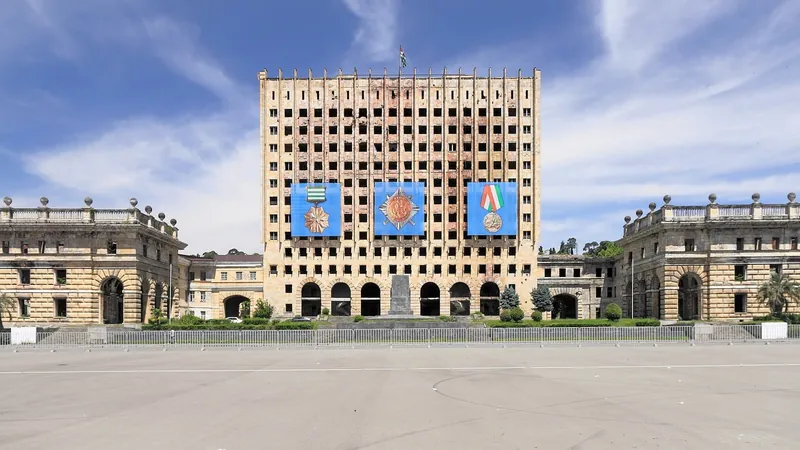
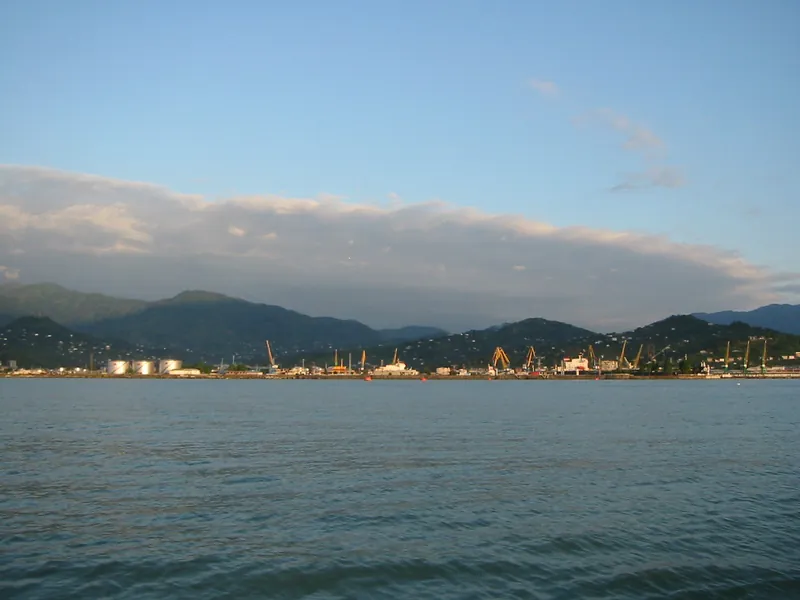
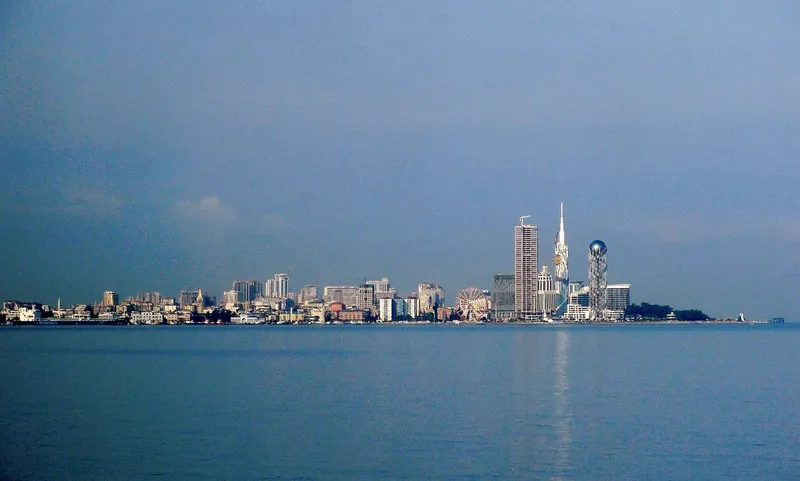
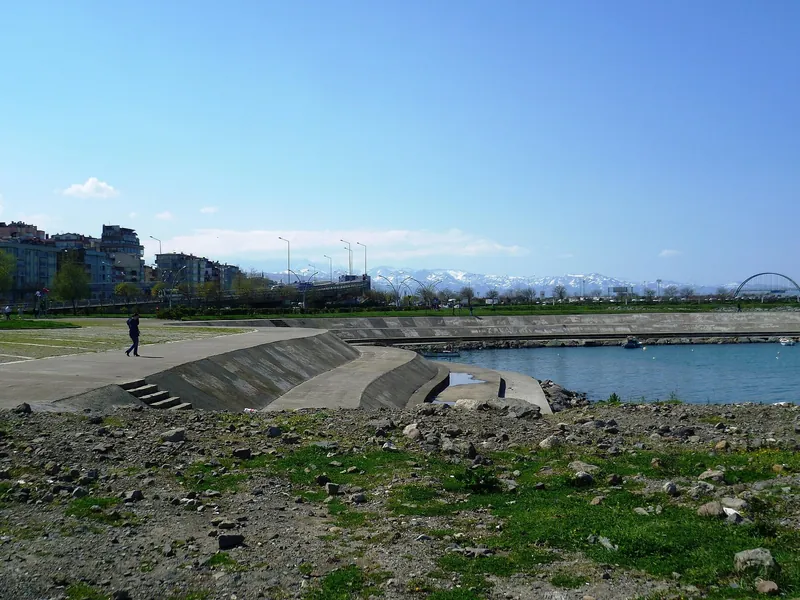
Your city on the coast#
Tap a city on the map or choose it from the list: the rings beside it stay lit, and the card shows its light in every year.
You can also tap straight on the map, on any stretch of coast.
Each coast’s share of the light, year by year#
Each coast’s share of the light on land within 10 km of the Black Sea and the Sea of Azov, for every year. The dotted line separates the two satellites.
The coast Ukraine controls today lost most: from 25.4% in 1992–1994 to 14.3% in 2011–2013 and 2.7% in 2022–2024. Occupied Crimea fell from 14.0% to 8.8% and rose again to 10.2%. Turkey went from 16.1% to 48.6%.
How much each city’s light changed#
Cities run in the order of the coast, from the Bosporus northwards and then clockwise. The first column compares 2011–2013 with 1992–1994 (the DMSP satellites), the second compares 2022–2024 with 2013 (the VIIRS instrument); a value below 1 means a fall.
| City | Coast | 2011–13 vs 1992–94 | 2022–24 vs 2013 | Lit area, km² |
|---|---|---|---|---|
| Burgas | Bulgaria | ×1.55 | ×1.31 | 167 → 197 |
| Varna | Bulgaria | ×1.56 | ×1.17 | 207 → 243 |
| Constanța | Romania | ×2.35 | ×1.21 | 131 → 172 |
| Chornomorsk | Ukraine | ×1.51 | ×0.45 | 129 → 155 |
| Odesa | Ukraine | ×1.15 | ×0.74 | 209 → 209 |
| Mykolaiv | Ukraine | ×1.07 | ×0.13 | 255 → 254 |
| Kherson | Ukraine | ×0.87 | ×0.28 | 254 → 232 |
| Yevpatoria | Crimea, occupied | ×1.45 | ×2.65 | 112 → 131 |
| Sevastopol | Crimea, occupied | ×1.35 | ×1.38 | 217 → 222 |
| Yalta | Crimea, occupied | ×2.00 | ×1.45 | 83 → 114 |
| Feodosia | Crimea, occupied | ×1.33 | ×2.11 | 89 → 93 |
| Kerch | Crimea, occupied | ×1.06 | ×2.48 | 184 → 161 |
| Berdiansk | Ukr. occupied 2022 | ×1.08 | ×1.11 | 110 → 111 |
| Mariupol | Ukr. occupied 2022 | ×1.11 | ×0.80 | 221 → 220 |
| Taganrog | Russia | ×1.31 | ×1.24 | 204 → 211 |
| Yeysk | Russia | ×1.68 | ×1.27 | 65 → 92 |
| Anapa | Russia | ×3.25 | ×1.34 | 117 → 186 |
| Novorossiysk | Russia | ×1.80 | ×1.12 | 225 → 280 |
| Gelendzhik | Russia | ×4.15 | ×1.41 | 82 → 177 |
| Tuapse | Russia | ×2.04 | ×1.15 | 115 → 177 |
| Sochi | Russia | ×2.40 | ×1.20 | 141 → 191 |
| Sukhumi | Abkhazia, occupied | ×9.01 | ×1.12 | 30 → 149 |
| Poti | Georgia | ×5.32 | ×1.23 | 24 → 88 |
| Batumi | Georgia | ×4.41 | ×1.27 | 58 → 128 |
| Rize | Turkey | ×1.77 | ×1.62 | 205 → 211 |
| Trabzon | Turkey | ×1.85 | ×1.41 | 144 → 154 |
| Giresun | Turkey | ×2.97 | ×1.69 | 80 → 150 |
| Ordu | Turkey | ×2.52 | ×1.66 | 133 → 204 |
| Samsun | Turkey | ×2.47 | ×1.19 | 124 → 184 |
| Sinop | Turkey | ×5.19 | ×1.43 | 16 → 47 |
| Zonguldak | Turkey | ×2.66 | ×1.36 | 69 → 143 |
What light measures and what it doesn’t#
The images come from a series published by Xuecao Li and colleagues: the world’s night lights for every year from 1992 to 2024, at about 1 km resolution. Up to 2013, images from the American military DMSP satellites (five of them, calibrated against each other); from 2014, images from the VIIRS instrument, converted to the older satellites’ scale. As the authors recommend, only values above 7 on the 0–63 scale are kept.
The change of instrument does not have the same effect everywhere. In 2013, a year both saw, the ratio of the new version to the old varies from city to city between 0.60 times (Yevpatoria) and 1.68 times (Poti). So no city’s index compares a year after 2013 with one before: each year is measured against 2013 seen by the same instrument (2013 = 100). The coasts’ shares are computed within each year; the 2014 change moves them by a few points: Turkey 6.0 up, Ukraine 2.5 and Crimea 1.7 down. On the rings, the new years are put on the old scale for each stretch of coast, with 2013 as the bridge.
For each city, the light on land within a 10 km circle around its GeoNames coordinates is added up. The shares add up the light on land within 10 km of the water, on coasts divided along Natural Earth’s province borders. Crimea and the coast occupied since 2022 are counted separately and named as Ukrainian territory under Russian occupation; Abkhazia as Georgian territory under Russian occupation.
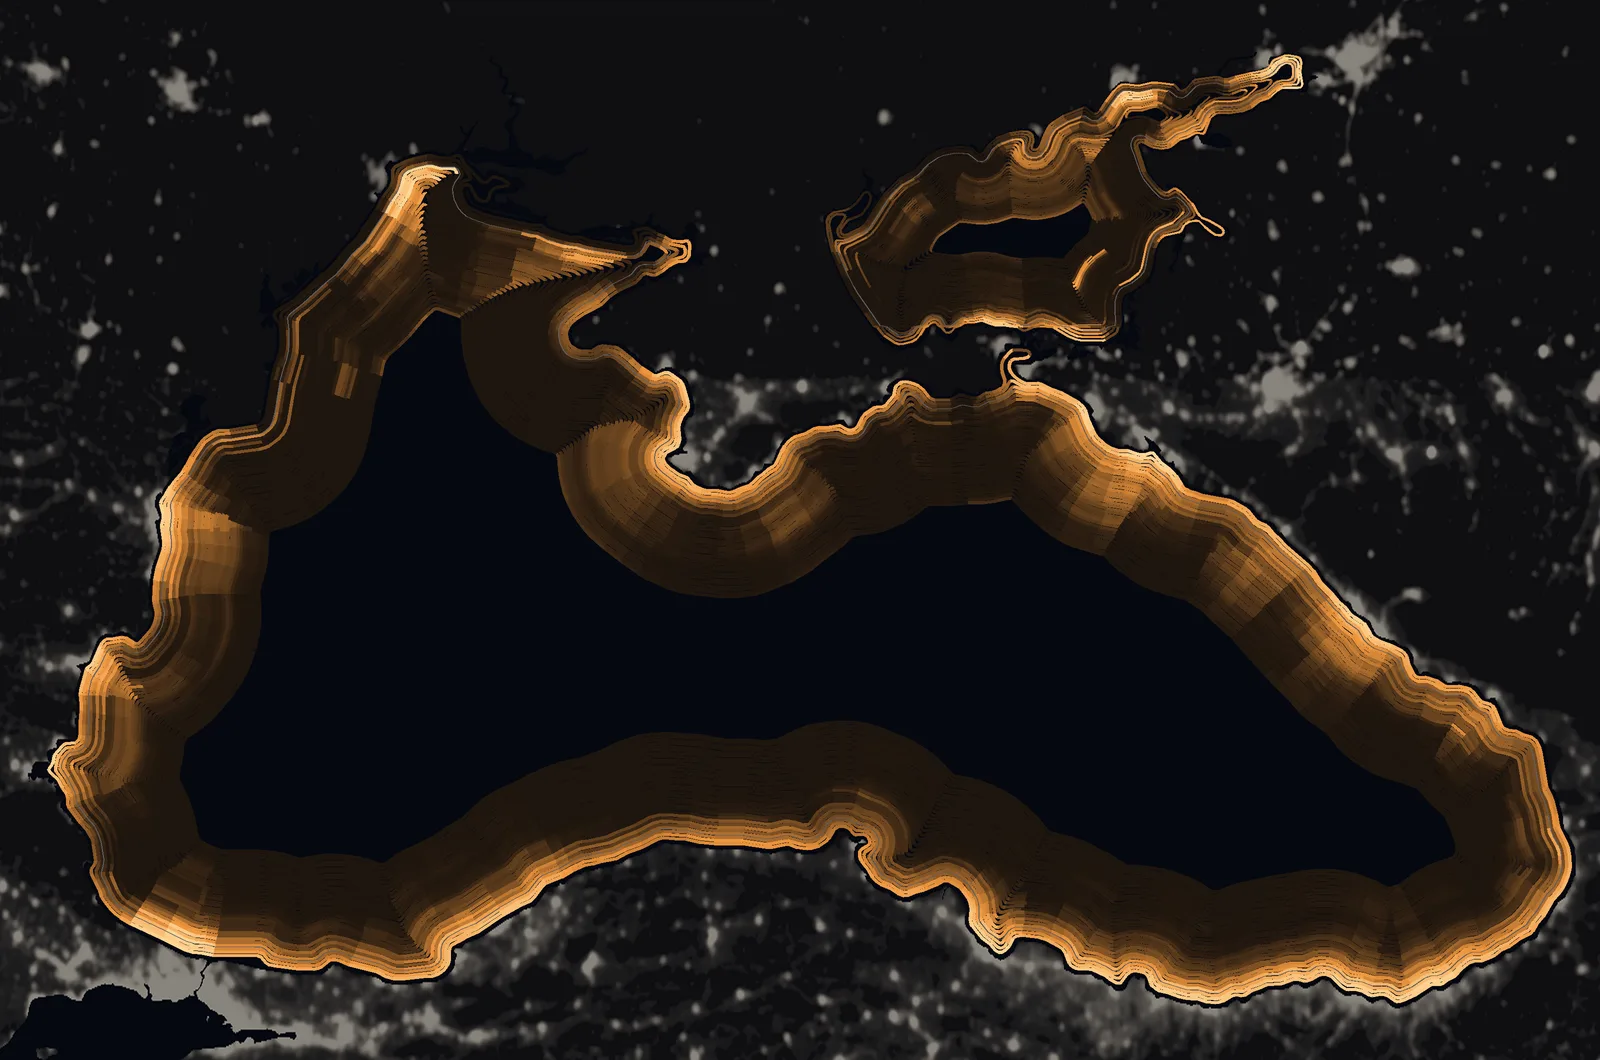
The rings are lines parallel to the shore, 2.4 km apart (1.55 km in the narrow Sea of Azov). The colour of each piece of ring combines two things: how much light there was on the nearest 5 km of coast in that ring’s year, and how that compares with the brightest years of the same stretch. So a coast that is going dark shows it even while it stays brighter than its neighbours. The older satellites’ data, which are noisier, are lightly smoothed (a year counts for half, each neighbour for a quarter). Mykolaiv and Kherson lie on the Dnipro–Bug estuary, so their light shows on the rings at the estuary’s mouth.
Light is not the same as people or money. In Ukraine after 2022 it also fell because of strikes on the power grid and, in some cities such as Kyiv, deliberately dimmed street lighting. A city that swaps sodium lamps for white LEDs can look darker to VIIRS, which cannot see light below 500 nm, even though it shines brighter. The centres of big cities hit the older satellites’ ceiling of 63, so their growth is underestimated. As an independent check, the built-up area from the European Commission’s GHSL for 1990–2020 is used.
The two patches of light out at sea in the north-west appear in the images of recent years; they have not been identified and are not part of any sum above.
Sources#
- Li, X., Zhou, Y., Zhao, M., Zhao, X. (2020), A harmonized global nighttime light dataset 1992–2018, Scientific Data 7:168; dataset extended to 1992–2024 (figshare, version 10, 2025, CC BY 4.0). figshare.com
- European Commission, Joint Research Centre: GHSL built-up surface and volume, R2023A, 1990–2020. human-settlement.emergency.copernicus.eu
- GeoNames, cities15000 (city coordinates, CC BY 4.0). download.geonames.org
- Natural Earth 10m land and admin-1 provinces (public domain). www.naturalearthdata.com
- World Bank, Lampietti et al. (2004), Revisiting Reform in the Energy Sector: Lessons from Georgia (hours of electricity, 2000–2001). documents1.worldbank.org
- Human Rights Watch (1995), Georgia/Abkhazia: Violations of the Laws of War and Russia’s Role in the Conflict. www.hrw.org
- RFE/RL (6 May 2004), Abashidze leaves for Moscow. www.rferl.org
- Hürriyet Daily News (1 May 2012), Turks flock to Batum casinos (Turkey’s ambassador Engin Arıkan). hurriyetdailynews.com
- Global Gaming Business (2016), Turkey asks Georgia to close casinos (casinos banned in Turkey since 1998). ggbmagazine.com
- Interfax (2011), Georgia and Turkey: border crossing without passports. interfax.com
- Al Jazeera (14 Aug 2008), Russian forces sink Georgian ships near Poti. www.aljazeera.com
- Al Jazeera (2 Feb 2014), Sochi: the most expensive Games ever. www.aljazeera.com
- PortNews (2009), first tanker loaded at the CPC terminal, 13 October 2001. en.portnews.ru
- UN News (27 Mar 2014), General Assembly resolution 68/262 on Crimea. news.un.org
- Moscow Times (15 May 2018), Putin opens the bridge to Crimea; EEAS statement on the rail link (23 Dec 2019). themoscowtimes.com
- JusticeInfo, The siege of Mariupol; Al Jazeera (21 May 2022), Azovstal. www.justiceinfo.net
- The Defense Post / AFP (3 Mar 2022), Russia captures Kherson; Euromaidan Press (12 Nov 2022), Kherson liberated. www.thedefensepost.com
- Kyiv Independent (24 May 2022), Mykolaiv without running water. kyivindependent.com
- Al Jazeera (31 Oct 2022 and 10 Dec 2022), strikes on Ukraine’s power grid; Odesa without power. www.aljazeera.com
- Ukrainian Sea Ports Authority (USPA), management report 2024 (Greater Odesa 79.9 Mt) and archived port tables 2015–2018. www.uspa.gov.ua
- Eurostat, gross weight of goods handled in main ports (mar_mg_aa_pwhd): Constanța, Varna, Burgas. ec.europa.eu
- Port of Constanța administration (16 Aug 2023): 12.5 million tonnes of Ukrainian goods in January–July 2023. www.portofconstantza.com
- RFE/RL (3 Sep 2022), Batumi: 8,317 building permits in Adjara over a decade. www.rferl.org
- European Commission (2007), Bulgaria and Romania join the EU. europa.eu
- Apaydın & Durmaz, the Black Sea Coastal Highway (Süleyman Demirel University); Milli Gazete (2017), 542 km on sea fill. acikerisim.sdu.edu.tr
- NASA Earth Observatory (2022), Tracking night lights in Ukraine; Huang et al. (2023), Frontiers in Environmental Science. www.frontiersin.org
- Kyba et al. (2017), Science Advances: LED lighting and VIIRS (GFZ press release). idw-online.de
- Photographs: Wikimedia Commons, authors and licences in each caption. commons.wikimedia.org