The map could not load. The text below holds every result.
Rome, Byzantium, the Caliphate and the Franks, AD 325–950
The end of Antiquity, told by half a million buried coins
No complete accounts survive of what the ancient world bought and sold. But its coins were buried, lost and found again: 491,432 of them, from 5,501 finds. Where each was struck and where it ended up shows the link between the two shores of the Mediterranean breaking, and the Franks rising against the rest.
Each line joins the mint where a coin was struck to the place it was found, for the coins buried in the twenty years shown on the map. Drag the years or press “Play the years”.
What a single coin can tell#
A gold dinar struck in AD 944–45 says so on its face: “In the name of God, this dinar was struck at al-Muhammadiyya in the year three hundred and thirty-three.” Most coins of the period carry a mint mark and a ruler’s name, so numismatists can place and date them. A hoard is dated by its youngest coin.
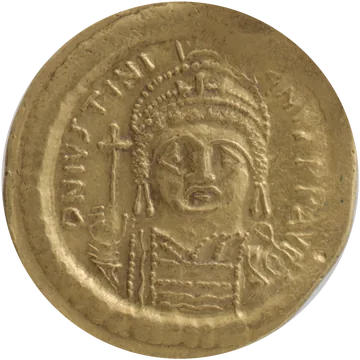
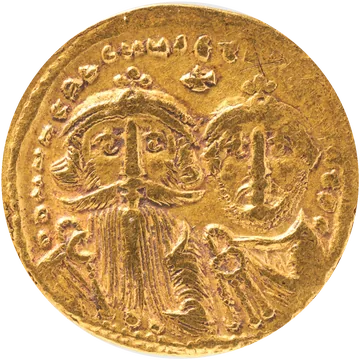
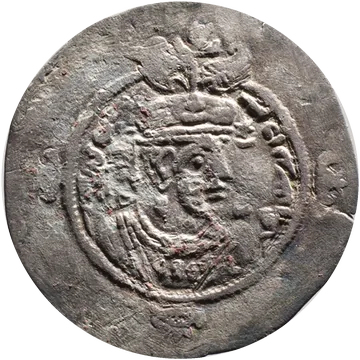
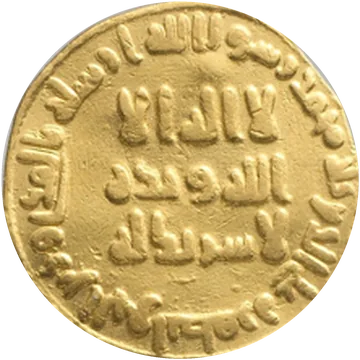
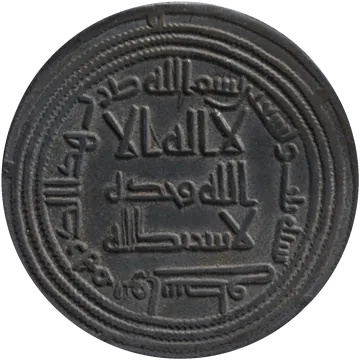
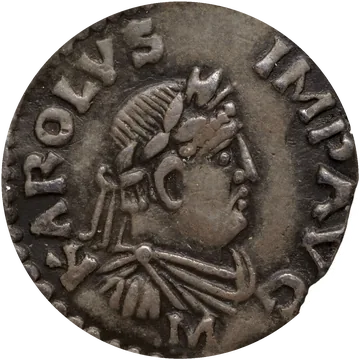
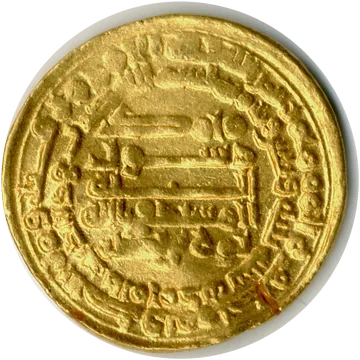
Photographs: The Metropolitan Museum of Art and Bibliothèque nationale de France, public domain.
Coins outlived the people who struck them. On average a coin was buried 59 years after it was made, and about 1.7% of the coins in circulation disappeared every year, melted down or lost: half of any year’s coins were gone within about 40 years.
The older a coin, the farther it had usually gone: within the same hoard, a coin twice as old had travelled about 8% farther from its mint. Every purchase could move it on, sometimes back again. The median distance from mint to find is 503 km: half the coins were found closer, half farther.
The lines on the map are straight, from mint to find. A coin may have changed hands dozens of times on the way, and its route is not recorded.
Before 630, money crossed the sea in every direction#
Between 450 and 630, coins struck at Carthage crossed to Italy and Gaul, and coins from Rome, Ravenna and Constantinople reached Africa and the Levant. Of the coins struck and buried in these years around the Mediterranean, 18.4% had crossed between the north and south shores: almost one in five.
The bright lines are the coins that crossed between the two shores. The others were found on the same side as their mint.
Between 632 and 750, the Arab conquests drew a new border#
When Muhammad died in 632, his state held part of Arabia; by 634, the whole peninsula. By 661 the caliphs held land from Tripoli to Balkh; by 709 the whole Maghreb; in 711 their army crossed into Spain. The Byzantine empire kept Anatolia, Greece and, until the 9th century, Sicily.
A new border between Islamic and Christian rule now ran across the sea: Spain and North Africa on one side, Italy, Gaul and Byzantium on the other.
After 713, almost no coin links north and south#
Of the coins struck and buried between 713 and 900 around the Mediterranean, only 1.5% had crossed between north and south, about one in 67. And 78% of those link al-Andalus with Frankish Aquitaine, neighbours across the Pyrenees rather than across the sea.
Money still moved, but east to west inside the Caliphate, and among the Frankish lands. Two finds in Switzerland, at Ilanz and Steckborn, are among the few with Islamic coins from across the sea.
What the model reads: trade, not just coins#
Counting coins is not enough, because a coin could cross the sea more than once. Johannes Boehm and Thomas Chaney built a model in which every purchase moves coins one step through a trade network, and looked, for every twenty years, for the trade that makes the mix of coins found in each place most likely.
The result for the Mediterranean: trade between the northern and the southern regions (by sea or by land) fell from 2.5–4.9% of the Mediterranean regions’ income before 620 to 0.51% or less after 660.
Trade between the southern regions did not collapse with the conquests, but it swung widely. Between 440 and 620 it was 3.1–7.3% of income, in 680–720 it dropped below 2%, and in the 760s, inside the Caliphate, the estimate rises to 14.6%, with a very wide margin of uncertainty. After 780 it falls again.
The border, counted in days of travel#
The model measures a border by the trade it loses, and that loss can be written as extra travel time. In the model, the sea border between a Christian and a Muslim region cut trade as much as making the journey 4.8 times longer, all else equal. The land border into Byzantium counted as a journey 3.9 times longer, the Pyrenees as 1.8 times, and an ordinary border between two Christian kingdoms as 1.2 times. Where both apply, the effects multiply.
From Rome, Carthage was 4.3 days away by the cheapest route. After 700, with both borders, the model treats their trade like a journey of 25 days: longer than the trip to Constantinople (21 days).
Travel days: the network the authors used (ORBIS for the Roman world, al-Thurayyā for the Islamic one), cheapest route in the good sailing season. The paper estimates borders between its 13 regions; applying them between cities is this page’s extension.
The Mediterranean was losing ground before Islam#
The Belgian historian Henri Pirenne blamed the Arabs for the end of the ancient economy. The model agrees with him about the link between the shores, but not about the timing. Around 400 the Mediterranean regions’ average income was 1.6 times the average of all regions. The fall begins in the first half of the 6th century (in the 520s), a century before Islam, as the east and then the north grow faster. By 620 it was 1.1, by the 820s 0.4.
Income also spread out across regions. In 380 a few regions held almost all of it: the concentration index (Herfindahl) was 0.74, where 1 would mean one region with all the income. By 480 it had fallen to 0.42, and from 560 to 860 it stayed between 0.15 and 0.51.
Who got richer: the map, region by region#
From trade and from the coins each region struck, the model recovers each region’s share of total consumption; absolute levels cannot be known. The map ranks the 13 regions in every twenty-year period, 1 being the largest.
Around 400 the top three were Egypt, Byzantine heartlands and Northern Italy & Balkans. In 860: Francia & Germania, Aquitaine & Basque Country and al-Sham (Greater Syria). Syria, Arabia, al-Andalus and Iraq all reach their largest share in the 8th century, under the Umayyad and Abbasid caliphs.
Tap a region to see its curve. Hatched: regions whose estimated share is close to zero, where the rank says little.
Byzantium and the Franks swapped places#
The heartlands of the Byzantine empire ranked second of 13 around 400 and still third around 600; by 860 they were tenth. Francia and Germania went the other way: eleventh around 600, first from the 820s.
How big the swing was depends on the model. In the main version, Francia rises by +10.16 points on the model’s log scale between 460–620 and 700–900; in the version the authors find most credible, where richer regions also use more money, it rises by +2.05. The two versions agree on the direction for 11 of the 13 regions.
Romania: hundreds of finds until 620, then very few#
Today’s Romania has 373 finds with a known find-spot in the paper’s data, from 116 different places. 304 of them, from 65 places, are in Constanța and Tulcea counties (Romanian Dobruja), on the empire’s Danube frontier; most are single coins from excavations, not hoards.
310 of them are dated, by their youngest coin, to 560–619. From 620 on there are 18. The numbers alone do not show why. The Priseaca hoard, buried after 681 with 141 coins, is one of the few later ones.
Only finds with a known find-spot are counted. Another 122 are placed in the paper’s data at the centre of a province (Moesia Secunda, Dobruja) or at a museum, and the 37 from Silistra lie on the Bulgarian bank.
What the coins say about drought, war and plague#
Because the model gives a value for every region in every period, it can be set beside other records. Summer droughts reconstructed from tree rings line up with falls: in the main model, each year of severe drought within a twenty-year period went with about 32% lower estimated consumption (about 7% in the version with barter); the authors read it as an effect because drought does not depend on people. Regions with a documented gold, silver or copper mine struck about four times as many coins by the model’s estimates; here the authors claim no cause.
For two expected causes, the authors find no systematic link with a region’s fortunes: the 297 battles and sieges recorded between 300 and 950, and the Plague of Justinian (541–549). That does not rule out their effects. The coins only show regions relative to one another, so a disaster that struck everywhere at once would be invisible.
Where town sizes are known, in Europe after 700, the regions the model says gained grew their towns most: Iberia, Aquitaine and Francia.
Every find, on the map#
Tap any point to see what was found there: when it was buried, how many coins, from which mints, and how far the farthest had come. Or search for a place.
Was Pirenne right?#
“Without Mohammed Charlemagne would have been inconceivable,” Pirenne wrote in 1927. The coins bear him out on half of it.
- ConfirmedTrade between the Christian and Muslim shores collapsed after the Arab conquests: from 2.5–4.9% of the Mediterranean regions’ income to 0.51% or less.
- Half rightMediterranean trade did not die: between the southern regions, inside the Caliphate, it reached its highest estimate in the 760s.
- Wrong on timingThe Mediterranean’s decline began in the 520s, a century before Islam.
- Wrong about the FranksPirenne thought that, cut off from the sea, the Franks grew poor. By the model, their lands became in the 8th century among the largest by share of the area’s consumption, more than seven centuries before European colonial expansion into the Americas.
How this was made, and where it stops#
The data. 491,432 coins from 5,501 finds, buried between 325 and 950: Princeton’s FLAME database (hoards, excavations and single finds) plus 736 finds the authors gathered from numismatic catalogues, mostly for the Caliphate and the Franks. Of these, 268,209 coins have both a mint and a date range; only those are drawn as lines. The authors’ cleaning steps were rebuilt, and the totals match the paper’s appendix Tables B.I and B.II exactly.
The model’s numbers (trade, consumption, borders) are the paper’s. The series in the charts were read from the vector figures of the article and its appendix; for the 13 regions, the shares read sum to 1 (within 0.001) in every period, and the Byzantine and Frankish curves match Figure 10 to 0.001.
What coins cannot show. Only relative sizes: one region against the others, not how rich the whole world was. Coins also moved as tribute, ransom and plunder, not just in trade. Hoards are found unevenly (where people dig, where metal detectors are allowed), so the model uses only the proportions of coins within each hoard, never the number of hoards. The 13 regions are large, and the size of consumption changes varies several-fold between versions of the model.
Travel days between cities are computed on the authors’ network; the paper uses them only between region centres. Modern country names are indicative (each find placed on the Natural Earth map; the Silistra finds, which that map puts in Romania, are counted in Bulgaria). A “find” is a database record; several can come from the same site.
Sources#
- The paper: Johannes Boehm and Thomas Chaney, “Trade and the End of Antiquity”, Econometrica (forthcoming; accepted manuscript, August 2026). PDF · appendix · data and code (CC BY 4.0).
- Coins: FLAME, Framing the Late Antique and Early Medieval Economy, Princeton University (CC BY-SA 3.0), the January 2025 extract the authors used, plus the finds they gathered from the numismatic literature (full list in their appendix D).
- Roads and sea routes: W. Scheidel, ORBIS (Stanford) and M. Romanov, M. Seydi, al-Thurayyā, merged by the authors. Region borders: DARMC (Harvard) and al-Thurayyā, after the authors. Arab conquests: the maps in the authors’ package (Euratlas, S. Netchev).
- Photographs: The Metropolitan Museum of Art, Open Access (public domain): solidus of Justinian I (469160), solidus of Heraclius (462742), dinar of AH 79 (453447), dirham of AH 93 (444958), Sasanian drachm (323485), Samanid dinar of AH 333 (457627). Denier of Charlemagne: Bibliothèque nationale de France, via Wikimedia Commons (public domain).
- Map: Natural Earth (public domain): land, rivers, lakes and shaded relief.