mariuscomper.uk
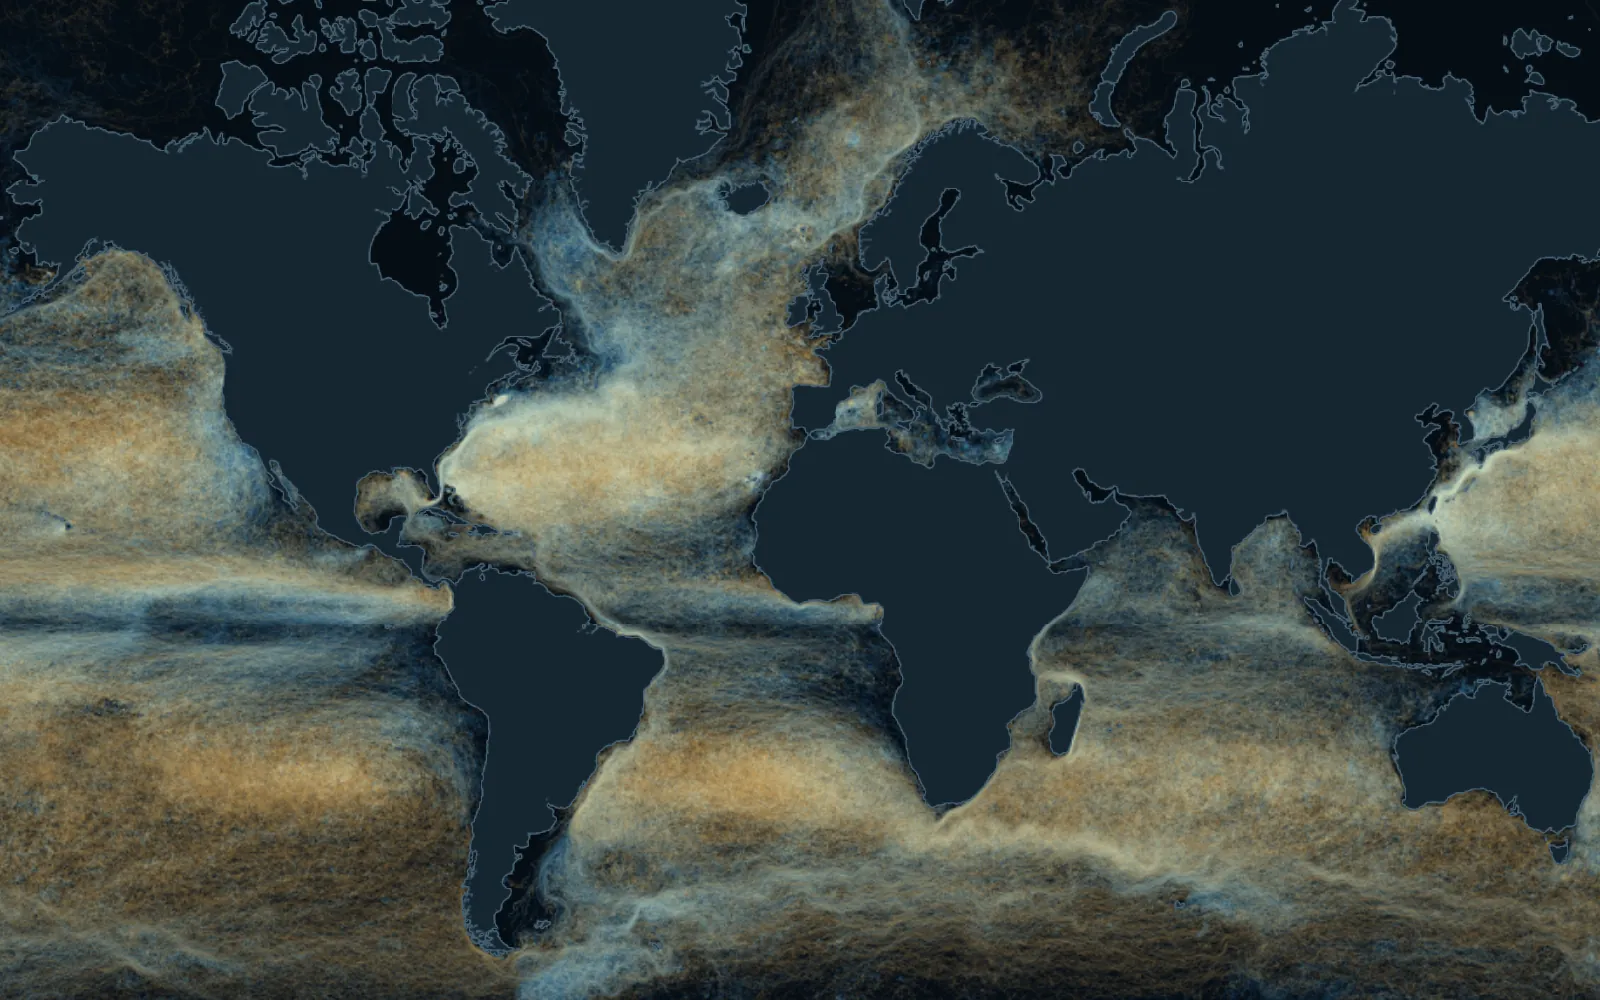
A world map woven from the paths of 28,728 buoys: gold and blue threads follow the ocean currents.

Message in a bottle

Where a bottle thrown into the sea ends up: the paths of 28,728 satellite-tracked buoys

Since 1979, oceanographers have set 28,728 buoys adrift that report their position by satellite. Without its anchor, a buoy drifts almost like a bottle. Pick a beach: the page sets off again every buoy that passed it, each from where it was at the time, and shows you where the sea took them.

Data: NOAA Global Drifter Program, 48.9 million positions, from 15 February 1979 to 12 June 2025.

Every thread on the map is a buoy

Each of these buoys is a float tied to a sea anchor: a sleeve of holed fabric hanging 15 metres down. The anchor holds it to the current below the waves, so the wind cannot push it about. A satellite fixes its position several times a day.

The anchor usually breaks off before the batteries run out. Without it, the buoy floats on the surface, where the wind moves it too, almost like a bottle. On the map, gold threads are paths drifted without the anchor, blue ones with it. More than half the positions (56%) come from buoys that had lost their anchor.

no anchor: floats like a bottleanchored: follows the current at 15 mcame ashore

Where the threads gather into a single bundle there is a current: the Gulf Stream, heading north-east from Florida, or the Kuroshio along Japan.

Throw the bottle

Pick a beach or tap anywhere on the sea. The page finds every buoy that passed within 50 kilometres (60 along the Romanian coast; up to 150 where few passed), starts them all from the day they were there and lets them drift for two years.

Or tap the map, anywhere on the sea.

Each buoy starts from where it was when it passed, in its own year. The clock on the map counts the days since.

From the Hebrides, the sea runs north

Between 1993 and 2024, 46 buoys passed within 50 kilometres of the Outer Hebrides. 27 came ashore within two years: 20 in Britain, 6 in Norway and one on the Arctic coast of Russia, 2,382 km away.

Most of those that left British waters went north-east, up the coast of Norway. Bottles do the same: in 2020 a bottle a schoolgirl had dropped off Peterhead in 1996 was found on Gasvær, an island off Norway, according to UPI.

These are 46 buoys from three decades: they show the direction of the water, not the fate of every bottle.

From Iceland to Russia's Arctic coast

Set adrift on 11 February 2020 west of Iceland, this buoy lost its anchor within three weeks. It rounded the southern tip of Greenland into the Labrador Sea, turned back across the Atlantic, passed 24 km off the Outer Hebrides after 788 days, rode up the coast of Norway into the Barents Sea and came ashore on the Kola Peninsula on 18 June 2023, after 1,223 days.

18,816 km to Malaysia

On 17 November 2005 the ship Jens Maersk set a buoy adrift in the Pacific between Ecuador and the Galápagos. It lost its anchor in May 2006 and drifted west, north of the equator, across the whole ocean; it crossed the date line after 402 days, slipped between Taiwan and the Philippines into the South China Sea and, on 27 March 2008, after 861 days, came ashore in Malaysia. From launch to shore is 18,816 km in a straight line: the longest of all 6,853 buoys that ran aground.

From the Caribbean to a beach in France

Set adrift on 2 April 2006 off Cozumel, south of the Yucatán Channel, this buoy spent about seven months in the Caribbean, with a brief loop into the Gulf of Mexico, then caught the Gulf Stream and passed about 45 km from Miami. It crossed the Atlantic and on 5 December 2008, after 978 days, came ashore on the coast of the Landes in south-west France.

Ten years and 40,009 km, almost the length of the equator

The longest-lived buoy was set adrift on 24 January 1996 off Kamchatka. It lost its anchor after almost two years, drifted around the North Pacific and fell silent on 13 June 2006, some 900 kilometres off California, after 3,793 days. Its daily positions, joined up, add up to 40,009 km; the equator is 40,075.

Where buoys come ashore

Of 28,728 buoys, 6,853 ran aground (24%). The rest did not run aground: 18,710 stopped transmitting, 2,041 were picked up by a ship, and 1,124 were still transmitting in June 2025.

The map shows where they ran aground. By country, the most groundings are in the United States (420), then Japan (336), Australia (315), Brazil (253) and the Philippines (240). Seven in ten (72%) had lost their anchor at least a day before and were floating almost like a bottle.

no anchor: floats like a bottleanchored: follows the current at 15 m

At the 38 beaches on this page, 302 of the 487 buoys that came ashore (62%) came ashore in the same country as the beach.

Before satellites, people threw bottles

In 1864 Georg von Neumayer, who would go on to found the German naval observatory Deutsche Seewarte in Hamburg, threw into the sea off Australia the first bottle of a programme that ran into the 1930s. Each bottle carried a slip to be sent back to Hamburg; 662 came back.

A 663rd, thrown from the barque Paula on 12 June 1886, was found in January 2018 on a beach near Wedge Island, 180 kilometres north of Perth, Australia. Guinness World Records counts 131 years and 223 days at sea: the oldest message in a bottle known.

In 1914 Captain C. Hunter Brown of the Glasgow School of Navigation released 1,890 bottles. The 315th to be found turned up near Shetland in April 2012, almost 98 years later.

On 10 January 1992 a ship lost a container of 28,800 bath toys in the North Pacific: turtles, ducks, beavers and frogs. Hundreds came ashore near Sitka, Alaska, about 3,500 kilometres away, and the oceanographer Curtis Ebbesmeyer used them to trace the currents.

The sea near you

The map is yours: tap anywhere on the sea, from Brighton to Tierra del Fuego. For the full screen, with a map you can move with your finger: “Map only”.

Where a bottle thrown off Cornwall, the Hebrides, Barcelona and other beaches ends up

The result for all 38 beaches in the list. “Ashore” means buoys that ran aground within two years of passing.

PlacePassedAshoreFirst ashoreFarthest
Outer Hebrides4627the same day, the United KingdomRussia, 2,382 km
Galway2116the same day, Irelandthe United Kingdom, 332 km
Isles of Scilly209after 1 day, the United Kingdomthe United Kingdom, 266 km
Cornwall, Land’s End1810the same day, the United Kingdomthe United Kingdom, 355 km
Belfast Lough1614the same day, the United Kingdomthe United Kingdom, 302 km
Pembrokeshire1310the same day, the United Kingdomthe United Kingdom, 686 km
Brighton75after 1 day, the United Kingdomthe Netherlands, 420 km
The Romanian coast116after 13 days, TurkeyRussia, 643 km
Varna96after 10 days, TurkeyRussia, 798 km
Mallorca6340after 1 day, SpainLibya, 1,401 km
Barcelona3625the same day, SpainLibya, 1,540 km
Malta3520after 69 days, LibyaEgypt, 1,356 km
Nice3022after 6 days, FranceLibya, 1,442 km
Rhodes158after 35 days, GreeceEgypt, 778 km
Cyprus, Ayia Napa1510after 26 days, LebanonEgypt, 676 km
Antalya149after 3 days, TurkeyEgypt, 680 km
Crete95after 3 days, GreeceSyria, 1,001 km
Zakynthos98the same day, GreeceIsrael, 1,395 km
Corfu87after 2 days, AlbaniaLibya, 784 km
Dubrovnik53after 15 days, ItalyItaly, 249 km
Miami12430the same day, the United StatesFrance, 7,181 km
Tenerife10134the same day, Spainunnamed shore, 6,899 km
Reykjavík9246the same day, IcelandNorway, 1,852 km
Tokyo, Sagami Bay552the same day, JapanJapan, 90 km
Waikiki, Hawaii5117the same day, the United Statesthe United States, 265 km

How it is calculated

The data are the six-hourly positions of the 28,728 buoys of NOAA's Global Drifter Program, May 2025 release, quality-controlled and interpolated by the programme's data centre. The page uses one position a day, the one at midnight UTC.

A buoy “passed” a beach if one of its daily positions came within 50 kilometres; where fewer than eight passed, the radius grows to 75, 100 and then 150 kilometres, and the result states the radius used. For the Romanian coast the radius is 60 kilometres from eight points along the shore, from Sulina to Mangalia. Each buoy is counted once, at its first pass.

The fate comes from the programme's register: ran aground, picked up by a ship, or stopped transmitting. Only what happened within 730 days of the pass counts. The country is the nearest one within 30 kilometres of the last position, on Natural Earth borders.

Where very many buoys pass, the page draws at most 240 paths per 5-degree square, chosen to cover the whole square; all of them are counted. Paths are drawn every two days.

A buoy is not a bottle. With its anchor on, the wind pushes it at less than a tenth of a per cent of its speed; without the anchor, at about one per cent (0.7 to 1.6%, depending on the study). A bottle stands higher out of the water and the wind moves it more, but there is no comparable measurement for bottles. For 21% of the buoys that ran aground, the loss of the anchor is dated to the day they ran aground, so it is unknown whether the anchor was still on before.

Buoys are launched where research programmes need them, so some seas are almost empty: in this programme's data the Black Sea has buoys only from 2001 to 2010 (other campaigns released some from 1999), and the northern Adriatic and Aegean have none. Paths come from different years, and currents change from season to season and from year to year.

Sources

  1. Lumpkin, R., Centurioni, L. (2019). NOAA Global Drifter Program quality-controlled 6-hour interpolated data from ocean surface drifting buoys. NOAA National Centers for Environmental Information; May 2025 release in the ragged-array form published by the CloudDrift project on AWS Open Data. doi.org
  2. Laurindo, L. C., Mariano, A. J., Lumpkin, R. (2017). An improved near-surface velocity climatology for the global ocean from drifter observations. Deep-Sea Research I 124, 73–92. doi.org
  3. Lumpkin, R. (2020). Recovering velocity information from undrogued buoys. US CLIVAR presentation, NOAA AOML. usclivar.org
  4. Menna, M., Poulain, P.-M. (2014). Geostrophic currents and kinetic energies in the Black Sea estimated from merged drifter and satellite altimetry data. Ocean Science 10, 155–165. doi.org
  5. Poulain, P.-M., Barbanti, R., Motyzhev, S., Zatsepin, A. (2005). Statistical description of the Black Sea near-surface circulation using drifters in 1999–2003. Deep-Sea Research I 52, 2250–2274. doi.org
  6. Mihailov, M. E., Buga, L., Ștefan, S. et al. (2013). Waves and marine currents characteristics along the western Black Sea coast. EGU General Assembly, EGU2013-9161. meetingorganizer.copernicus.org
  7. Western Australian Museum (2018). 132-year-old message in a bottle found on WA beach. visit.museum.wa.gov.au
  8. Guinness World Records. Oldest message in a bottle. www.guinnessworldrecords.com
  9. Henkel, K. (2009). Treibgut im Dienst der Wissenschaft. taz. taz.de
  10. Deutsches Schifffahrtsmuseum (2023). Press release on Georg von Neumayer's bottle post, idw. idw-online.de
  11. Berlin, J. (2012). Oldest message in a bottle. National Geographic. www.nationalgeographic.com
  12. Ebbesmeyer, C. Beachcombing science from bath toys. beachcombersalert.org
  13. Natural Earth: land and country borders at 1:10 million (public domain). www.naturalearthdata.com
  14. Hooper, B. (2022). Message in a bottle travels from Scotland to Norway. UPI. www.upi.com