
Loading the fires…
Romania, 2012–2025 · 151,479 fire detections from orbit
When the stubble burns: the fires on Romania's fields, day by day
The lights on this map are fire detections: each is a place on farmland where a satellite recorded the heat of a fire on one day between 2012 and 2025. A detection is not a fire: a large fire can give several detections, and some fires are never recorded. Most come in two seasons: early spring, and the weeks after the harvest, when stubble is burned. After the harvest, on arable land, there have been about a fifth as many detections since 2022 as before.
18 March 2012
On one day, 1,158 fire detections in the fields#
Each light on the map is a fire detection recorded by satellite on that day. On Sunday 18 March 2012 there were 1,158 detections on Romania's farmland: the most on any one day in the archive's fourteen years.
March 2012 as a whole brought 7,972 detections.
12 July 2016, southern Oltenia, in Romania's south-west
What the satellite actually sees#
The American satellite Suomi NPP sees Romania a few times a day, in two windows: in summer, at about 2 pm and about 4 am. Its instrument, VIIRS, measures the heat of the ground in squares roughly 375 metres across (larger towards the edge of the image) and, after several checks, marks those in which something appears to be burning.
A detection is therefore a square of about 14 hectares in which the satellite, on one pass, recorded heat that NASA takes to be a vegetation fire. It does not say how much burned, it does not show a particular field and it does not say who lit the fire. A large fire can give several detections; one lit and put out between two passes can be missed, and so can one under cloud.
On this day there were 444 detections on the country's arable land, the most on any day after a harvest.
2016, January to December
A year has two fire seasons#
Scroll and the year passes on the map. In spring, February to April, detections appear on arable land, on pasture, in reedbeds and at the edge of woods. In summer and autumn, July to October, they are mostly on arable land, after the harvest: this is when stubble is set alight, the straw and stalks left behind the combine.
Between them, in May and June, the fields are green and detections are rare. The same in winter.
July–August, 2012–2017
Why stubble is set alight#
After the combine passes, chopped straw and cut stalks are left on the field. The residue can be left on the soil, baled, or ploughed in. Some farmers set it alight: fire needs neither a machine nor diesel.
It is also illegal, and a farmer who receives a European Union subsidy loses part of it for burning. The subsidies are paid by a Romanian agency, APIA. Every year the fire service is called to about a thousand stubble fires.
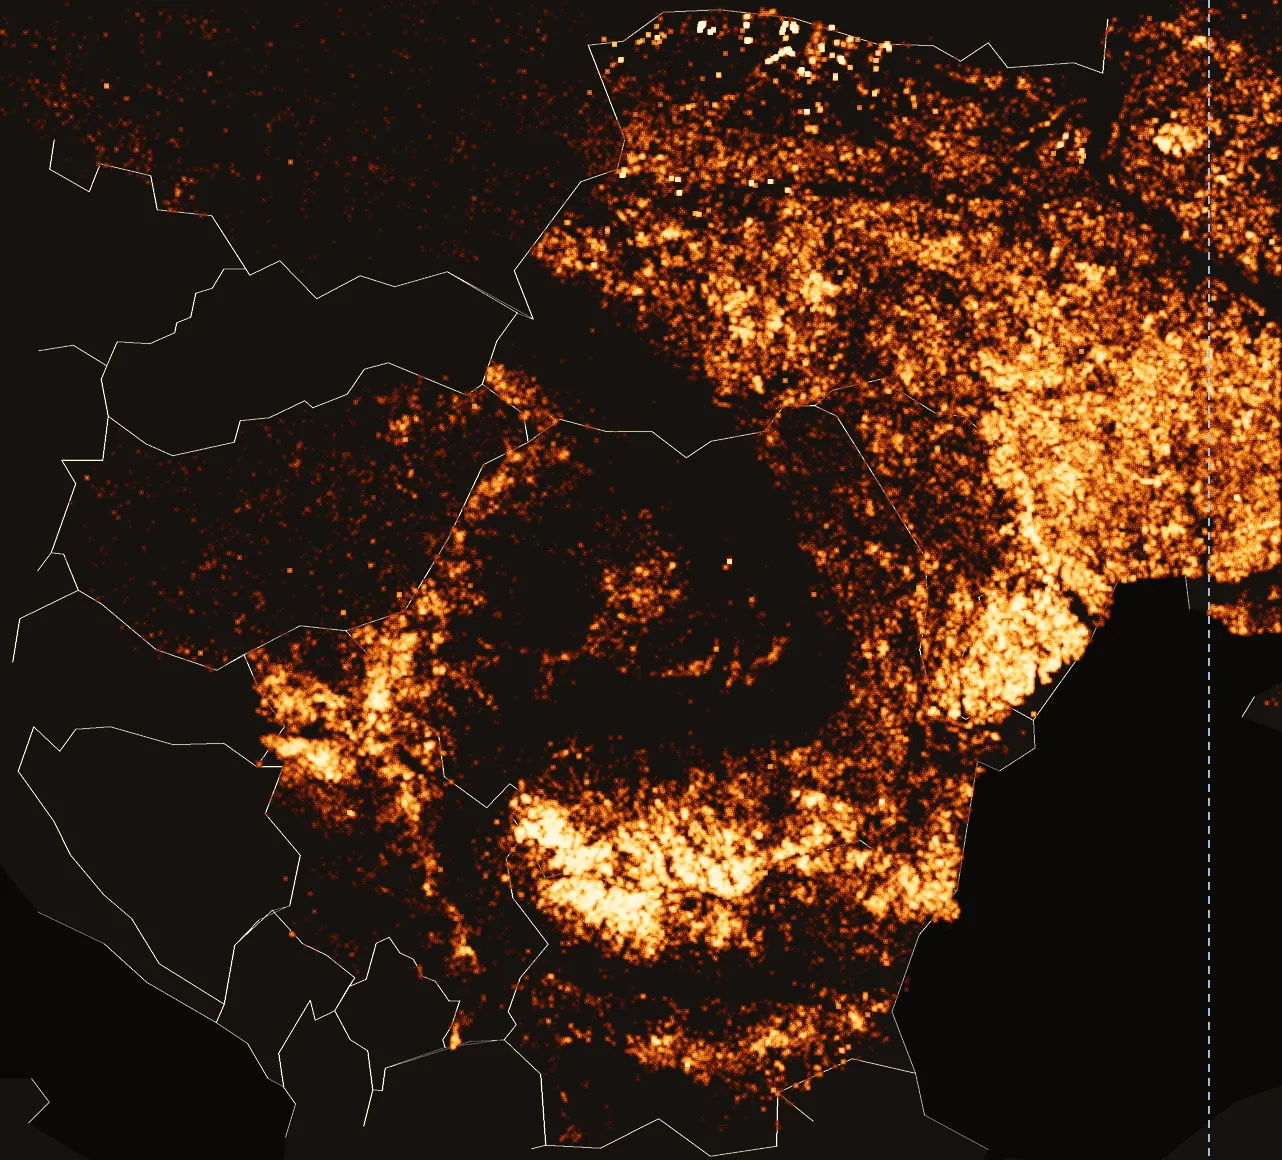
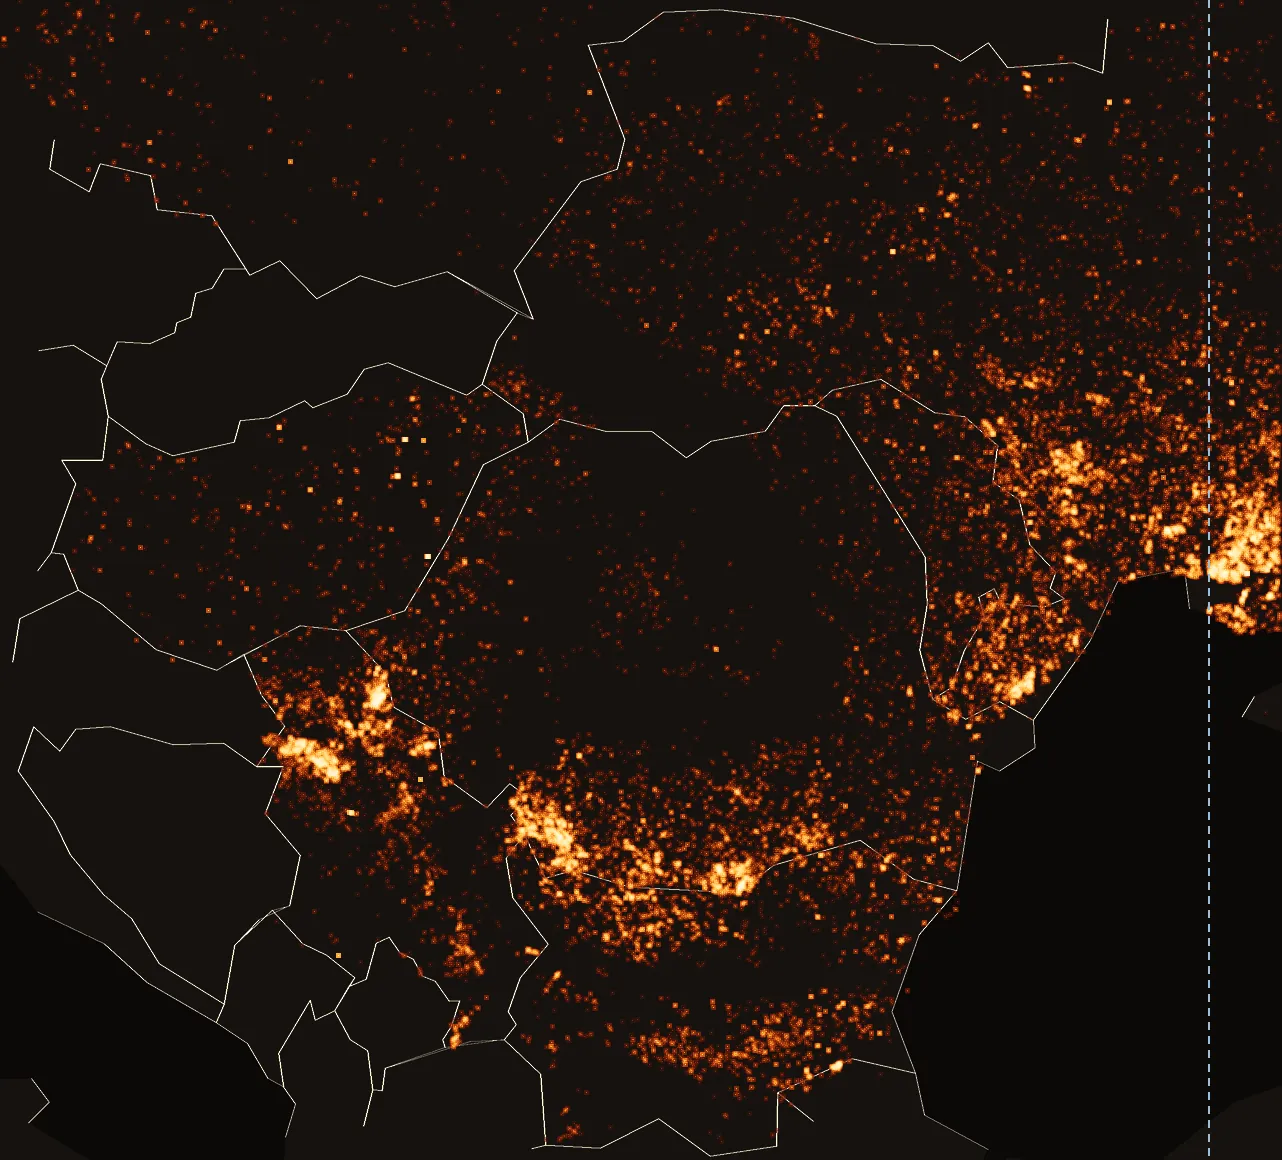
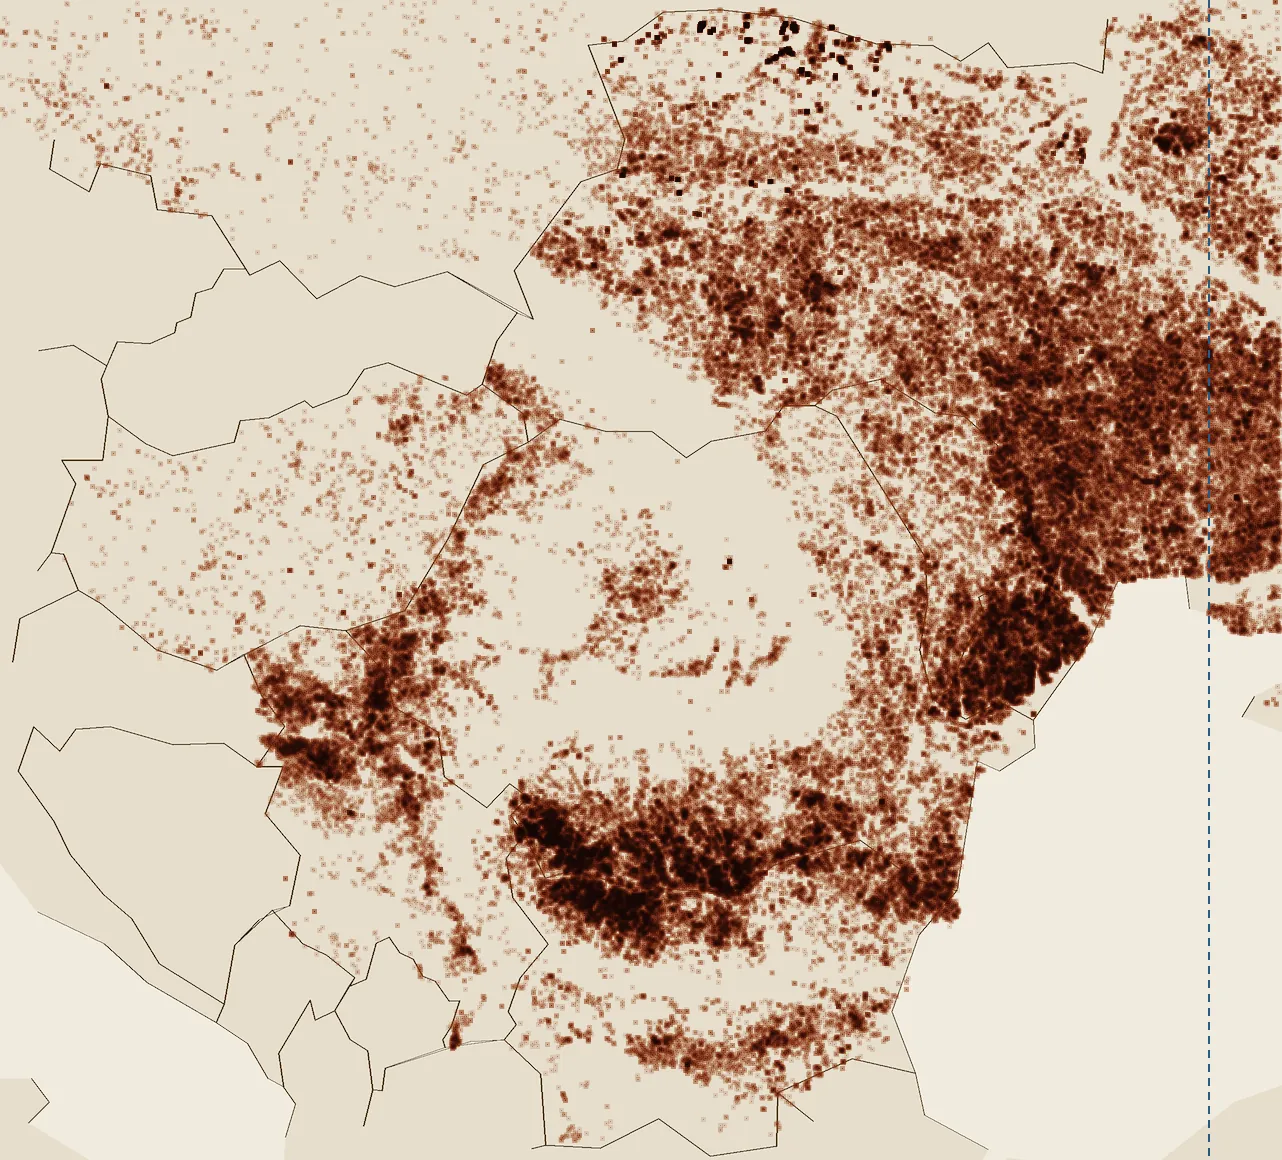
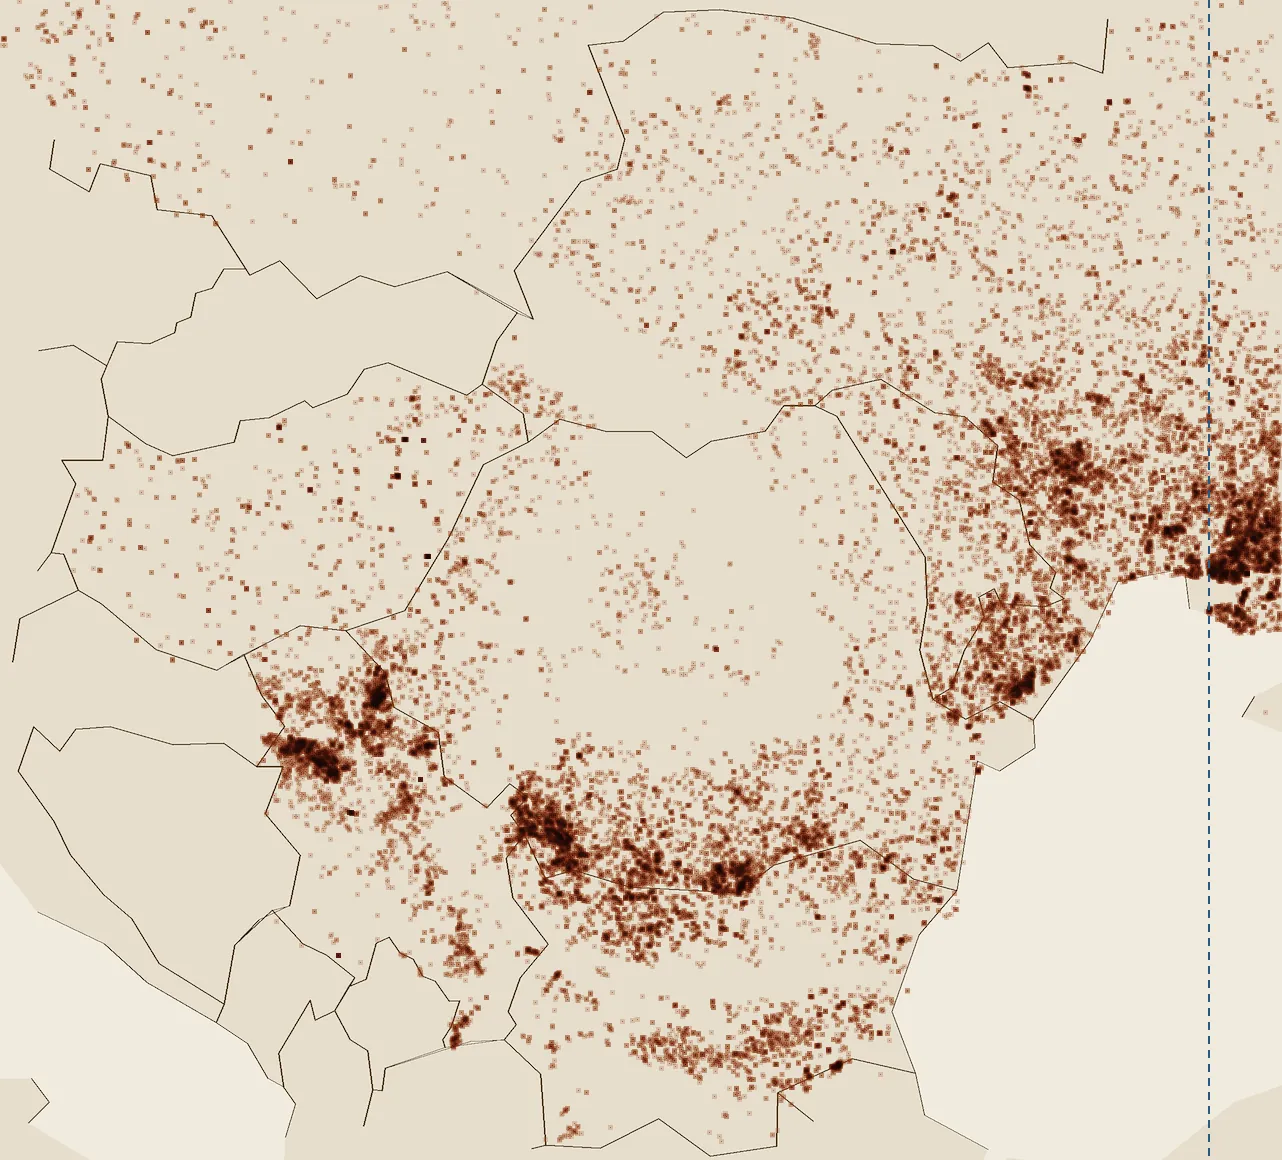
The map shows where most detections were in July and August in the archive's first six years: the Romanian Plain, north of the Danube; then the Banat, in the west, and Dobrogea, by the Black Sea.
23 January 2012 – 30 December 2025
151,479 detections, day by day#
Scroll through the whole archive. The calendar has a row for each year and a cell for each day; the stronger the cell's colour, the more detections on farmland that day.
The 151,479 detections are not 151,479 fires, nor 151,479 burnt stubble fields: they are on every kind of farmland, all year round, and one fire can be counted several times. The comparison that follows is for arable land after the harvest only.
Two things show without any arithmetic. July detections thin out after 2017. From 2022 the autumn ones thin out too.
1 July – 31 October, on arable land
After the harvest: from 8,629 detections a year to 1,778#
Scroll: the map moves from the average of 2012–2017 to the average of 2022–2025, on the same colour scale.
Detections on arable land, 1 July – 31 October, by year; hatched: a year with days without data. 2012: 9,297, 2013: 8,847, 2014: 8,524, 2015: 6,575, 2016: 11,274, 2017: 7,256, 2018: 6,876, 2019: 9,164, 2020: 4,449, 2021: 6,450, 2022: 1,372, 2023: 2,227, 2024: 1,592, 2025: 1,919 Between 2012 and 2017 the satellite recorded an average of 8,629 detections a year on arable land from 1 July to 31 October. Between 2022 and 2025: 1,778. Counted per day on which the instrument was working, the fall is 78%.
The year with most detections since 2022 (2023, with 2,227) has about half of what the year with fewest had before (2020, with 4,449). Of the 35 Romanian counties with at least 20 detections a year at the start, 33 fell below half; Caraș-Severin stayed at exactly half, and Gorj above.
Two equally dry seasons
The fall remains after allowing for rain and cloud#
Fire needs dry days and the satellite needs a clear sky. A wet, cloudy year would bring fewer detections with no change at all in the fields.
The seasons with least rain in the archive are 2023 (98 mm from July to October, where detections used to be most frequent) and 2012 (99 mm). Scroll from one to the other: 2012 had 9,297 detections, 2023 had 2,227.
Dividing each season's detections by its number of dry, clear days with a working satellite gives 151 a day in 2012–2017 and 32 in 2022–2025: 79% fewer, almost the same as the raw count. This is a rate adjusted for the weather, not the number of detections on those days: all the season's detections are in the numerator.
What is not a field fire
Where the map misleads#
Fixed sources. A blast furnace, a cement kiln or the equipment that burns waste gas at a refinery gives detections year after year in the same place. The rings on the map mark places with repeated detections, most likely industrial sources; those with most are at Galați, Hoghiz, Fieni and Șoimuș. Any square with detections on at least 8 days in at least 4 years was removed from the count: 127 squares, with 18,037 detections.
Days with no data. The satellite went into safe mode on 26 July 2022, and the archive has no detection, in any country of the region, between 27 July and 10 August; another 10 days are missing from July 2024. They are marked in blue in the calendar. The percentage falls are counted per working day; the yearly numbers are the raw ones.
The Delta and the forest. Reedbeds and woodland edges burn too, but they are not stubble: 10,791 detections in marshes and 14,621 in forest and scrub are on this map, and not in the count for the fields.
A check with another instrument
Two instruments, the same fall#
One device can break, or have its software changed. NASA has a second, older instrument on two other satellites: MODIS, which measures squares one kilometre across. It records about a quarter of the detections VIIRS does, but has done so since 2001.
Detections on arable land, July–October: VIIRS (bars) and MODIS (line; its count is multiplied by four). 2012: 9,297 / 2,509, 2013: 8,847 / 2,366, 2014: 8,524 / 2,402, 2015: 6,575 / 1,610, 2016: 11,274 / 2,870, 2017: 7,256 / 2,126, 2018: 6,876 / 2,237, 2019: 9,164 / 2,729, 2020: 4,449 / 1,224, 2021: 6,450 / 1,899, 2022: 1,372 / 430, 2023: 2,227 / 602, 2024: 1,592 / 524, 2025: 1,919 / 465 Until 2021 the two counts rise and fall together year by year (correlation 0.94). In 2022, the year of the fall, the Aqua satellite, which kept working through those days, had 21% of its 2012–2021 average; VIIRS, per working day, 20%.
MODIS shows one more thing: summer detections had already fallen once before. In 2004–2008 there were 3,168 a year in July–August; in 2012–2017, 1,418.
The same count in seven countries
Detections fell in neighbouring countries too#
Falls just as large appear in countries with other laws. On cropland, from July to October, relative to the number of dry, clear days, detections in 2022–2025 stood at this share of their 2012–2017 level: Romania 24%, Bulgaria 24%, the Republic of Moldova 17%, western Ukraine 14%.
Romania24%Bulgaria24%Moldova17%Ukraine (west)14%Serbia73%Hungary78%Poland84%Detections on cropland per dry, clear day, July–October; each country on its own scale. Further west and north, where detections were few to begin with, the change is small: Serbia 73%, Hungary 78%, Poland 84%.
Scroll: the map of the region moves from the first six years to the last four.
Summer 2021 – autumn 2022
What the law changed, and when#
Farmers receiving subsidies have been forbidden to burn stubble since 2010; before that it was allowed with a permit. The environmental fine stood for 16 years at 3,000–6,000 Romanian lei. An emergency ordinance published on 7 April 2022 raised it to 7,500–15,000 lei for a person and 50,000–100,000 lei for a company, removed the permit altogether and obliged owners and holders of land not to burn and to prevent burning.
The fall comes at the first harvest after the ordinance. Of the 11 years at which the series can be divided in two, the division at 2022 describes it best (84% of the variation). In Ukraine fines rose eighteenfold in April 2020, and its fall also dates from 2020.
But Bulgaria has the same fall in 2020, with fines unchanged since 2007, and in the Republic of Moldova detections have been falling since 2018. From 2023, in Romania, the subsidies have new rules and the paying agency monitors the land by satellite. The data show when the fires became fewer, not how much of that is due to the fines.
The fire service's own count
The fire service's call-outs have not fallen#
Romania's fire and emergency service, IGSU, publishes its call-outs every year: a count made on the ground. Under "stubble burning": 869 in 2012, 1,542 in 2016, 875 in 2022, 1,238 in 2025. On average 892 a year in 2012–2017 and 1,014 in 2022–2025. No fall at all.
Fire-service call-outs to stubble fires (line) and satellite detections on arable land after the harvest (bars). 2012: 9,297 / 869, 2013: 8,847 / 653, 2014: 8,524 / 491, 2015: 6,575 / 638, 2016: 11,274 / 1,542, 2017: 7,256 / 1,156, 2018: 6,876 / 994, 2019: 9,164 / 1,443, 2020: 4,449 / 757, 2021: 6,450 / 1,454, 2022: 1,372 / 875, 2023: 2,227 / 1,056, 2024: 1,592 / 887, 2025: 1,919 / 1,238 The two counts do not measure the same thing. The satellite records heat at the time it passes; the fire service counts call-outs, over the whole year. In 2012–2017 there were 9.7 detections on arable land after harvest for every stubble call-out; in 2022–2025, 1.8.
So the burning might only have moved to hours when the satellite does not pass. Its trace cannot move: a burnt field stays black for days. In images from the European satellite Sentinel-2, on 60 one-kilometre squares chosen at random in the eight counties with most detections, the area blackened after harvest fell, between the years 2018, 2019 and 2021 and the years 2023–2025, from 51.4 to 19.3 hectares per thousand hectares of arable land, per 100 days of observation: 38% remained, with a margin from 21% to 62%. In the same counties and years, detections stood at 29%.
The measurement has a serious weakness, though: the rule that recognises a burn sometimes takes freshly ploughed soil, or an image under thin cloud, for one. Of 12 cases drawn at random and looked at one by one, 4 look like burns, 5 look like something else, and 3 cannot be judged. The rule fixed beforehand required the upper end of the margin to be below 60%; it is 62%, and the margin does not include these errors. The verdict is “cannot tell”: the marked area fell, but the test cannot establish whether, or by how much, the area truly burnt fell. One thing depends less on the rule’s small errors: large blackenings, more than 20 hectares at once in one square, numbered 12 in the three years before and 1 in the three after.
Why the call-outs have not fallen too, the count cannot say. One possibility: the fires that remain are reported more often. A farmer whose land burned against their will avoids the paying agency's penalty by showing the fire service's intervention report. That is a hypothesis: the page has no data to test it.
February–April
Spring shows no fall as clear#
Spring detections swing widely from one year to the next: 4,328 on arable land in 2012, 400 in 2018, 2,869 in 2022. Scroll from the average of the first years to the spring of 2022: the map is just as full.
Each of the past three springs had at most 871 detections, but there were few in Bulgaria, Hungary and Poland as well. Recent springs were quieter; why, and for how long, cannot yet be said.
The large fires of the Danube Delta and the mountains are on another map: Where Romania burned.
Fire detections in any commune or town
A commune is a rural local authority covering one or more villages; towns and cities are separate. Romania has 3,186 of them in all, counting Bucharest's six districts. Type the name of one, or click it on the map, to see how many fire detections it has on farmland, on which day there were most, and how 2022–2025 compares with 2012–2017.
Choose a commune or town, from the list or with a click on the map, to see its detections, year by year.
Drag the map with the mouse or use the buttons.
How it was counted
The data come from the country archives of NASA’s FIRMS service: every thermal detection by the VIIRS instrument on the Suomi NPP satellite, at a resolution of 375 m, from 23 January 2012 to 30 December 2025. Within Romania’s administrative boundaries there are 200,961 records, each with its date, time, position, radiated power and type.
What was counted
Detections that NASA types as a vegetation fire (type 0) were kept. Version 2 of the data, the one in the country archives on the day of download, has a known defect: it sometimes leaves fixed sources labelled as vegetation fires (the product guide, section 6.1). So one more rule was applied: any 400 m square with detections on at least 8 different days in at least 4 different years was removed whole. The rule removes 127 squares with 18,037 detections and catches 99.8% of those NASA marks as fixed sources. It also removes 1,910 detections labelled as vegetation fires, 245 of them on arable land; if some of those were vegetation fires repeated in one place, they were lost. 182,545 detections remain.
Each detection was assigned a land type, from Corine Land Cover 2018 (a European land-use map, at 100 m), and its commune or town. “Farmland” here means arable land, mixed farmland, pasture and grassland, vineyards and orchards: 14.1 million hectares, with 151,479 detections (83% of the total). “Arable land” means arable land proper (Corine classes 211–213): 8.7 million hectares, with 112,922 detections.
Natural grassland (Corine class 321) is counted here as farmland, beside pasture (231), although Corine files it under semi-natural areas. It has 3,297 detections, 2.2% of the 151,479, and 72% of them fall in spring. The count on arable land, with its fall of 78%, does not include them. Without them, 1,566 of the 3,158 communes and towns ranked within their county keep their place, 2,741 move by at most two places, and first place changes in 3 counties.
The Corine map has a 100 m grid, but the smallest patch drawn on it is 25 hectares, larger than the square of one detection: a small field among pastures can be mapped as pasture, and the reverse. The commune comes from administrative boundaries, not from Corine. The fall appears with both maps tried and with no map. Counted per day with satellite data, what remained after the harvest is 22% on Corine arable land, 25% on all farmland, 24% on cropland in a different map made from different images (Copernicus Global Land Cover, described below; there without the fixed-source rule), and 29% for all retained detections with no land map at all. The map dates from 2018 and is the same for every year: land that changed use is miscounted, but the fall is there without any map.
The harvest season is counted from 1 July to 31 October and spring from 1 February to 30 April. A day counts as having no data when the archive has no detection in any of the seven countries, between April and October: 32 days, 15 of them in summer 2022. NASA says the satellite’s data were lost between 26 July and 20 August 2022 (the notice); in the archive, detections return from 11 August.
Rain and cloud
For each country, the 15 grid squares of half a degree of latitude and longitude with most detections on cropland from July to October in 2012–2017 were chosen. Daily rain and cloud for the centre of each come from ERA5, a reconstruction of past weather from measurements and a weather model (through Open-Meteo). In one square, a day is “dry and clear” when under 1 mm of rain fell on that day and on each of the two before it, and mean cloud cover was under 50%. A season’s number of dry, clear days is the average over the 15 squares, each weighted by its number of detections in 2012–2017; days without data are not counted. The rate is all the season’s detections in the whole country (not only those on dry, clear days) divided by that number of days; it is a weather-adjusted rate: for Romania, on Corine arable land, 151 a day in 2012–2017 and 32 in 2022–2025. In the comparison with the neighbours, detections on cropland in the shared map are divided by the same kind of day count. The thresholds were fixed before the count. The adjustment allows for rain and cloud, not for wind, temperature or the weather elsewhere.
The neighbours
Corine does not cover Ukraine or the Republic of Moldova, so the comparison between countries uses one map for all: Copernicus Global Land Cover at 100 m, class “cropland”. It also keeps every type-0 detection in each country’s file, without the fixed-source rule and without filtering detections against local administrative boundaries. That is why Romania’s numbers in the neighbours table differ from the arable-land numbers. Of Ukraine, only the part west of 32° east was counted.
The year of the fall
For each year from 2014 to 2024 the series was divided in two, before and after that year, and the share of its year-to-year variation removed by the division was computed. The series is the logarithm of detections per dry, clear day, on cropland; the logarithm makes the test compare proportional changes. The division at 2022 explains 84%, the most of the 11 years. With 2022 left out, the best division is at 2023, the first year left after 2021.
Traces in the fields: the check with Sentinel-2
The fire service sees no fall, and the satellite with the heat sensor passes only a few times a day. To find out whether less land was burned or only at other hours, the traces were counted: the black patches left on fields, which show in Sentinel-2 images (10–20 m, a pass every few days) whatever the hour of the fire.
60 one-kilometre squares were chosen at random, centred on arable land, in the eight counties with most detections after harvest in 2012–2017 (Dolj, Teleorman, Olt, Mehedinți, Călărași, Constanța, Giurgiu, Timiș). For 2018, 2019 and 2021, then 2023, 2024 and 2025, every pair of consecutive clear images between 25 June and 5 November, at most 20 days apart, was compared. A 20 m point counts as burnt when it darkens abruptly in the infrared and takes on the signature of ash: as bright at 2.2 microns as at 1.6.
The rule and the threshold for the verdict were written down before the result. The first rule, without the ash signature, failed: it also marked freshly ploughed soil as burnt. The second was chosen from spectra measured in 22 windows around detections and 5 windows of ploughed soil; those windows touch 4 of the 60 squares.
The second processing
The first processing of the images, the one first published, had faults that an outside review found. The cloud mask was used only to accept or reject a whole image, not point by point. For 2018–2021 the image catalogue holds two versions of most images (the processing of the time and one redone in 2023–2024), and the script took whichever it met first; it also read at most a hundred records a season, so in the years with two versions the start of the season was sometimes missing. The correction of 1,000 units that newer images need was decided from a catalogue label known to be wrong at times: 6 images were corrected twice.
All 60 squares were read again under rules written first: one image tile per square, the newest version of each image, the correction decided from the image’s own values (none of the 11,382 images read needs it), a cloud and shadow mask point by point at both ends of each pair, and the arable map brought onto the image grid. After the check below showed a control field marked because of thin cloud the mask did not see, a cloud filter on the blue band was added, before any result for the squares. The filter removed 520 of the images read, 262 of them from 2025.
The result of the second processing: 51.4 blackened hectares per thousand hectares of arable land per 100 days of observation in 2018, 2019 and 2021, 19.3 in 2023–2025. 38% remained, with a 95% interval from 21% to 62% when the squares are resampled and from 18% to 69% when the years are resampled too. The intervals do not include the rule’s own errors. By year: 60.0, 41.4 and 53.6, then 19.1, 21.3 and 17.3; 2020, measured afterwards, has 53.3. The first processing had given 54.2 and 20.0, that is 37%.
None of the corrections moves the result: with or without the point-by-point mask, with or without the cloud filter, with the catalogue label or the image’s values, with the old arable map or the new, between 36% and 38% remained. Without the 4 squares touched by the choice of rule: 37% (from 19% to 65%). With the first rule, the one that also takes ploughed soil for a burn: 50% (from 36% to 68%). The area is concentrated in few places: five squares hold 46% of everything measured in the first years, and without them 47% remained (from 27% to 75%). In 42 squares the area fell, in 15 it rose. Two of the squares, drawn at random, lie less than 300 metres apart and largely overlap, so they are not independent; without either one the result is the same.
How often the rule is wrong
The check on detections, read again in the same way (there a pair of images may be more than 20 days apart; one case has 25): of 54 detections on arable land chosen at random, with clear images before and after, 39 have a marked patch of at least two hectares around them (19 of 27 in 2018–2021, 20 of 27 in 2022–2025); of the 26 detections with the highest power, 23. But on 79 control fields, points on arable land 5–40 km from a detection with no detection within 3 km in those days, the rule marks a few points in 6 and a patch of at least two hectares in 2 (in the first processing, in none). Looked at, the two are a ploughed field and an image under thin cloud. The absence of a detection does not prove that nothing burned on the others.
The rule written at the start had a third clause: if wrong marks alone could produce more than a third of what was measured in the first years, the verdict is “cannot tell”. The control fields cannot settle this clause. They are windows larger than the squares, read without the arable map and with a single pair of images each, and most of the area marked on them comes from 2020, a year outside the comparison. An earlier version of this page gave an estimate here (73%); it mixed different years and different ways of measuring, and has been withdrawn. The control fields show that the rule makes mistakes, not how often.
The verdict does not depend on that clause. The rule required the upper end of the interval to be below 60%; it is 62%, just over the line, and 69% when the years are resampled too. The verdict of the second processing is “cannot tell”. The marked area fell; whether, and by how much, the area truly burnt fell, the test cannot establish.
The images were then looked at, one by one. The three largest blackenings in the sample (between 54 and 99 hectares) look like burns: straw-coloured stubble gone black within two to five days, in one case with streaks left by the wind. Of 12 cases of at least two hectares drawn at random, six from each period, 4 look like burns (2 before, 2 after), 5 look like ploughing, cloud or shadow (2 before, 3 after), and 3 cannot be judged. The judgement was made from images, not on the ground, and was not repeated by a second reader.
What is left: of the 146 blackenings of at least two hectares, those of more than 20 hectares at once number 12 in 2018, 2019 and 2021 and 1 in 2023–2025. This count was made after the results were seen; it is not a test fixed beforehand. It too rests on the same rule. It points the same way as the detections; by how much the burnt area fell, these images cannot say.
Other weaknesses. The squares are few, and three years on each side are not enough to measure the variation between years. The set of ploughed fields on which the rule was chosen is small and only from June–August. The arable map is from 2018. Cloud shadow that the mask does not see is not filtered. The comparison with detections is not quite like for like: detections cover whole counties, from 1 July to 31 October.
What the count cannot say
A detection records heat within one square of ground. It does not show who lit the fire and does not prove an offence. Commune totals do not show individual plots.
The count does not catch everything. In summer the satellite passes at about 2 pm and about 4 am; 16% of detections are at night. A fire lit in the evening and out by night can be missed.
The land map is from 2018. A field since left unworked or built on is still counted as arable.
The 3,186 units are 2,862 communes, 216 towns, 102 cities and the six districts of Bucharest. For each, 2012–2017 is compared with 2022–2025. The first version of this page gave the labels “fewer” and “more frequent” from a test on detections, with no correction for the thousands of comparisons: 1,112 falls and 81 rises. That test was too lenient, because several detections can come from one fire. The present rule was written down before its result. It counts days with fire (one commune, one day, at least one detection: 83,199 across 2012–2025). It allows for their varying from year to year more than a purely random count would (the variance is 1.3–2.0 times larger). Then it corrects for the 2,426 comparisons made at once (the Benjamini–Hochberg method, 5%). 147 falls remain and no rise: none of the 81 rises passed the test. For 2,279 communes and towns the test gives no firm conclusion, which does not mean that nothing changed; 760 have fewer than five days with fire in the periods compared, and 114 of those have no detection at all. The fall is clear for counties and for the country, where the numbers are large; for a single commune, most often, it is not. Days with fire in a row can belong to one fire, and neighbouring communes can share a fire: the labels are flags, and the 5% level is approximate, not guaranteed.
The fall coincides with the year the fines were raised, and falls as large exist in countries with other laws. How much of it is due to the fines, the subsidies, satellite monitoring, the price of straw or habit, the data do not show.
The law, step by step
Fines are for an individual unless stated, in Romanian lei. For the fine raised in 2022, the date in the table is that of publication in the Official Gazette; the date from which it could first be applied was not verified.
| Date | What changed | The penalty |
|---|---|---|
| 29 January 2006 (in force) | Emergency Ordinance 195/2005: stubble may be burned only with the environmental authority’s consent and notice to the fire service | 6,500–7,000 lei |
| 9 July 2006 (date in the legislative portal) | Law 265/2006: the same rule, another fine | 3,000–6,000 lei; companies: 25,000–50,000 lei |
| 1 January 2007 | A condition for subsidy, from EU accession: burning on arable land only with the environmental authority’s consent | reduced payments |
| 18 February 2010 (published) | Order 30/147/2010: for farmers on subsidy, forbidden outright, on arable land and on grassland | normally 3% of payments for negligence and 20% if deliberate; the rates can vary |
| April 2019 | A protocol between the subsidy agency (APIA), the Environmental Guard and the fire service: fires found are passed to the agency (the Environmental Guard’s 2022 report) | |
| 7 April 2022 (published) | Emergency Ordinance 38/2022: forbidden for everyone, with no permit; owners and holders of land must not burn and must prevent burning | 7,500–15,000 lei; companies: 50,000–100,000 lei |
| claim year 2023 | Order 54/570/32/2023: the farm-subsidy rule banning stubble burning (known as GAEC 3), and monitoring of parcels with Sentinel images every five days (APIA’s statement) | 1–10% of payments for negligence; at least 15% if deliberate |
The neighbours in numbers
Detections on cropland from July to October, divided by the season’s number of dry, clear days. The last column is the year at which a single division best describes the country’s series.
| Country | 2012–2017 | 2022–2025 | What remains | Year of the fall |
|---|---|---|---|---|
| Romania | 163.4 | 39.8 | 24% | 2022 |
| Bulgaria | 84.2 | 20.5 | 24% | 2020 |
| Serbia | 50.7 | 37.0 | 73% | 2020 |
| Hungary | 9.7 | 7.5 | 78% | 2015 |
| Republic of Moldova | 39.8 | 6.9 | 17% | 2019 |
| Ukraine, west of 32° E | 436.9 | 61.9 | 14% | 2020 |
| Poland | 16.3 | 13.7 | 84% | 2016 |
The fire service and the satellite, year by year
The call-outs are those in the inspectorate’s annual reports, under “dry vegetation and other fires”, a heading that also covers rubbish fires and whose make-up changed in 2022. Between 2012 and 2021 their total rises and falls with all retained detections (correlation 0.74). In 2012–2017 there were 1.4 detections for every call-out; in 2022–2025, 0.4. Call-outs to stubble fires are 6.8% of the total.
| Year | Call-outs to dry vegetation and other fires | of which stubble | Detections on farmland | Detections on arable land, July–October |
|---|---|---|---|---|
| 2012 | 20,454 | 869 | 20,642 | 9,297 |
| 2013 | 6,978 | 653 | 11,415 | 8,847 |
| 2014 | 6,058 | 491 | 12,547 | 8,524 |
| 2015 | 10,076 | 638 | 11,225 | 6,575 |
| 2016 | 11,165 | 1,542 | 13,707 | 11,274 |
| 2017 | 15,248 | 1,156 | 13,468 | 7,256 |
| 2018 | 11,247 | 994 | 9,658 | 6,876 |
| 2019 | 22,095 | 1,443 | 16,406 | 9,164 |
| 2020 | 16,216 | 757 | 11,302 | 4,449 |
| 2021 | 12,885 | 1,454 | 9,378 | 6,450 |
| 2022 | 23,772 | 875 | 8,889 | 1,372 |
| 2023 | 13,127 | 1,056 | 3,541 | 2,227 |
| 2024 | 20,478 | 887 | 4,394 | 1,592 |
| 2025 | 17,786 | 1,238 | 4,907 | 1,919 |
The counties
Detections on farmland over the fourteen years, then how many that makes per year per 1,000 hectares of farmland. The last two columns: the yearly average of detections on arable land after the harvest, in 2012–2017 and in 2022–2025.
| County | Detections 2012–2025 | Per year per 1,000 ha | After harvest, 2012–2017 | After harvest, 2022–2025 |
|---|---|---|---|---|
| Dolj | 16,562 | 1.99 | 1,397 | 392 |
| Teleorman | 15,496 | 2.21 | 1,387 | 260 |
| Mehedinți | 11,606 | 2.87 | 725 | 274 |
| Olt | 9,107 | 1.46 | 792 | 149 |
| Timiș | 7,441 | 0.78 | 449 | 59 |
| Giurgiu | 6,369 | 1.63 | 452 | 125 |
| Călărași | 6,228 | 1.01 | 524 | 93 |
| Caraș-Severin | 5,813 | 1.34 | 28 | 14 |
| Arad | 5,462 | 0.82 | 241 | 26 |
| Constanța | 4,620 | 0.57 | 476 | 55 |
| Bihor | 4,161 | 0.65 | 131 | 30 |
| Tulcea | 3,985 | 0.74 | 236 | 24 |
| Mureș | 3,230 | 0.61 | 108 | 13 |
| Vaslui | 3,087 | 0.53 | 183 | 12 |
| Sibiu | 3,030 | 0.78 | 24 | 4 |
| Cluj | 2,606 | 0.47 | 29 | 4 |
| Alba | 2,582 | 0.55 | 44 | 4 |
| Gorj | 2,561 | 0.85 | 32 | 21 |
| Hunedoara | 2,540 | 0.73 | 19 | 6 |
| Galați | 2,473 | 0.48 | 161 | 8 |
| Ialomița | 2,427 | 0.45 | 188 | 33 |
| Satu Mare | 2,419 | 0.53 | 93 | 9 |
| Brăila | 2,393 | 0.42 | 152 | 11 |
| Dâmbovița | 2,106 | 0.63 | 85 | 37 |
| Buzău | 2,064 | 0.38 | 75 | 10 |
| Bacău | 1,990 | 0.47 | 46 | 5 |
| Iași | 1,986 | 0.37 | 65 | 6 |
| Brașov | 1,921 | 0.52 | 47 | 7 |
| Argeș | 1,645 | 0.37 | 116 | 15 |
| Prahova | 1,617 | 0.45 | 62 | 13 |
| Maramureș | 1,513 | 0.43 | 8 | 3 |
| Botoșani | 1,424 | 0.26 | 14 | 2 |
| Bistrița-Năsăud | 1,278 | 0.33 | 10 | 2 |
| Vâlcea | 1,265 | 0.42 | 26 | 10 |
| Vrancea | 1,254 | 0.36 | 43 | 8 |
| Sălaj | 1,234 | 0.39 | 10 | 4 |
| Suceava | 937 | 0.19 | 35 | 6 |
| Neamț | 912 | 0.25 | 40 | 3 |
| Harghita | 857 | 0.21 | 12 | 2 |
| Covasna | 723 | 0.32 | 27 | 2 |
| Ilfov | 530 | 0.39 | 37 | 12 |
| București | 25 | 0.54 | 0 | 0 |
The communes and towns with most detections
The first 50 by number of detections on farmland. The middle columns are the totals for 2012–2017 (six years) and 2022–2025 (four years). The last column: detections per year per 1,000 hectares of farmland.
| Commune or town (county) | Detections | 2012–2017 | 2022–2025 | Per year per 1,000 ha |
|---|---|---|---|---|
| Băilești (Dolj) | 998 | 567 | 121 | 4.8 |
| Gogoșari (Giurgiu) | 786 | 338 | 118 | 4.9 |
| Pietroșani (Teleorman) | 713 | 239 | 187 | 6.3 |
| Moțăței (Dolj) | 702 | 331 | 122 | 4.2 |
| Dârvari (Mehedinți) | 697 | 426 | 54 | 8.1 |
| Plenița (Dolj) | 692 | 296 | 149 | 6.5 |
| Piatra (Teleorman) | 630 | 247 | 43 | 6.2 |
| Gârla Mare (Mehedinți) | 626 | 265 | 52 | 8.8 |
| Bălăcița (Mehedinți) | 609 | 305 | 77 | 4.7 |
| Zimnicea (Teleorman) | 561 | 293 | 62 | 3.5 |
| Vlădaia (Mehedinți) | 546 | 311 | 84 | 5.2 |
| Oprișor (Mehedinți) | 535 | 309 | 64 | 5.3 |
| Pătulele (Mehedinți) | 535 | 285 | 79 | 5.1 |
| Ștorobăneasa (Teleorman) | 513 | 301 | 72 | 4.6 |
| Jiana (Mehedinți) | 510 | 181 | 103 | 4.0 |
| Prundu (Giurgiu) | 506 | 314 | 75 | 2.3 |
| C. A. Rosetti (Tulcea) | 489 | 288 | 101 | 4.9 |
| Maglavit (Dolj) | 480 | 262 | 56 | 4.2 |
| Obârșia de Câmp (Mehedinți) | 476 | 292 | 30 | 9.1 |
| Poiana Mare (Dolj) | 458 | 201 | 83 | 3.1 |
| Unirea (Dolj) | 458 | 213 | 87 | 7.2 |
| Segarcea (Dolj) | 441 | 338 | 16 | 2.7 |
| Giurgița (Dolj) | 434 | 339 | 28 | 4.5 |
| Chirnogi (Călărași) | 429 | 251 | 39 | 1.8 |
| Dăbuleni (Dolj) | 410 | 193 | 61 | 2.1 |
| Lisa (Teleorman) | 401 | 173 | 60 | 4.0 |
| Fântânele (Teleorman) | 399 | 115 | 51 | 7.1 |
| Dor Mărunt (Călărași) | 398 | 225 | 23 | 1.9 |
| Putineiu (Giurgiu) | 396 | 141 | 33 | 3.4 |
| Gruia (Mehedinți) | 393 | 196 | 48 | 5.5 |
| Viișoara (Teleorman) | 393 | 212 | 24 | 8.2 |
| Afumați (Dolj) | 392 | 248 | 26 | 4.3 |
| Devesel (Mehedinți) | 372 | 108 | 76 | 3.2 |
| Crișan (Tulcea) | 366 | 351 | 4 | 9.7 |
| Vedea (Giurgiu) | 364 | 108 | 67 | 4.1 |
| Mârzănești (Teleorman) | 350 | 196 | 57 | 3.1 |
| Suhaia (Teleorman) | 345 | 191 | 42 | 5.1 |
| Redea (Olt) | 339 | 232 | 31 | 2.0 |
| Țigănești (Teleorman) | 336 | 177 | 80 | 4.2 |
| Leu (Dolj) | 335 | 226 | 23 | 2.2 |
| Băneasa (Giurgiu) | 334 | 209 | 26 | 2.4 |
| Pădina (Mehedinți) | 330 | 190 | 55 | 3.2 |
| Gogoșu (Mehedinți) | 322 | 104 | 112 | 3.0 |
| Bărcănești (Ialomița) | 322 | 193 | 19 | 2.4 |
| Variaș (Timiș) | 322 | 200 | 17 | 2.1 |
| Caraula (Dolj) | 321 | 160 | 79 | 6.9 |
| Castranova (Dolj) | 321 | 152 | 24 | 4.0 |
| Braniștea (Mehedinți) | 319 | 146 | 46 | 7.2 |
| Bujoru (Teleorman) | 318 | 101 | 52 | 7.8 |
| Bragadiru (Teleorman) | 314 | 144 | 27 | 3.0 |
The data, to download
The tables the page is made from, in three CSV files and one JSON file: detections by day (farmland and arable land, with the days without data marked), the counties by year, the communes and towns by year (with days with fire and the label) and a sheet with the rules, the sources and the version. Column names are in Romanian. The raw detections can be downloaded from NASA, at the address in the sources.
What else exists on the subject
On vegetation fires in Romania there is a series of reports with the fire service’s counts by county (PressOne, “România arde”, 2023, in Romanian) and a conference paper that combines NASA’s fire data with the Corine map for 2001–2022 (Mattes, Marzolff and Feurdean, 2024) and finds a fall in fires on arable land after 2007. For Ukraine there is a measurement on arable land (Hall and colleagues, 2021) and a journalistic map (Texty).
None of them gives the number of detections by commune, a comparison of Romania with its neighbours around a change of law, or the series of detections after 2022.
Where Romania burned shows something else: the burnt perimeters mapped by the European service EFFIS between 2016 and 2026. The largest are in the Danube Delta; Tulcea county has 58.6% of the mapped burnt area. That page has the perimeters of large fires, with their area; this one, the daily detections in the fields.
Sources
- Detections: NASA FIRMS country archives, VIIRS S-NPP 375 m (product VNP14IMG, collection 2) and MODIS (MCD14ML), firms.modaps.eosdis.nasa.gov/country, downloaded on 11 October 2026. In the wording NASA asks for: “We acknowledge the use of data and/or imagery from NASA’s Fire Information for Resource Management System (FIRMS) (https://earthdata.nasa.gov/firms), part of NASA’s Earth Science Data and Information System (ESDIS).”
- Land: Corine Land Cover 2018, European Environment Agency, Copernicus Land Monitoring Service; Copernicus Global Land Cover 100 m, 2019 (Buchhorn and colleagues, CC BY 4.0).
- Weather: ERA5 (Copernicus/ECMWF), through Open-Meteo, CC BY 4.0.
- Images: Sentinel-2, Copernicus data, read from the Earth Search catalogue.
- Commune boundaries: geo-spatial.org, based on data from ANCPI, Romania’s land registry agency, CC BY-SA 4.0, version of 26 March 2025. Borders on the regional map: Natural Earth.
- Fire service: the General Inspectorate for Emergency Situations (IGSU), its yearly statistical analysis of emergency response, one report for each year from 2012 to 2025 (in Romanian): 2012, 2013, 2014, 2015, 2016, 2017, 2018, 2019, 2020, 2021, 2022, 2023, 2024, 2025.
- Laws (in Romanian unless noted): Emergency Ordinance 195/2005, Law 265/2006, Emergency Ordinance 38/2022 (Official Gazette 344 of 7 April 2022), Order 30/147/2010, Order 54/570/32/2023; the rule on fires against the farmer’s will: APIA Bacău’s statement of 12 March 2025; Ukraine: Law 556-IX of 13 April 2020 (in Ukrainian); Bulgaria: the Agricultural Land Protection Act, art. 41a (in Bulgarian).