Romania · anatomy of a detour
If this bridge
disappears
Slobozia–Hârșova: closing Giurgeni–Vadu Oii Bridge would add 59 minutes in the model. Close it on the map and follow the detour.
Simulation based on OpenStreetMap · 6 September 2026. Modelled times, without traffic, ferries or routes abroad. Crossing in OSM ↗
Loading the simulation…
Select a dot to close that crossing in the model. © OpenStreetMap
Slobozia → Hârșova
Selected journey0 h 57 min
With crossing open · 61 km0 h 57 min
With crossing open · 61 km+0 min
Estimated extra timeModelled travel times. The closure is hypothetical.
What the road line conceals
A bridge fits in a dot. Its detour can span a country.
A road map tells you where a road goes. Closing a crossing reveals how much a journey depends on it.
The distance between two riverbanks says little about the journey between them. If a crossing closes, you must reach another bridge and return along the opposite bank. Two nearby places can end up at opposite ends of a long detour.
The map keeps the roads and removes one crossing at a time. It then searches again for the route with the lowest estimated travel time. The orange line shows the answer for the selected journey.
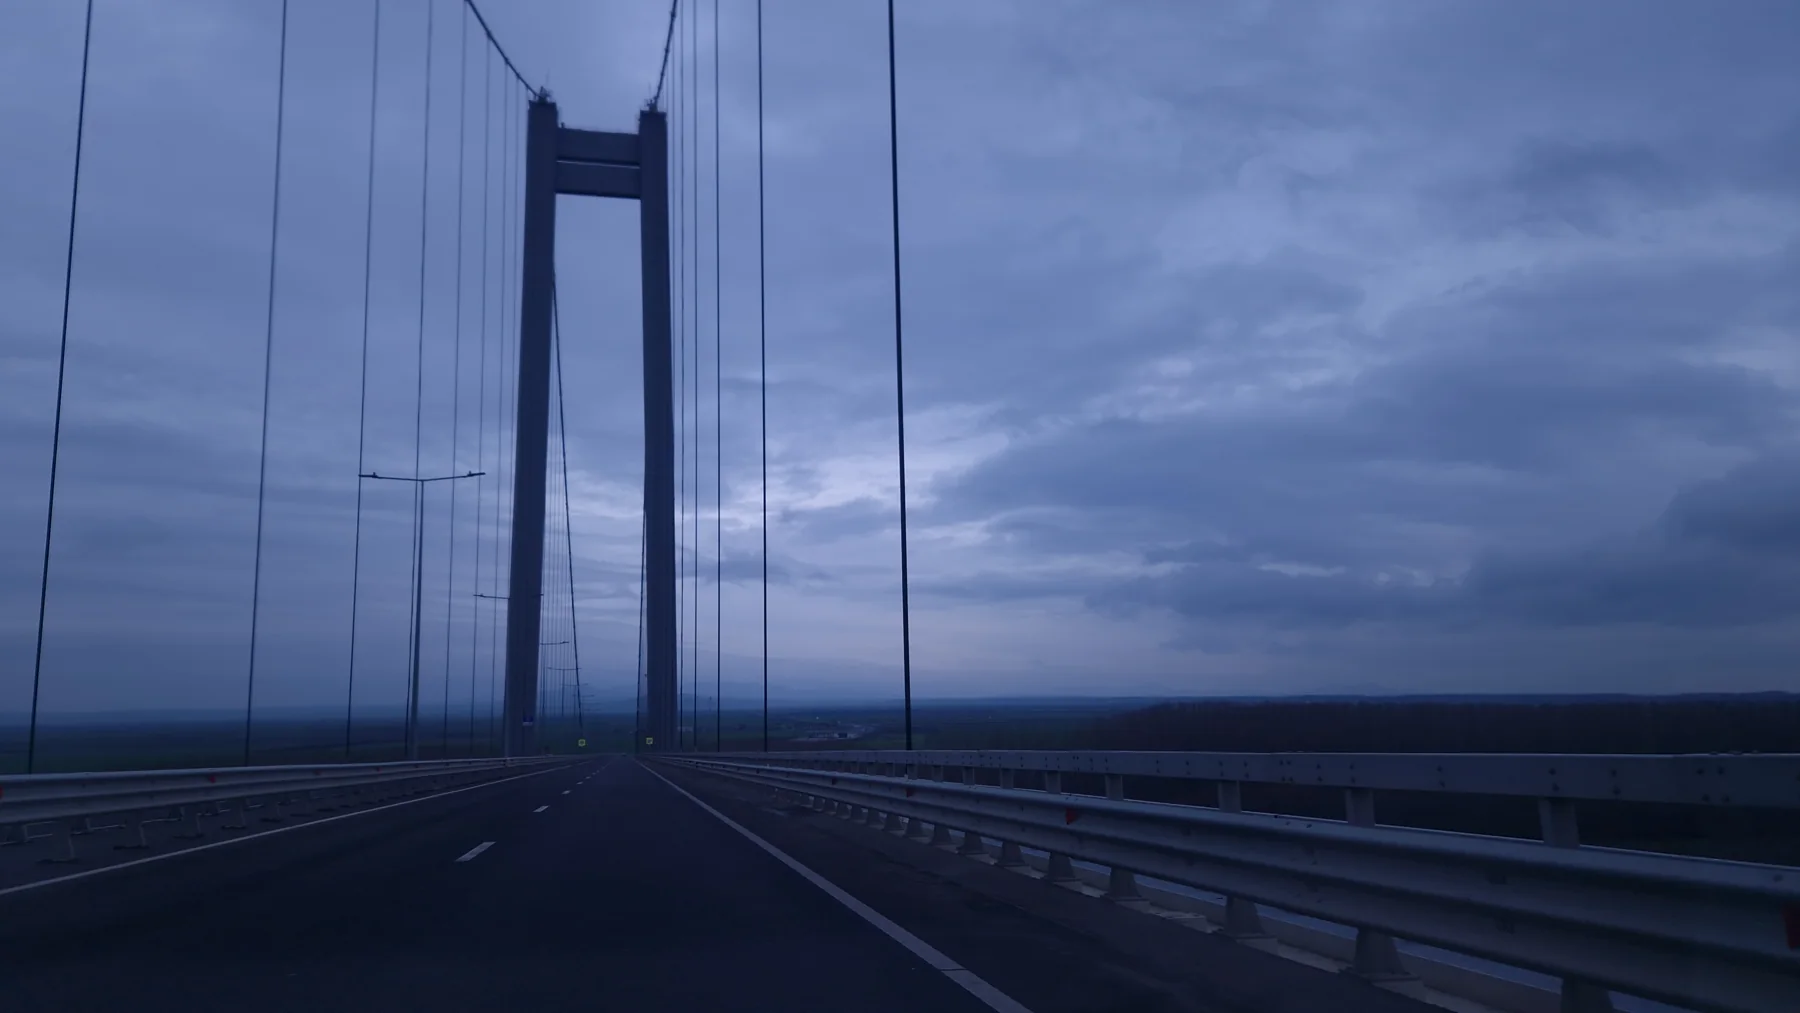



Look beyond the bridge
Find the next crossing
A network with many roads can still have few river crossings. Follow the line all the way: the alternative can take you far from the closed crossing.
Change the journey too. The same bridge can matter greatly to one city pair and very little to another. The table uses the same set of journeys for every closure so this difference remains visible.
Try another crossing ↑The same test for every crossing
Where the detours add up
We show 18 of the 48 tested closures. The displayed closures are ordered by average added time across the analysed journeys. The average includes journeys that remain unchanged.
| Crossing closed in the model | Affected / analysed routes | Mean added time¹ | Largest detour² |
|---|---|---|---|
| 152 / 1560 | +5.8 min | +104 min | |
| 152 / 1560 | +5.8 min | +104 min | |
| 320 / 1560 | +4.4 min | +24 min | |
| 320 / 1560 | +4.4 min | +24 min | |
| 320 / 1560 | +4.4 min | +24 min | |
| 320 / 1560 | +4.4 min | +24 min | |
| 320 / 1560 | +4.4 min | +24 min | |
| 320 / 1560 | +4.4 min | +24 min | |
| 320 / 1560 | +3.9 min | +24 min | |
| 373 / 1560 | +3.8 min | +18 min | |
| 320 / 1560 | +3.8 min | +27 min | |
| 320 / 1560 | +3.8 min | +27 min | |
| 46 / 1560 | +1.8 min | +126 min | |
| 75 / 1560 | +1.1 min | +68 min | |
| 56 / 1560 | +0.5 min | +14 min | |
| 43 / 1560 | +0.4 min | +25 min | |
| 125 / 1560 | +0.1 min | +1 min | |
| 70 / 1560 | +0 min | +1 min |
A route counts as affected when its increase exceeds 30 seconds. ¹ Average added minutes for city pairs that remain connected. ² Largest time increase for one journey in the sample. Each detour is compared with that same journey’s baseline route.
Selection and limits are explained below. The table describes this experiment; results do not measure traffic, bridge condition or the likelihood of closure.
How we calculated it
Real roads.
Hypothetical closures.
Simulation based on OpenStreetMap · 6 September 2026. Modelled times, without traffic, ferries or routes abroad.
What enters the network
Roads come from the Geofabrik OpenStreetMap extract for Romania. Intersections connect directed segments; one-way roads constrain which direction a route can follow. Each segment’s length and assigned speed determine its estimated time.
What we close
A bridge can appear as several map segments, including separate carriageways. Closures group segments belonging to the same crossing. For listed roads, the identified segment is removed. Every scenario starts from the original network: closures do not accumulate.
What we compare
We analyse 1,560 directed journeys between 40 cities. Outbound and return routes are calculated separately. Of 2,755 bridge groups used by baseline routes, we tested the 40 used by the most routes, alongside named crossings and four road sections. In total: 48 tested closures; 18 displayed.
This selection favours crossings used by many sampled routes. A rarely used bridge can cause a large detour and still be absent from the selection. Grouping nearby segments on the same road is distinct from an engineering bridge inventory.
Cities and assumed speeds
București · Constanța · Brăila · Galați · Tulcea · Fetești · Cernavodă · Hârșova · Buzău · Ploiești · Brașov · Sibiu · Pitești · Râmnicu Vâlcea · Craiova · Slatina · Drobeta-Turnu Severin · Târgu Jiu · Timișoara · Arad · Oradea · Cluj-Napoca · Deva · Alba Iulia · Târgu Mureș · Bistrița · Baia Mare · Satu Mare · Suceava · Botoșani · Iași · Bacău · Piatra Neamț · Vaslui · Focșani · Sfântu Gheorghe · Alexandria · Giurgiu · Călărași · Slobozia
Assumed speeds: motorway 105 km/h; trunk 80; primary 65; secondary 55; tertiary 45; residential 25. Classification follows OpenStreetMap tags. A lower numeric speed limit reduces the assigned speed. The data file contains the full list.
Calculated network: 967,826 vertices and 2,226,894 directed links. Cities are attached to the nearest vertex of the main component. Maximum attachment distance: 0.123 km.
Where the model stops
Times are estimates on a map, without traffic or a complete set of turn restrictions. Assigned road speeds simplify actual driving. Ferries and detours through neighbouring countries are excluded. A missing route can result from these limits or incomplete data.
Analysed cities are not weighted by population or trip volumes. Results do not estimate how many people would be isolated. That would require attaching all settlements, population data and real access alternatives to the network.
Sources and reuse
Geofabrik · Romania OpenStreetMap extract© OpenStreetMap contributors · ODbL 1.0OpenStreetMap · highwayOpenStreetMap · oneway
Geometry and derived results are available under ODbL 1.0. Photographs carry their author, date and license beside each image.