Chapter 8 · Earth’s environmentsLesson 8.6Humanities track
Environmental degradation: deforestation, desertification and the impact of human activity on natural environments
How can you tell whether people have degraded a place, and by how much?
Before you read: what do you think?
Romania’s National Forest Inventory measures forests on the ground. What did it find about their area between the 2013–2018 and 2020–2025 cycles?
See the answer
It rose slightly. It rose slightly: from 6.93 to 7.03 million hectares. The area is not shrinking. The question is how much timber leaves the forest, and the harvest figures need checking.
In 1960, the Aral Sea in Central Asia covered about 68,000 km² and was the fourth largest lake in the world. The water of the two rivers that fed it was diverted to cotton fields. Today Aralkum, the youngest desert on Earth, stretches across its dried-up bed.
Environmental degradation takes many forms
At the Aral Sea, the answer is visible from space: the lake covered about 68,000 km² in 1960, and today a desert stretches across its dried-up bed. Compare the earlier state with the present one, measure the difference and look for the cause. Environmental degradation is the deterioration of a component’s properties (air, water, soil, vegetation or wildlife) until the environment can no longer perform its functions. The main forms are pollution of air, water and soil, soil erosion and salinisation, deforestation, desertification, the drying up of lakes and wetlands, and the loss of species. Some causes are natural (droughts, eruptions, storms), but most degradation today begins with human activity: farming, logging, grazing, mining, industry and cities.
Deforestation: 10.9 million hectares a year
Forests cover 4.14 billion hectares, or 32% of the planet’s land. Deforestation means converting forest to another land use: pasture, cropland, road or city. A felled area where forest grows back does not count as deforestation. Between 2015 and 2025, an average of 10.9 million hectares a year were deforested worldwide, compared with 17.6 million in the 1990s. Because forest expanded elsewhere, the net loss was 4.12 million hectares a year.
The effects of deforestation spread in a chain: rain washes away exposed soil, floods grow, forest species disappear and carbon in the wood enters the atmosphere.
For the curious
Amazonia, the largest equatorial forest, is monitored by satellite. In its Brazilian part, 5,796 km² were deforested between August 2024 and July 2025, 11% less than in the previous year.
Desertification: land degrades where it lies
The UN Convention to Combat Desertification defines desertification as land degradation in arid, semi-arid and dry sub-humid areas, caused by climatic variations and human activities. The land loses vegetation and fertility in a region that is already dry. The image of a desert advancing over its neighbours with its dunes is misleading. Aridity is a permanent feature of the climate, while drought is a temporary episode; desertification is a change in the land.
In the Sahel, the belt south of the Sahara, droughts have combined with overgrazing, cutting trees for fuel and farming fragile land. At the Aral Sea, the cause was irrigation: in the 1960s, the waters of the Amu Darya and Syr Darya rivers were diverted to crops, the lake split into ever smaller basins, and in 2014 the eastern basin of the South Aral Sea dried up completely. Salty land remained on the dry bed, and fishing disappeared.
For the curious
In the Sahel, the African Union launched the Great Green Wall in 2007, aiming to restore 100 million hectares of degraded land across a belt 8,000 km long.
How to assess human impact on a place
An assessment follows the same steps, wherever the place. Step 1: describe the earlier state, component by component. Step 2: name the intervention and its date. Step 3: measure what changed, using an indicator for each component: hectares of forest, water level, tonnes of fish, number of species. Step 4: check whether the change comes from people or a natural cause, comparing other years and similar places without the intervention. Step 5: assess whether the change can be reversed and what measures would help. Two satellite images, the second less green than the first, are not enough: the difference may come from the season or a temporary drought.
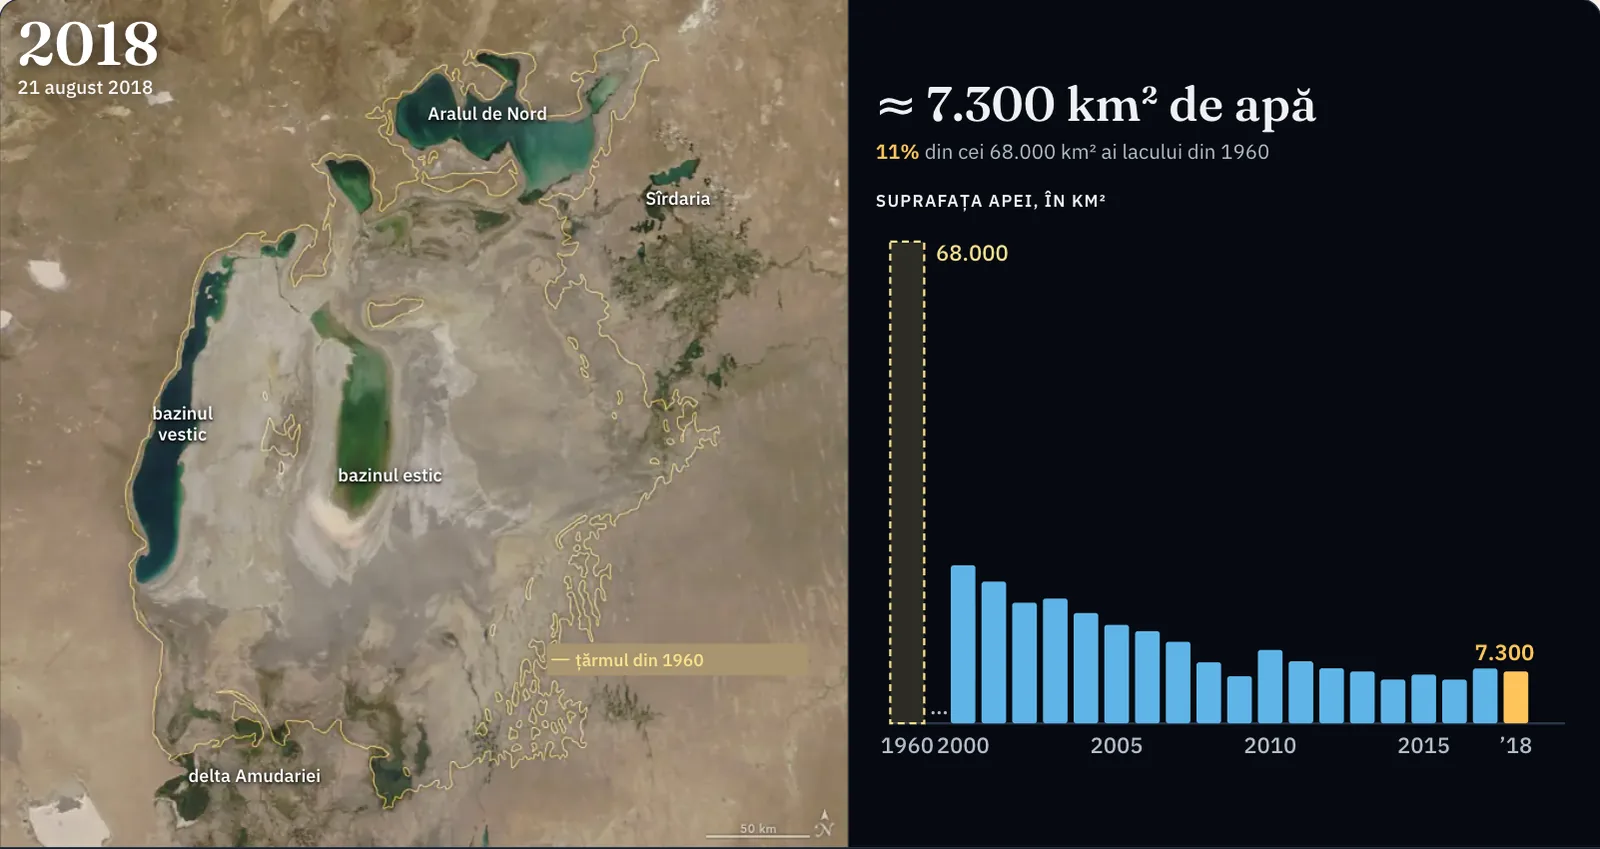
| Date of the photograph | Water, km² | Of the 1960 lake |
|---|---|---|
| 1960 (map, no photograph) | 68,000 | 100% |
| 25 August 2000 | ≈ 22,300 | 33% |
| 15 August 2001 | ≈ 20,000 | 29% |
| 20 August 2002 | ≈ 17,000 | 25% |
| 12 August 2003 | ≈ 17,600 | 26% |
| 16 August 2004 | ≈ 15,600 | 23% |
| 12 August 2005 | ≈ 13,900 | 20% |
| 15 August 2006 | ≈ 13,000 | 19% |
| 16 August 2007 | ≈ 11,500 | 17% |
| 18 August 2008 | ≈ 8,600 | 13% |
| 16 August 2009 | ≈ 6,600 | 10% |
| 26 August 2010 | ≈ 10,400 | 15% |
| 15 August 2011 | ≈ 8,800 | 13% |
| 19 August 2012 | ≈ 7,800 | 11% |
| 25 August 2013 | ≈ 7,300 | 11% |
| 19 August 2014 | ≈ 6,200 | 9% |
| 19 August 2015 | ≈ 6,900 | 10% |
| 21 August 2016 | ≈ 6,200 | 9% |
| 20 August 2017 | ≈ 7,700 | 11% |
| 21 August 2018 | ≈ 7,300 | 11% |
Satellite photographs and calculation. The photographs were taken by the MODIS instrument on the Terra satellite and published by NASA Earth Observatory; the yellow line, drawn by NASA, is the approximate shoreline of 1960, when the lake covered 68,000 km². The water area of each year is an estimate: it is counted on the photograph, pixel by pixel, at the scale of the image (one pixel is 568 m); very turbid, very shallow water is hard to tell from wet lake bed, so the values are rounded to hundreds and may be lower than those obtained by other methods.
Worked example
The world forest balance
Two figures describe the world’s forests between 2015 and 2025: 10.9 million hectares deforested a year and 6.78 million hectares a year of forest gained through planting or natural expansion. The balance: 6.78 − 10.9 = −4.12 million hectares a year. Net loss is therefore smaller than deforestation.
How much is that of the total? 4.12 million ÷ 4,140 million = 0.001, or 0.1% a year. The percentage looks small, but adds up year after year, and a young plantation cannot immediately replace an old forest.
Remember: when reading a forest figure, check whether it refers to deforestation (loss alone) or net change (loss minus gain). The two can differ by more than a factor of two.
In Romania
Forest area is growing, the south is drying
The National Forest Inventory, which measures forests on sample plots in the field, found 7.03 million hectares of forest in the 2020–2025 cycle, compared with 6.93 million in 2013–2018. The area is not shrinking. The question is how much timber leaves the forest: the inventory estimates 28.2 million cubic metres harvested per year, while official statistics recorded 19.65 million cubic metres in 2020. The difference, over 8 million cubic metres a year, cannot all be attributed to illegal logging because the two sources measure different things over different periods; it does show why harvest figures need checking.
Desertification threatens the south and east of the country. The national strategy says that one third of the territory, about 7 million hectares, and 40% of agricultural land lie in areas at risk of desertification; the most exposed are the south of the Romanian Plain, Dobrogea and southern Moldavia. In southern Oltenia, 140,000 ha are sand, and the strategy names Dolj county as severely affected, with shifting sands. Wind erosion affects 378,000 ha across the country.
In brief
- Environmental degradation is the deterioration of the properties of air, water, soil, vegetation or wildlife; its main forms are pollution, soil erosion and salinisation, deforestation, desertification and species loss.
- Deforestation is the conversion of forest to another land use; between 2015 and 2025, 10.9 million hectares a year were deforested worldwide and net loss was 4.12 million hectares a year.
- In the UN definition, desertification is land degradation in arid, semi-arid and dry sub-humid areas caused by climatic variations and human activities; it does not mean advancing dunes.
- Classic examples are the Sahel, degraded by droughts, overgrazing and tree cutting, and the Aral Sea, dried up after the Amu Darya and Syr Darya were diverted for irrigation.
- Human impact is assessed in five steps: the earlier state, the intervention, changes measured with indicators, separation of human and natural causes, and the possibility of recovery.
- In Romania, forests cover 7.03 million hectares, and one third of the territory, especially in the south and east, lies in areas at risk of desertification.
Common mistakes
WrongDesertification means that sand from a desert advances over neighbouring regions.
RightDesertification is land degradation in dry areas where it occurs: soil loses vegetation and fertility. It can happen far from any desert and without dunes.
WrongEvery forest that is cut down is deforestation.
RightDeforestation means the land ceases to be forest: it becomes pasture, cropland or a built-up area. A felled area where forest grows back remains forest in the statistics.
WrongDrought and desertification are the same thing.
RightDrought is a temporary episode of water shortage. Desertification is a lasting change in the land, to which repeated droughts contribute alongside human activities.
Test yourself
Six questions. For the first five you see the explanation at once, with the paragraph of the lesson that supports it; for the ones with a written answer you compare with a good answer.
What does desertification mean in the UN Convention’s definition?
Answer
b) Land degradation in arid, semi-arid and dry sub-humid areas. The definition concerns land degrading in dry areas through climatic and human causes. It contains no dunes, drought or rainfall threshold.
Which situation is deforestation?
Answer
d) A forest cleared and turned into cattle pasture. Only in the last case does the land change use and cease to be forest.
What caused the Aral Sea to dry up?
Answer
a) Diverting river water for irrigation. The lake depended on water from the two rivers. When the water was taken to the fields, evaporation was no longer offset.
You have two satellite images of the same region; the second is less green. Why can you not yet say the region was deforested?
Answer
c) The difference may be due to the season or drought. Before drawing a conclusion, compare images from the same season and look for a possible natural cause.
A country loses 50,000 ha a year to deforestation and gains 30,000 ha of forest through planting and natural expansion. What is the annual net forest loss in hectares?
haAnswer
20,000 ha. Net loss is deforestation minus gain: 50,000 − 30,000 = 20,000 ha.
Near your town, a floodplain was embanked and converted to farmland 50 years ago. Which indicators would you seek to assess the impact, and how would you distinguish the effect of the embankment from that of climate?
A good answer
Compare the area covered by water and reeds, the water table, river levels during floods, the fish catch and agricultural production before and after embankment. To separate the embankment’s effect from climate, track rainfall in the same years and a similar floodplain that remains unembanked. If the changes appear only on the embanked floodplain, human intervention is the cause.
A complete answer names at least three measurable indicators from different components, compares the earlier and later states, and uses a comparison place or period to assess the natural cause.
Terms
- environmental degradation
- Deterioration of the properties of air, water, soil, vegetation or wildlife until the environment can no longer perform its functions.
- deforestation
- Conversion of forest to another land use, such as pasture, cropland or buildings.
- desertification
- Land degradation in arid, semi-arid and dry sub-humid areas caused by climatic variations and human activities.
- aridity
- A permanent feature of a climate in which water lost through evaporation greatly exceeds rainfall.
- drought
- A temporary period when available water is far below the usual level for a place.
- Sahel
- The semi-arid belt south of the Sahara, between desert and savannah.
- indicator
- A measurable quantity used to track the state of an environmental component, such as hectares of forest or water level.
Sources and link to the programme
- FAO – Global deforestation slows, but forests remain under pressure (Global Forest Resources Assessment 2025) – 4.14 billion ha of forest, 32% of land; deforestation 10.9 million ha/year in 2015–2025 versus 17.6 in 1990–2000; net loss 4.12 million ha/year; expansion 6.78 million ha/year
- INPE – Nota técnica: estimativa PRODES 2025 – 5,796 km² deforested in Legal Amazonia between 1 August 2024 and 31 July 2025, 11.08% less than the previous year
- ONU – Convenția pentru combaterea deșertificării, textul convenției (art. 1) – definition of desertification: land degradation in arid, semi-arid and dry sub-humid areas from climatic variations and human activities
- UNCCD – Great Green Wall Initiative – Great Green Wall: launched in 2007 by the African Union, 8,000 km, 100 million hectares to restore by 2030
- ESA – Earth from Space: the shrinking Aral Sea – about 68,000 km² in 1960; fourth largest lake; diversion of rivers for cotton in the 1960s; Aralkum, the youngest desert; salty land; fishing destroyed
- NASA Earth Observatory – World of Change: Shrinking Aral Sea – Amu Darya and Syr Darya; division of the lake; complete drying of the eastern lobe in 2014
- NASA Earth Observatory – The Aral Sea loses its eastern lobe (2014) – in August 2014 the eastern basin of the South Aral Sea was completely dry
- Ministerul Mediului, Apelor și Pădurilor – Inventarul Forestier Național, raport final ciclul III (2020–2025) – 7,027,356 ha of forest; 28.2 million m³ harvested annually
- Inventarul Forestier Național – rezultate ciclul II (2013–2018) – 6,929,047 ha of forest in cycle II
- Ministerul Mediului, Apelor și Pădurilor – Starea pădurilor 2020 – 19,652 thousand m³ of timber harvested in 2020, in official statistics
- Ministerul Mediului, Apelor și Pădurilor – Strategia națională privind prevenirea și combaterea deșertificării și degradării terenurilor – one third of the territory (about 7 million ha) and 40% of agricultural land in areas at risk; most exposed regions; 140,000 ha of sand in southern Oltenia; Dolj, a severely affected area with shifting sands; 378,000 ha affected by wind erosion
From the programme: “Environmental degradation”; “Deforestation and desertification”; “The impact of human activity on the natural environments of Earth” (specialisation curriculum, humanities track). Programme competences covered: 2.2, 5.5.