Chapter 4 · LandformsLesson 4.4
Local relief: reading the land on a map and in the field
How can you tell whether your home is safe from floods and landslides?
Before you read: what do you think?
One village is at 400 m altitude, 2 m above the river. Another is at 40 m altitude, 10 m above the river. Which is more easily reached by a flood?
See the answer
The village at 400 m altitude. The village at 400 m altitude. For flooding, what matters is relative height, the height above the river: 2 m is less than 10 m. At Rast, the houses stood just 5 m above the Danube.
In mid-April 2006, the Danube broke through the dyke near Rast, a village in Dolj county, and covered its houses. The village stood on the floodplain, about 5 m above the river’s usual level. A contour map showed the danger in advance.
The local area and its map
At Rast, two things could be read from the map before the flood: the ground was almost flat, and the houses stood just 5 m above the Danube. The territory around your settlement that you can get to know directly, by walking and looking around, is your local area. Its landforms determine where houses were built, where roads run and what is grown.
On a topographic map, landforms are drawn with contour lines, which join points of equal altitude. The difference in altitude between neighbouring contours is the contour interval, and it is the same across the map. Where contours are close together, the slope is steep; where they are far apart, the ground is almost flat. Closed contours with values increasing towards the centre show a hill or summit.
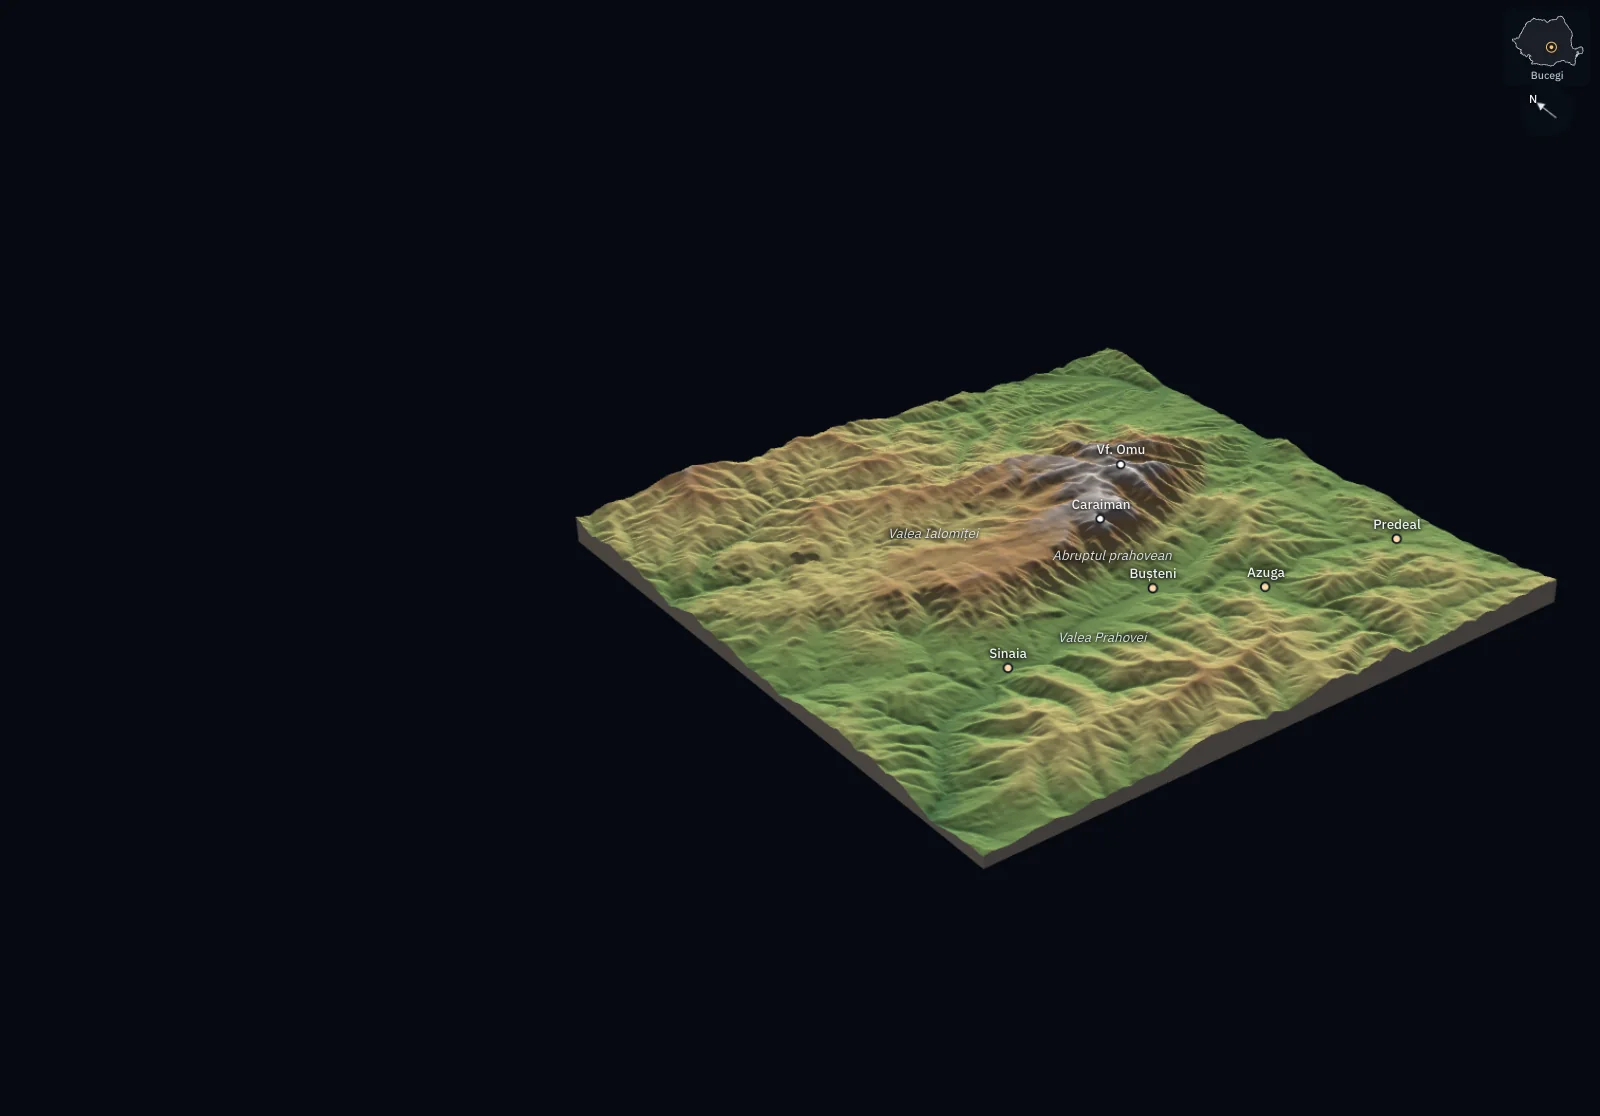
| Profile | Altitude at A | Altitude at B | Difference in level | Horizontal distance | Mean slope | Angle |
|---|---|---|---|---|---|---|
| Bucegi: up the escarpment from Bușteni | 902 m | 2,359 m | 1,457 m | 3.00 km | 49% | 26° |
| Bucegi: across the plateau, towards Babele | 1,907 m | 2,132 m | 225 m | 3.00 km | 7.5% | 4.3° |
| Bucegi: Ialomița Valley – Babele – Bușteni | 1,759 m | 909 m | 850 m | 9.36 km | 9.1% | 5.2° |
| Padiș: through the closed basin of Cetățile Ponorului | 1,256 m | 1,276 m | 20 m | 3.45 km | 0.6% | 0.3° |
| Făgăraș: across the Bâlea Valley | 2,030 m | 2,182 m | 152 m | 1.68 km | 9.0% | 5.2° |
Slope as a percentage is the difference in level divided by the horizontal distance and multiplied by 100. The first two profiles have the same length on the map, 3 km; the first crosses 3.5 times as many contour lines.
Measurements and calculation. Altitudes are measured from satellite (the Copernicus GLO-30 model, one value for about every 30 m; the Bucegi block is averaged to 68 m). It is a model of the surface: under forest it includes the tree canopy. The contour lines, profiles, slopes and closed depressions are calculated from these altitudes; where contour lines would touch on screen, only the 500 m lines are shown. Settlements and summits come from OpenStreetMap; the names of the valleys and the plateau are placed by hand.
Four things to read: altitude, slope, aspect and dissection
Absolute altitude is measured from sea level. Relative height is the difference in level from a nearby reference point, usually the valley floor or the river. For floods, relative height matters: a village at 400 m altitude, just 2 m above the river, is more exposed than one at 40 m altitude and 10 m above the river.
Slope shows how quickly the ground rises. It is calculated by dividing the difference in height by the horizontal distance and multiplying by 100; the result is a percentage. Gentle slopes are easy to build and plough on, but water drains slowly. On steep slopes, rain washes away soil and clay slopes can slide.
Aspect is the direction a slope faces. South-facing slopes receive more sun and are warmer and drier; villages, vineyards and orchards are usually found on them.
Dissection shows how frequently and deeply valleys cut into the land. The difference in height between a ridge and the valley floor is called local relief.
For the curious
North-facing slopes are colder and wetter, snow lasts longer, and woodland survives better.
Highly dissected land has small areas of farmland and long roads with many hairpin bends.
Steps in an investigation
Start with a precise question, such as “Which part of the village is exposed to flooding?” Mark out the area on a map. Find the highest and lowest points, then the relative height of houses above the river. Calculate the slope in two or three directions. Note the aspect of the slopes and what is on each one: houses, vineyards, pasture or woodland.
In the field, check what you read on the map and look for traces. Signs of a landslide include leaning trees, cracks in walls and tarmac, and steps and ridges of earth. Flood traces include lines of mud on fences and walls. Ask older people how far the water reached. Finally, compare your findings with the official flood hazard maps published by Administrația Națională „Apele Române”, Romania’s national water authority.
The same landforms help and hinder
A floodplain has fertile soil and water nearby, but it is the part of the valley the river floods, and it will flood again. A sunny slope is good for vines, but can slide if it is clay and has been cleared of trees. An investigation therefore specifies the use: land may be suitable for pasture and unsuitable for houses, or the other way round. Flat land is not automatically safe.
Worked example
Reading Rast on a map
The data come from a digital terrain model: the Danube’s surface beside the village is at about 26 m altitude. Old Rast is at about 31 m and 4 km from the river. The village built after the flood, Rastu Nou, is at about 37 m and 6 km north of the old village.
The old village’s relative height above the river: 31 − 26 = 5 m. For the village built after the flood: 37 − 26 = 11 m.
The slope between the two villages: the height difference is 6 m and the distance is 6,000 m, so 6 ÷ 6,000 × 100 = 0.1%. This is a very gentle average slope: on the road between the villages you can hardly feel the climb.
The conclusion: the average slope, close to zero, does not distinguish the two places. Relative height does: the village built after the flood stands twice as high above the river as the old one, which is protected only by the dyke.
In Romania
Rast, the village moved from the floodplain
In spring 2006, rain and melting snow raised the Danube to record levels. When the dyke failed, water entered Rast and residents were evacuated. On 21 April, about 4,000 people still could not return home, and the water spread several kilometres wide across the floodplain.
The state decided to move the village to higher ground. In Rastu Nou, 800 houses were built, and flood victims spent eight months in camps before receiving them. Ten years later, the upper village was almost deserted and many residents were selling the houses they had received.
Rast shows both the advantages and the dangers of a floodplain. Fertile land, water and fish kept people beside the Danube for hundreds of years; that same proximity cost them their homes in a few days.
In brief
- The local area is the territory around a settlement that you can get to know directly; its landforms can be read on a contour map and checked in the field.
- Contour lines join points of equal altitude; close contours show a steep slope, widely spaced contours almost flat land.
- To calculate slope as a percentage, divide the height difference by the horizontal distance and multiply by 100.
- Relative height above the river shows how exposed a place is to flooding; aspect shows how much sun a slope receives; dissection shows how deeply valleys cut the land.
- Relief-related hazards include flooding on floodplains and landslides on clay slopes.
- The same landforms can help one use and limit another: a floodplain is good for crops and unsafe for houses.
Common mistakes
WrongFlat land is a good, safe place to build.
RightSlope is only one criterion. Flat land on a floodplain can flood; check its height above the river, water in the soil and hazard maps.
WrongClose contour lines show a place at high altitude.
RightClose contours show a steep slope. Read the altitude from the value written on the contour.
WrongA 10% slope means an angle of 10 degrees.
RightThe percentage shows how many metres the ground rises over 100 m horizontally. A 10% slope has an angle of almost 6 degrees.
Test yourself
Six questions. For the first five you see the explanation at once, with the paragraph of the lesson that supports it; for the ones with a written answer you compare with a good answer.
On a map, contours are very close on the eastern slope of a hill and far apart on the western slope. What does this mean?
Answer
a) The eastern slope is steeper. The contour interval is the same across the map, so close contours show that altitude changes over a short distance: the slope is steep.
A road rises from 320 m to 360 m altitude over a horizontal distance of 500 m. What is its average slope as a percentage?
%Answer
8 %. The height difference is 360 − 320 = 40 m; 40 ÷ 500 × 100 = 8%.
Two villages stand beside the same river and neither has a dyke. Village A is at 400 m altitude and 2 m above the river. Village B is at 250 m altitude and 12 m above the river. Which is more exposed to flooding?
Answer
c) Village A, because its relative height is lower. Water rises from the river level beside the village, so the height difference to the house, or relative height, matters.
On which slope of a hill in the Subcarpathians would you expect to find a vineyard?
Answer
b) The south-facing slope, because it receives more sun. Vines need warmth and light, and south-facing slopes are the sunniest.
On a slope near the village you see leaning trees, cracks in the tarmac and steps of earth. What do they show?
Answer
d) A landslide. Earth moving downhill tilts trees, breaks tarmac and leaves steps and ridges.
The local council has two sites for a playground: one flat site on the floodplain, 1 m above the water, and one on a terrace, 9 m above the river, with a 4% slope. Which would you recommend, and what else would you check first?
A good answer
I recommend the terrace: its relative height is much greater, so it is much less exposed to flooding, and a 4% slope is gentle. The floodplain site is flat, but lies on the floodplain and will flood. First I would check the official flood hazard map and look in the field for signs of a landslide at the edge of the terrace.
A complete answer compares relative heights, explains that flat floodplain land is unsafe and names at least one further check.
Terms
- local area
- The territory around a settlement that can be known directly by observing and moving through it.
- contour line
- A line on a map joining points of equal altitude.
- contour interval
- The difference in altitude between neighbouring contour lines, the same across a map.
- relative height
- The difference in level between a place and a nearby reference point, usually the valley floor or river.
- slope
- The gradient of the land; as a percentage, the height difference divided by horizontal distance and multiplied by 100.
- aspect
- The direction a slope faces.
- local relief
- The difference in height between a ridge and the neighbouring valley floor, showing the depth of dissection.
Sources and link to the programme
- NASA Earth Observatory – Floods in Central Europe (imagine MODIS din 21 aprilie 2006) – The April 2006 flood at Rast: record Danube levels after rain and snowmelt, the broken dyke, evacuation, about 4,000 people still unable to return home on 21 April, and water spread across several kilometres
- Adevărul – Sinistrații din Dolj își vând casele primite de la Guvern (2016) – Rastu Nou: 800 houses built, eight months in camps, the village almost deserted in 2016, houses offered for sale
- Open Topo Data – EU-DEM (model digital al terenului, 25 m, Copernicus) – Altitudes in the example: Danube surface about 26 m, Rast about 31 m, Rastu Nou about 37 m
- Wikipedia – Rast, Dolj – Village location, altitude (33 m), April 2006 flood
- Administrația Națională „Apele Române” – Hărți de hazard și de risc la inundații – Official flood hazard maps for comparison with the investigation
- British Geological Survey – Landslides – Signs and causes of landslides
From the programme: “Local relief as a factor helping or limiting the community” (common core). Programme competences covered: 4.4, 5.5.