Moral licensing · 116 studies, 2001 to 2022
Does one good deed make the next bad one easier? What 116 studies on moral licensing found
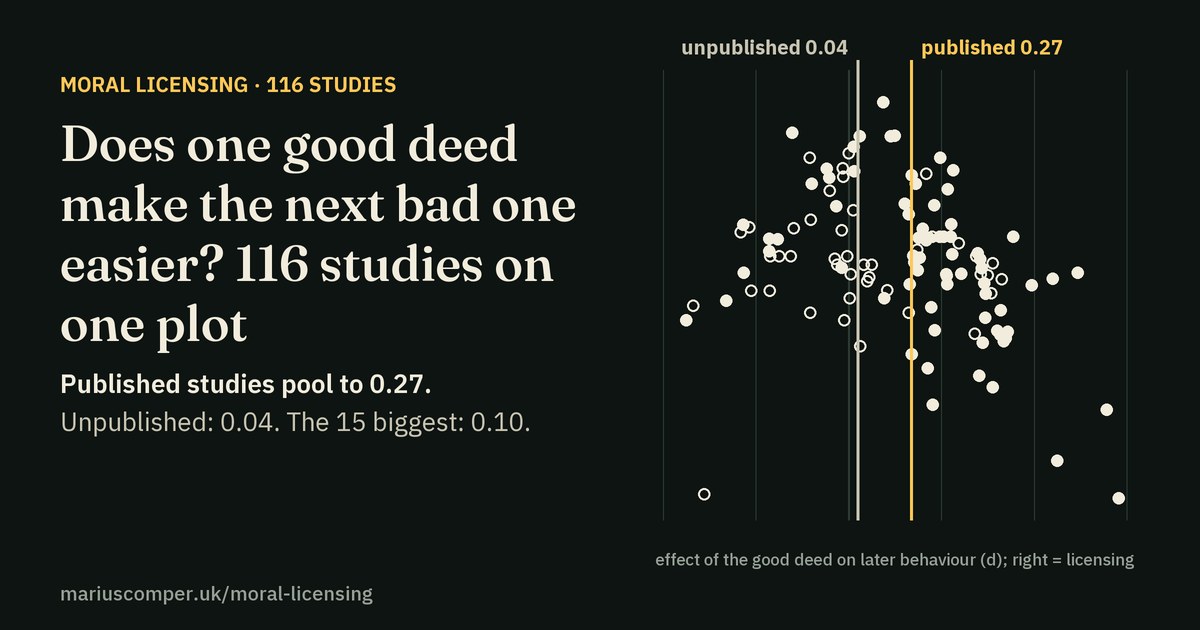
You recycled, so the flight feels earned. You gave at the till, so you skip the call. Psychologists call it moral licensing and have tested it for two decades. A 2015 meta-analysis put the effect at 0.31, small to medium. Then the unpublished studies, the large replications and the studies where nobody was watching came in, and the pooled effect fell to 0.18. Among the unpublished studies it is 0.04. Each dot on the plot beside this text is one of the 116 studies; further down, they can be pooled again.
The idea
A good deed as a credit#
In 1991 the psychologist M. Nisan described a “moral balance”: people keep a running sense of how good they have been, and a good deed buys the right to a small lapse. Ten years later Benoît Monin and Dale Miller ran an experiment that set off decades of follow-ups. Male students who had just disagreed with sexist statements were more willing to say a job suited a man; women did not move. The authors read it as a licence: having shown they were not sexist, the men felt free to say it.
Two explanations compete. In the first, a good deed is a credit: a deposit you can spend, knowing the lapse is still a lapse. In the second, it is a credential: a record that changes what the later choice means, to you and to others. A rival family of results predicts the opposite of both: after one good deed, people do more.
How big is big? The studies report an effect size called d. As an illustration, if outcomes in both groups were roughly bell-shaped, at d = 0.31 a person picked from the licensed group would behave worse than a person picked from the other group in about 59 of 100 random pairs. At zero it is 50. This is a conversion of d, not a frequency counted in these varied studies. By convention about 0.2 is small, 0.5 medium and 0.8 large; d itself is the gap between two groups divided by the spread inside each group.
Famous experiments
Ten experiments, and what happened when they were repeated#
These are the studies behind the headlines and the textbook paragraphs. Each had a few dozen people per condition. They are marked on the plot: low and to the right, the least precise studies with the biggest effects. The 20 studies inside the seven papers that are in the public file pool to 0.56, three times the 0.18 of all 116.
Of the ten, five have since been tried again at scale. One came back at about half its size; four found nothing, or the opposite. The other five have not been directly retested, as far as could be found. The last card is the mirror image, washing after guilt.
- Monin & Miller (2001)Replicated, much smaller
Disagree with sexist statements, then judge a job
Original. 200 students. After easily disagreeing, men leaned further toward “a man” for the job (5.1 against 4.4 on a seven-point scale); women did not move.
Since then. Many Labs 3 (20 sites, 3,134 people): the same direction at about half the size (d about 0.15 against 0.26 as coded in the 2015 meta-analysis), and the men-only pattern was gone. A registered replication of the second experiment (Xiao et al. 2024, 932 people): ethnicity d = 0.08, gender d = −0.38, the opposite way.
What people did
Students said whether sexist statements about “most women” (or milder ones about “some women”) were right or wrong. Then they rated whether a job suited a man or a woman better.
- Sachdeva, Iliev & Medin (2009)Did not replicate
Write about your good traits, then pledge to charity
Original. 46 students. The positive-words group pledged $1.07, the negative-words group $5.30, the neutral group $2.71.
Since then. Blanken et al. 2014: three attempts with 105, 150 and 940 people, sample sizes set by a power analysis. Positive against neutral: 2.89 and 2.78 euros in the first. No licensing in any of the three.
What people did
Students wrote a short story about themselves using words such as caring, generous and kind, or negative words, or neutral ones. Then they said how much of $10 they would give to a charity.
- Khan & Dhar (2006)Not retested
Imagine volunteering, then choose between jeans and a vacuum cleaner
Original. 108 students: 57% chose the jeans after imagining volunteering, 28% otherwise.
Since then. No direct replication found. The choices were hypothetical.
What people did
Students imagined volunteering three hours a week, or did not. Then they chose between a pair of designer jeans and a vacuum cleaner at $50 each, imagining they could afford one.
- Mazar & Zhong (2010)Did not replicate
Shop in a green store, then cheat and steal
Original. About 80 students. Green shoppers claimed the better-paid side in 51% of trials against 43%, and took $0.56 extra against $0.08.
Since then. Urban et al. 2019: three attempts, 1,274 people, two preregistered. Effects between −0.16 and 0.07. The original authors have also posted corrections to the standard deviations printed in the paper.
What people did
Students shopped in an online store stocked mostly with green products, or mostly with conventional ones. Then they did a dots task paid by the side they claimed, and paid themselves from an envelope.
- Effron, Cameron & Monin (2009)Did not replicate
Say you would vote for Obama, then judge a police hire
Original. 84 students (after exclusions), d about 0.45: those who had just endorsed Obama leaned further toward the White candidate.
Since then. Giurge et al. 2021 ran a conceptual retest with a different candidate and outcome, the 2020 Democratic primary: two preregistered experiments, 2,143 and 2,228 people. No licensing; in the first, d = −0.12, the opposite way.
What people did
Students circled who they would vote for before or after rating whether a police job in a town with racial tension suited a White or a Black candidate.
- Jordan, Mullen & Murnighan (2011)Not retested
Recall a good or bad deed of your own, then get a chance to cheat
Original. 152 people: after recalling a moral act they let the wrong answer show 3.6 times, after an immoral act 0.7 times.
Since then. No direct replication found. A registered replication of a related recall paradigm (next card) did not find the same pattern.
What people did
Participants wrote about a moral or immoral act of their own, then did arithmetic where a deliberately wrong answer could be revealed with one key.
- Conway & Peetz (2012)Did not replicate
Recall a good deed from last week or from years ago, then volunteer
Original. Three online studies with 101, 151 and 115 people: a recent good deed lowered willingness (5.4 against 6.0 after a recent bad one), a distant one raised it.
Since then. Martuza & Kim 2024, a registered report with 5,091 people: the recency pattern did not replicate and no compensating was found. Recalling a good deed raised helping intentions.
What people did
Participants recalled a moral or immoral act from the last week or from over a year ago, then rated their willingness to volunteer.
- Cascio & Plant (2015)Not retested
Commit to doing good next month, then judge a job
Original. Four studies with 51 to 86 people each; four effects of d = 0.56 to 0.88 in the public file.
Since then. No replication found. A promise alone, with no deed done, was enough in the original.
What people did
Participants committed to a charity event in the coming weeks, or did not, then did the police-job rating or a prejudice scale.
- Gneezy, Imas, Brown, Nelson & Norton (2012)Not retested
A donation that costs you, or one that costs nothing, then a chance to lie
Original. 168 students: 71% were honest after the costly donation, 52% with no donation, 30% after the costless one.
Since then. No replication found. The paper’s own conclusion: a costly good deed produces consistency, a costless one can produce licensing.
What people did
Students received $5. In one condition $2 of it went to charity; in another $2 went to charity on top of their pay. Then they wrote a message to another student that could be honest or deceptive.
- Chiou, Yang & Wan (2011)Not retested
Swallow what you believe is a vitamin, then choose between exercise and a buffet
Original. 82 people: 71% of the “vitamin” group chose a buffet over an organic meal, 44% of the others. In a second study (68 students) they walked 267 m against 435 m for a pedometer return.
Since then. No replication found. The 2015 meta-analysis left this study out as a health-domain design.
What people did
Everyone swallowed a placebo. Half were told it was a multivitamin, the others that it was a placebo. Then they rated how much they wanted to exercise and chose a reward.
- Zhong & Liljenquist (2006)Did not replicate
Mirror image: recall a bad deed, then want soap
Original. Four small studies (27 to 60 people). People who had recalled a bad deed wanted cleansing products more.
Since then. Earp et al. 2014: three direct replications (153, 156, 286 people) found nothing. Many Labs 2: 7,001 people, d = 0.00.
What people did
Participants recalled an unethical or ethical deed, then rated how much they wanted cleansing products (soap, toothpaste) against non-cleansing ones.
All the studies
One plot for 116 studies#
Each dot is one study, from 2001 to 2022, taken from the public study-level file of the most recent licensing meta-analysis (Rotella and colleagues, 56 papers, 155 effects; several effects from one study are averaged). The authors’ paper reports an overall g = 0.21 [0.12, 0.29] from its own multilevel model; the numbers on this page are this page’s recalculation from the public file, with simpler averaging within study, and give 0.18. Left to right: how much worse people behaved after a good deed than in the comparison group, which is a neutral control in 79 studies and another kind of comparison in the other 37. Zero is no difference. Top to bottom: how precisely the study measured it. Large studies sit at the top.
Pooled, the 116 studies give d = 0.18, with an interval from 0.13 to 0.24. By the same conversion, that is about 55 of 100 random pairs. The 2015 figure of 0.31 was for 91 studies; this file is larger and runs to 2022.
Pooling treats every dot as if the same filter had produced it. Three filters turn out not to have been the same.
Published or not
The unpublished studies find almost nothing#
Of the 116 studies, 72 appeared in journals and 44 did not: a mix of theses, conference talks and data shared by researchers. The published ones pool to 0.27. The unpublished ones pool to 0.04, with an interval from −0.05 to 0.14 that includes zero.
The 2015 meta-analysis found the same split on its own data: 0.43 against 0.11. Unpublished work can differ in other ways, so the gap is not proof of a filter. It is what a filter leaves behind, and the next two plots show more of it.
Small studies
The smaller the study, the bigger the effect#
The median study here has 85 people in total, about 42 per group. 72% have fewer than 120. Studies of under 60 people pool to 0.38. Studies of 250 or more pool to 0.10. In a clean literature, imprecise studies scatter evenly around the truth. Here they lean right.
A test for that lean (a regression of effect on precision) is significant, p = 0.01. Extended to a study with no sampling error, the tilted line lands at 0.02, which cannot be told from zero. 35% of studies are individually “significant” in the licensing direction; 5% are in the opposite direction.
Big studies
The biggest studies sit near zero#
Fifteen studies had 250 people or more. They include the Many Labs 3 tests, Urban and colleagues’ green-shopping replications, Blanken’s attempts at the donation effect and a 1,615-person online study. Pooled, they give 0.10, with an interval from 0.00 to 0.19. By the same conversion, about 53 of 100 pairs.
Registered replications that are not in this file point the same way; they have their own chapter below.
Someone watching
Where the effect does appear: when someone is watching#
Coders in the most recent meta-analysis rated each study for whether participants were observed when they made the second choice. Where nobody was watching, 56 studies pool to 0.12. Where observation was explicit, 11 studies pool to 0.66: by the same conversion, about 68 of 100 pairs.
This is the one pattern that still shows a positive estimate after bias adjustment, in a comparison of 11 small studies; a result that rests on a handful of small papers. Rotella and colleagues’ bias-adjusted estimate is 0.51 for explicitly observed participants (Bayes factor 9.1) and −0.01 for unobserved ones (Bayes factor 0.11, evidence against). Two cautions. The 11 observed studies come from four papers and have 18 to 86 people each. And observation is confounded with the lab against online: online studies pool to 0.06, in-person ones to 0.34.
Pool them yourself
Choose which studies count#
Every filter below is a defensible choice. Combine them and see what the literature says about your question. The estimate is a random-effects average of the studies left, computed in your browser from the same file as the dots.
How a true zero turns into a medium effect#
How bias builds
Publication bias is easy to name and hard to feel. This is a machine for feeling it. 200 imaginary studies test an effect whose true size you set. Each one draws its result by chance. Studies with a clear positive result get published; the rest mostly stay in the drawer. The orange line is what someone reading only the journals would conclude. Grey rings are the studies nobody sees.
Set the true effect to 0.1 with 43 people per group, close to the median study in this literature, and publish only the significant results: the published studies average about 0.46. That is larger than the 2015 headline of 0.31 and more than four times the truth. Let a fifth of the non-significant studies in and it falls to 0.19; publish everything and it is 0.10. Nobody in this machine cheats. It needs only that clear results are easier to publish than unclear ones, and that studies are small. Imaginary studies, not data.
The large retests, side by side#
Each row is one original study (diamond) and the larger attempts to repeat it (dots with 95% intervals). To the right of the line, licensing; to the left, the opposite. Effect sizes for the replications are as reported, or computed from the reported means; the notes say which.
The same rows as a table
| Study | d | 95% interval | People |
|---|---|---|---|
| Monin & Miller 2001, exp. 1 (original) | 0.26 | ||
| Many Labs 3, 20 sites, 3,134 people | 0.15 | 0.08; 0.21 | 3,134 |
| Monin & Miller 2001, exp. 2 (original) | 0.71 | ||
| Xiao et al. 2024, ethnicity scenario, 932 people | 0.08 | −0.14; 0.30 | 932 |
| Xiao et al. 2024, gender scenario | −0.38 | −0.61; −0.14 | 932 |
| Effron et al. 2009, exp. 1 (original) | 0.44 | ||
| Giurge et al. 2021, study 1, 2,143 people | −0.12 | −0.22; −0.02 | 2,143 |
| Sachdeva et al. 2009, exp. 1 (original) | 0.62 | ||
| Blanken et al. 2014, study 1, 105 people * | −0.03 | −0.49; 0.43 | 105 |
| Blanken et al. 2014, study 2, 150 people * | −0.31 | −0.71; 0.09 | 150 |
| Blanken et al. 2014, study 3, 940 people * | 0.03 | −0.13; 0.19 | 940 |
| Rotella & Barclay 2020, recall task, 519 people | −0.27 | −0.49; −0.05 | 519 |
| Mazar & Zhong 2010, exp. 3 (original) | 0.53 | ||
| Urban et al. 2019, study 1, 215 people | −0.16 | −0.43; 0.11 | 215 |
| Urban et al. 2019, study 2, 686 people | 0.07 | −0.11; 0.25 | 686 |
| Urban et al. 2019, study 3, 373 people | −0.08 | −0.33; 0.17 | 373 |
Two further large tests found no licensing but report no single effect size: Bahník and Vranka (2022, 297 people, a bribe-taking task) and Martuza and Kim (2024, 5,091 people, a registered replication of Conway and Peetz).
Outside the lab: what field and daily-life data show#
A lab task is a long way from a Tuesday. These are the best attempts to look where behaviour happens, ordered by how directly they show a good deed followed by a worse act. None has been replicated by an independent team, as far as could be found; two later field trials of water feedback (Jessoe and colleagues 2021, Carlsson and colleagues 2021) did not find electricity use rising.
- Weekly water feedback, then more electricityField, suggestive
154 apartments in one residential complex. Households that got weekly feedback on their water use cut it by 6.0% and used 5.6% more electricity than households that got none. One building, one summer, and the saving was free of charge for residents. The study does not measure why electricity rose.
- A green-power tariff, then more electricityField, observational
20,205 households. Those who enrolled at the minimum level of a green-power programme raised their electricity use by 2.5% after enrolling; those who bought more showed no change. Billing data, not an experiment.
- A company that gives to charity, then more cheatingField experiment
More than 1,500 online workers transcribing scanned pages. When the firm advertised that it would donate on their behalf, the share who cheated rose from 20.9% to 25.9%, about a quarter more. The workers were not the donors; the firm was.
- A good deed this morning, a worse act this afternoonDaily life, correlational
1,252 Americans reported moral and immoral events several times a day. After committing a moral act, people were more likely to report an immoral act later the same day and less likely to report another moral one. Self-reported, within one day, no manipulation.
- An offset programme announced, then longer showersField experiment, abstract only
Eight weeks in a youth hostel, 9,999 observations. Guests told that the hostel offsets its carbon used 5.4% to 15.5% more shower water; adding real-time feedback removed the increase. Read from the publisher’s abstract.
- One green habit, then the nextAgainst a general effect
Maki and colleagues pooled 77 effects from 22 studies and unpublished data: intentions rose a little (0.17); behaviour did not (−0.03). Geiger and colleagues, in a preregistered Bayesian update (63 effects, 26,613 people), found 0.01 (interval −0.13 to 0.16) and “strong support for no spillover” on behaviour.
- A public gesture, then less real helpLab and field, small, corrected
Across several studies, people who showed token support in private helped more in a later, more meaningful task than people who showed it in public; how well the cause fit their values mattered. The authors explain it by satisfied impression management. A correction to one study was published in 2020.
Look at the cases that show a worse act. In several of them the good deed was cheap for the person or done on their behalf: a donation made by the employer, an offset run by the hostel, the minimum green tariff, a water saving that cost the household nothing. That echoes the costless donation in the 2012 lab study by Gneezy and colleagues. It is a pattern across a handful of studies, not a test.
Three things that look like licensing and are not
- Rebound. After an efficiency gain, use rises because it got cheaper. Studies of solar owners and hybrid drivers find higher use, which economics can explain without a moral story.
- Risk compensation. Behaviour gets riskier when perceived danger falls: helmets, sunscreen, masks, vaccines. The evidence is mixed, and the mechanism is about danger, not credit.
- The reverse order. Kotchen and Moon (2012) found that firms with more harms also do more good, across about 3,000 firms: harm first, good second, which is offsetting and not licensing. Kaiser and colleagues (2013) found that diversity structures make high-status staff see their organisation as fairer, which is legitimisation.
Where people reach for it now#
Each row is a sentence people say, what was measured about it, and what that supports. “Not tested” means no clean test was found.
| The sentence | What was measured | What it supports |
|---|---|---|
| “I cycle to work, so the flight is fine.” | No test of flights was found. Closest: a minimum green tariff (+2.5% electricity) and a hostel’s offset announcement (more shower water, abstract only). Three experiments with 2,215 people found offsetting is seen as hypocritical even when net zero (Chu & Yuan, 2025). | Suggestive in two field studies; flying not tested |
| “I went to the gym, so the pizza is earned.” | A placebo “vitamin” made 82 people choose a buffet more often (Chiou et al. 2011, lab). The best-known exercise-and-snacking and “health halo” studies come from a lab whose director a Cornell faculty committee found in 2018 to have committed academic misconduct, and are left out here. | Lab only, small; field not tested cleanly |
| “The company does good, so it can cut corners.” | Workers cheated about a quarter more when the firm advertised a donation (List & Momeni 2021). In 49 large firms, more past CSR went with more later irresponsibility (Ormiston & Wong 2013). | One causal field test, of workers not firms; one correlation |
| “I posted the hashtag.” | Private gestures led to more later help than public ones, depending on fit with values (Kristofferson et al. 2014; corrected 2020). | Mixed, small samples |
| “I’m vaccinated, so I can relax.” | Studies of masks, vaccines and helmets mostly find little or mixed compensation. | Risk compensation, a different mechanism |
| “I voted for the right candidate, so I can be biased.” | Two preregistered experiments with 4,371 people found no licensing, with a different candidate and outcome (Giurge et al. 2021). | Conceptual retest, no licensing |
| “I gave at the checkout, so I give less later.” | No peer-reviewed field test of later giving was found. A study across many charities and weeks found that giving to other charities rose about 10% in the first weeks after a major appeal, then fell back, with no net loss over 20 weeks, which is a shift in timing, not licensing (Scharf et al. 2022). | Not tested |
In the UK: the carrier-bag charge#
The cleanest British natural experiment on the question is the carrier-bag charge: Wales from 2011, England from October 2015 at 5p. Thomas, Poortinga and Sautkina (2016) followed 17,636 people in a household panel. Own-bag use rose in Wales relative to England and Scotland, “with minimal changes in other environmental attitudes and behaviours”: where the new habit spread to six other sustainable behaviours, it spread less in Wales, where the reason was a charge. Thomas and colleagues (2019) followed 1,230 people in England: those who came to support the bag charge more also came to support a bottle charge more. Support for higher fuel duty was not linked to it. The charge changed the bags and little else, and the studies found no sign of people becoming less green elsewhere.
What this lets you do, and what it does not#
- As a rule of behaviour, it is much weaker than its reputation. The effect shrinks as studies get larger and as unpublished ones are counted. Large preregistered replications of several of the best-known experiments found nothing, or something much smaller.
- The narrow version has support. When people were observed at the second choice, 11 studies from four papers pool to roughly 0.5 to 0.65 of a standard deviation. Three of them are Sachdeva’s, which did not replicate, and four test a promise rather than a deed. That is a comparison across studies, not an experiment. Nothing here shows that unseen everyday lapses are licensed by earlier good deeds.
- For people who design programmes, the field cases that point to a worse act involve cheap or delegated good deeds. In the hostel experiment, adding real-time feedback removed the rise (abstract only).
- Four questions for the next headline about a psychology effect: How many people? Has anyone repeated it with more? Who was watching? Was the later behaviour real money and effort, or an imagined choice?
What nobody has tested yet
No large preregistered multi-lab study was found that randomly assigned observation in a licensing design, so the “someone is watching” result remains a comparison of studies. No field experiment was found that randomised a visible good deed and then watched unobserved behaviour. The sample of everyday life that exists is a handful of studies, mostly one building, one hostel and one tariff.
Sources and method#
- Plot, pooled estimates and every filter: the public study-level file of Rotella, Jung, Chinn and Barclay, “Observation moderates the moral licensing effect” (Personality and Social Psychology Bulletin, 2025), open on the Open Science Framework (osf.io/kzwmr). 155 effect sizes from 56 papers were averaged within study to 116 independent studies and 18,334 people, each study counted once. The authors’ paper reports 115 experiments and N = 21,770, a total that counts some participants more than once; the total here counts each study once, from the file. Random-effects pooling is DerSimonian–Laird; a multilevel model fitted here, this page’s own implementation of the authors’ approach, gives 0.18 (0.09 to 0.26) on the same file.
- One correction: the file codes the sampling variance of Conway and colleagues (2014, 78 people) as 0.000005, which would give that study the weight of hundreds of thousands of people. It was recomputed from the sample size (about 4/N). Left uncorrected, the pooled estimate barely moves (0.18 against 0.18), but the small-study regression lands at −0.06 instead of 0.02, because one study with a near-zero variance dominates a precision-weighted line.
- The 2015 meta-analysis: Blanken, van de Ven and Zeelenberg, Personality and Social Psychology Bulletin 41(4), 540–558. 91 studies, 7,397 participants, d = 0.31 [0.23, 0.38]; published 0.43, unpublished 0.11; funnel-asymmetry test t(55) = 5.72; average power 28%.
- Bias re-analysis: Kuper and Bott, Meta-Psychology 3 (2019). 76 independent effects. Naive 0.27; PET-PEESE −0.05 [−0.26, 0.16]; three-parameter selection model 0.18 [0.06, 0.29]. Not preregistered; the two corrections disagree.
- Observation moderator and robust Bayesian adjustment: Rotella et al. (2025), 115 experiments, N = 21,770. Figures quoted from the abstract and preprint; the full-text numbers for the overall effect differ slightly between versions.
- Sequential-behaviour meta-analysis: Ferguson, Kaufmann, Brown and de la Piedad Garcia, Psychological Bulletin 150(6), 2024. Licensing only when the second behaviour is negative (g = 0.25); bias-corrected −0.04 [−0.26, 0.18].
- Retests: Blanken et al. 2014 (Social Psychology 45(3)); Ebersole et al. 2016 (JESP 67); Urban, Bahník and Braun Kohlová 2019 (J. Environmental Psychology 63); Giurge, Lin and Effron 2021 (JESP 95); Xiao et al. 2024 (International Review of Social Psychology 37); Martuza and Kim 2024 (PSPB); Rotella and Barclay 2020 (Personality and Individual Differences 161); Bahník and Vranka 2022 (Scientific Reports 12); Earp et al. 2014 (Basic and Applied Social Psychology 36); Klein et al. 2018 (AMPPS 1).
What this page cannot tell you
- Pooling studies that differ in design is a judgment. The heterogeneity is large (I² about 65%); the pooled number is a summary, not a constant of nature.
- The observation result is a moderator analysis of studies, not an experiment on observation. Eleven studies from four papers carry the “explicit” bar.
- Absence of an effect in these designs is not proof of absence in life. It shows that the particular lab paradigms are weaker than their reputation; it does not test every way a person might feel entitled to a lapse.
- The sample is mostly students and online workers, mostly in North America and Europe.
Every study in the plot (116)
The table shows the number of people analysed after the file’s exclusions, which can be lower than the totals quoted in the text.
| Study | People | d | Published | Observed |
|---|---|---|---|---|
| Ebersole et al. 2016 | 2,647 | 0.15 | yes | nobody watching |
| Millet 2022 | 1,615 | −0.24 | yes | nobody watching |
| Noblet 2017 | 668 | 0.20 | yes | nobody watching |
| Ebersole et al. 2016 | 639 | 0.18 | yes | nobody watching |
| Blanken 2014 | 632 | 0.05 | yes | nobody watching |
| Urban 2019 | 472 | 0.02 | yes | nobody watching |
| Clot 2018 | 367 | 0.40 | yes | nobody watching |
| Rotella 2020 | 364 | −0.17 | no | nobody watching |
| Jasinkaja 2020 | 299 | −0.09 | yes | nobody watching |
| Ferguson 0 | 288 | −0.02 | no | nobody watching |
| de Jong 2017 | 286 | 0.45 | yes | nobody watching |
| Spektor 2014 | 278 | 0.00 | no | not coded |
| Lauren 2017 | 274 | 0.02 | yes | nobody watching |
| Meijers 2015 | 261 | 0.34 | no | somewhat |
| Li 2017 | 254 | 0.27 | yes | nobody watching |
| Ferguson 0 | 244 | −0.02 | no | nobody watching |
| Urban 2019 | 240 | −0.08 | yes | nobody watching |
| Yam 2017 | 217 | 0.29 | yes | nobody watching |
| Urban 2019 | 215 | −0.16 | yes | nobody watching |
| Baraque-Duran 2016 | 200 | 0.43 | yes | nobody watching |
| Clot 2013 | 192 | 0.30 | yes | nobody watching |
| Ferguson 0 | 191 | −0.08 | no | nobody watching |
| Jones 2018 | 186 | −0.05 | yes | nobody watching |
| Millet 2022 | 166 | −0.45 | yes | nobody watching |
| Jones 2018 | 164 | −0.34 | yes | somewhat |
| Effron 2012 | 157 | 0.24 | yes | nobody watching |
| Truelove 2016 | 157 | 0.37 | yes | somewhat |
| Rotella 2015 | 146 | −0.03 | no | nobody watching |
| Ferguson 0 | 142 | 0.02 | no | nobody watching |
| Monin 2001 | 141 | 0.26 | yes | nobody watching |
| Blanken 2012 | 133 | 0.55 | no | not coded |
| Meijers 2014 | 124 | −0.16 | no | nobody watching |
| Stellar 2014 | 120 | 0.44 | yes | nobody watching |
| Robitaille 2014 | 119 | 0.17 | no | somewhat |
| Choi 2014 | 116 | 0.44 | yes | somewhat |
| Gholamzedehmir 2015 | 116 | −0.43 | no | nobody watching |
| Boyd 2014 | 112 | −0.24 | no | nobody watching |
| Geng 2016 | 112 | 0.32 | yes | somewhat |
| Bradley-Geist 2010 | 111 | −0.70 | yes | somewhat |
| Simbrunner 2016 | 111 | 0.08 | no | not coded |
| Simbrunner 2016 | 111 | −0.05 | no | not coded |
| Simbrunner 2016 | 111 | 0.10 | no | not coded |
| Simbrunner 2016 | 111 | 0.07 | no | not coded |
| Monin 2001 | 110 | 0.71 | yes | nobody watching |
| Gholamzedehmir 2015 | 109 | −0.47 | no | nobody watching |
| Li 2017 | 102 | 0.39 | yes | nobody watching |
| Clot 2014 | 100 | 0.35 | yes | nobody watching |
| Blanken 2014 | 98 | −0.31 | yes | nobody watching |
| Braun 2012 | 98 | 0.34 | yes | nobody watching |
| Brown et al. 2011 | 97 | 0.41 | yes | nobody watching |
| Robitaille 2014 | 95 | 0.48 | no | somewhat |
| Cornelissen 2013 | 92 | 0.36 | no | not coded |
| Leonard 2012 | 92 | −0.17 | no | not coded |
| Barclay 2014 | 87 | −0.34 | no | somewhat |
| Meijers 2014 | 87 | 0.30 | no | somewhat |
| Blanken 2012 | 86 | −0.01 | no | not coded |
| Cascio 2015 | 86 | 0.56 | yes | explicit |
| Lalot 2018 | 86 | −0.34 | yes | nobody watching |
| Effron 2009 | 84 | 0.45 | yes | somewhat |
| Lacasse 2017 | 84 | 0.28 | yes | nobody watching |
| Susewind 2014 | 84 | 0.31 | yes | nobody watching |
| Blanken 2012 | 83 | −0.25 | no | not coded |
| Cascio 2015 | 81 | 0.88 | yes | explicit |
| Mazar 2010 | 81 | 0.57 | yes | somewhat |
| Robitaille 2014 | 78 | 0.62 | no | somewhat |
| Conway et al. 2014 | 78 | −0.06 | no | somewhat |
| Jordan 2011 | 76 | 0.99 | yes | somewhat |
| Mazar 2010 | 76 | 0.28 | yes | somewhat |
| Thomas 2012 | 76 | −0.30 | no | not coded |
| Cascio 2015 | 74 | 0.57 | yes | explicit |
| Young 2012 | 72 | −0.45 | yes | nobody watching |
| Blanken 2014 | 71 | −0.03 | yes | nobody watching |
| Cornelissen 2013 | 70 | 0.57 | no | not coded |
| Zhong 2009 | 70 | 0.30 | yes | nobody watching |
| Meijers 2014 | 69 | 0.60 | no | nobody watching |
| Merritt et al. 2012 | 69 | 0.49 | yes | somewhat |
| Jordan 2011 | 68 | 0.42 | yes | nobody watching |
| Robitaille 2014 | 67 | 0.66 | no | somewhat |
| Robitaille 2014 | 66 | 0.09 | no | somewhat |
| Blanken 2012 | 65 | 0.42 | no | not coded |
| Conway 2012 | 65 | 0.79 | yes | nobody watching |
| Effron 2012 | 64 | 0.59 | yes | nobody watching |
| Leonard 2012 | 64 | 0.01 | no | not coded |
| Schuler 2012 | 62 | −0.42 | no | not coded |
| Schwabe 2018 | 62 | 0.26 | yes | somewhat |
| Susewind 2014 | 62 | 0.42 | yes | explicit |
| Blanken 2012 | 61 | −0.34 | no | not coded |
| Szekeres 0 | 59 | 0.62 | no | somewhat |
| Schwabe 2018 | 58 | 0.59 | yes | somewhat |
| Blanken 2012 | 57 | 0.01 | no | not coded |
| Blanken 2012 | 57 | −0.67 | no | not coded |
| Effron 2009 | 55 | 0.15 | yes | somewhat |
| Cornelissen 2013 | 54 | −0.53 | yes | nobody watching |
| Cascio 2015 | 51 | 0.66 | yes | explicit |
| Conway 2012 | 51 | 0.36 | yes | nobody watching |
| Blanken 2012 | 50 | 0.55 | no | not coded |
| Blanken 2012 | 49 | 0.26 | no | not coded |
| Cornelissen 2013 | 48 | 0.59 | yes | nobody watching |
| Bradley-Geist 2010 | 43 | 0.37 | yes | somewhat |
| Leonard 2012 | 43 | −0.02 | no | not coded |
| Mann 2012 | 43 | 0.64 | yes | explicit |
| Mann 2012 | 43 | 0.69 | yes | explicit |
| Effron 2009 | 42 | 0.65 | yes | somewhat |
| Cornelissen 2013 | 41 | 0.68 | yes | nobody watching |
| Geng 2016 | 40 | 0.67 | yes | somewhat |
| Conway 2012 | 39 | 0.58 | yes | nobody watching |
| Blanken 2012 | 38 | 0.05 | no | not coded |
| Bradley-Geist 2010 | 38 | 0.27 | yes | somewhat |
| Greene 2014 | 35 | 0.34 | yes | nobody watching |
| Sachdeva 2009 | 31 | 0.56 | yes | explicit |
| Conway et al. 2014 | 30 | −0.62 | no | nobody watching |
| Sachdeva 2009 | 29 | 0.62 | yes | explicit |
| Mann 2012 | 28 | 1.11 | yes | explicit |
| Braun 2012 | 27 | 0.36 | yes | nobody watching |
| Monin 2001 | 21 | 0.90 | yes | nobody watching |
| Sachdeva 2009 | 18 | 1.17 | yes | explicit |