TRIO 9 · EUROPEAN RENAISSANCES
Rotterdam after the bombing: a city between ruins and a new plan
Thirteen minutes of bombing. Two days of fire. Follow the fire’s edge, read the victim records separately, and see how the 1946 plan changed the centre while some older alignments survived.
14 MAY 1940 · ROTTERDAM
Thirteen minutes separated the old centre from the city that would be built
13:27. The bombing begins. At 13:40, the attack is over; fires continue for two days.
Stadsarchief Rotterdam records 158 heavy bombs and about 1,150 lighter bombs over the centre and parts of Kralingen.
This is the fifth day of Germany’s invasion of the Netherlands. Rotterdam and the national campaign have different turning points; the city, the fire and the capitulation each have their own time and documents.
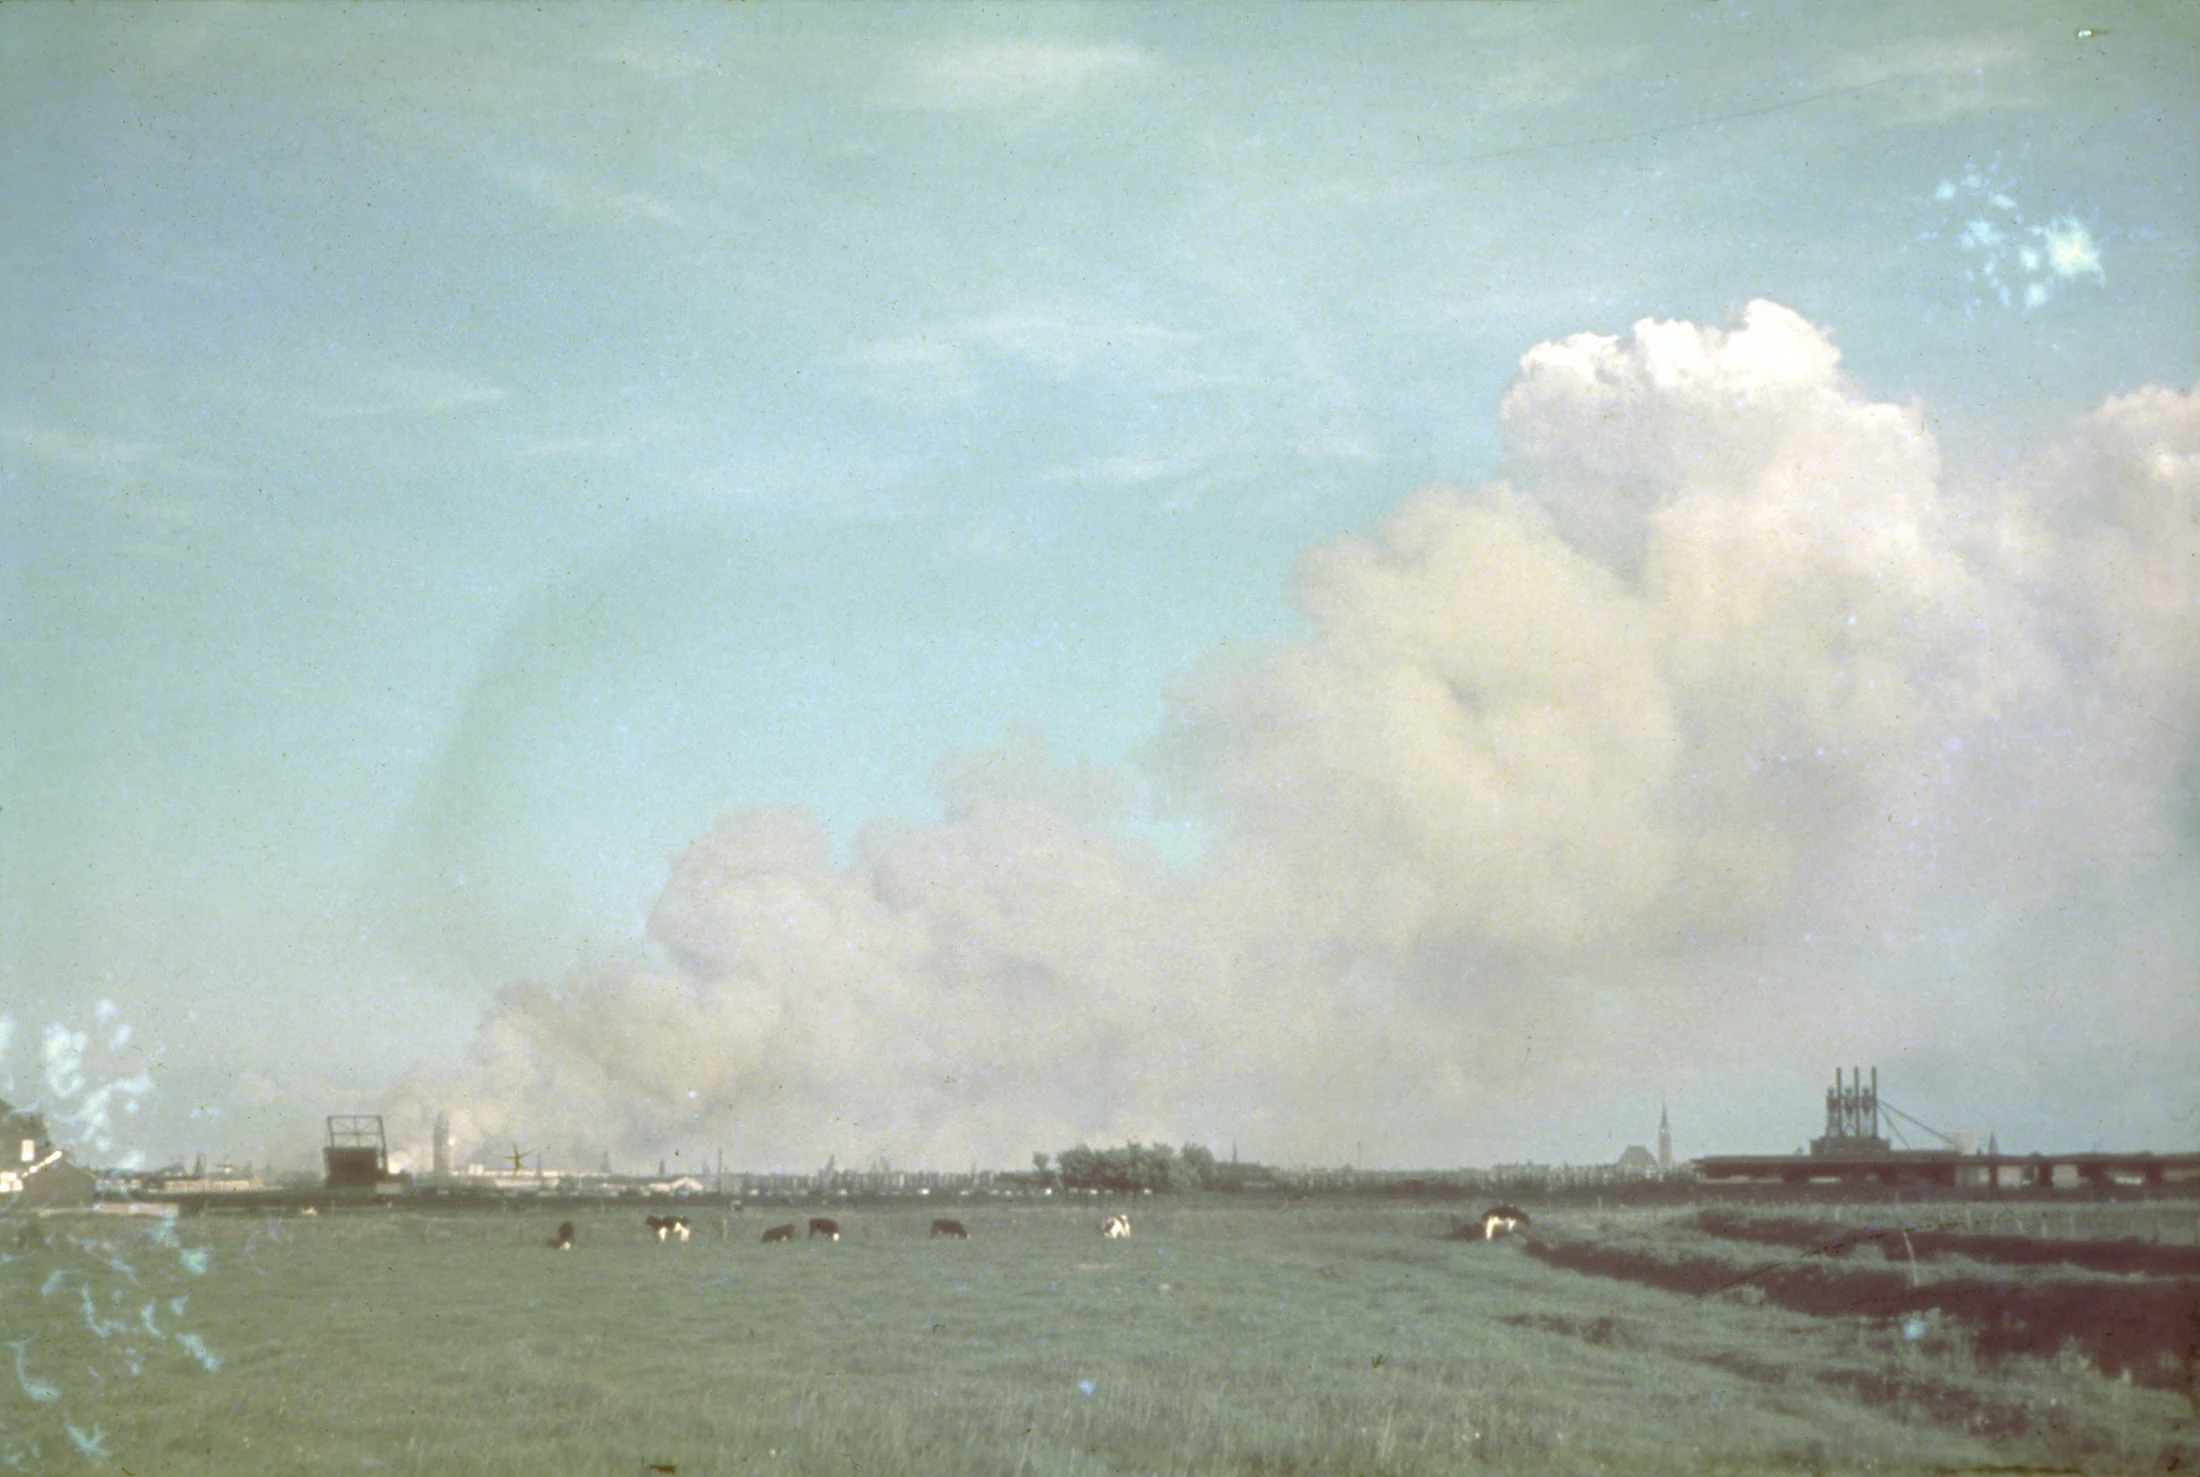
Photo credit: Hendrik (Henk) (H.) Sutterland; 1940-05-14Commons file: Rookwolken van de brand van het Rotterdamse bombardement vanuit Overschie met Blijdorpsebrug, Sint-Willibrorduskerk en bedrijfsgebouwen van houthandel Van Stolk 1940.jpgLicense: CC0
The bomb figures are attributed to the municipal archive’s account.
AREA AND LOSS
258 hectares describe the devastated area, not a bomb footprint
Stadsarchief Rotterdam reports 258 hectares laid in rubble. Separately, the archive counts 25,000 homes and 11,000 other buildings destroyed, and about 80,000 people left homeless.
Four measures: devastated ground, homes, other buildings and displaced people. The 258 hectares describe the devastated area, not a bomb footprint. The fire-damaged edge is a separate observation.
Laurenskerk remained badly damaged, its tower partly collapsed. The first restoration stone was laid on 19 May 1952; work ended in 1968. But the toll raises another question: who appears in the record?
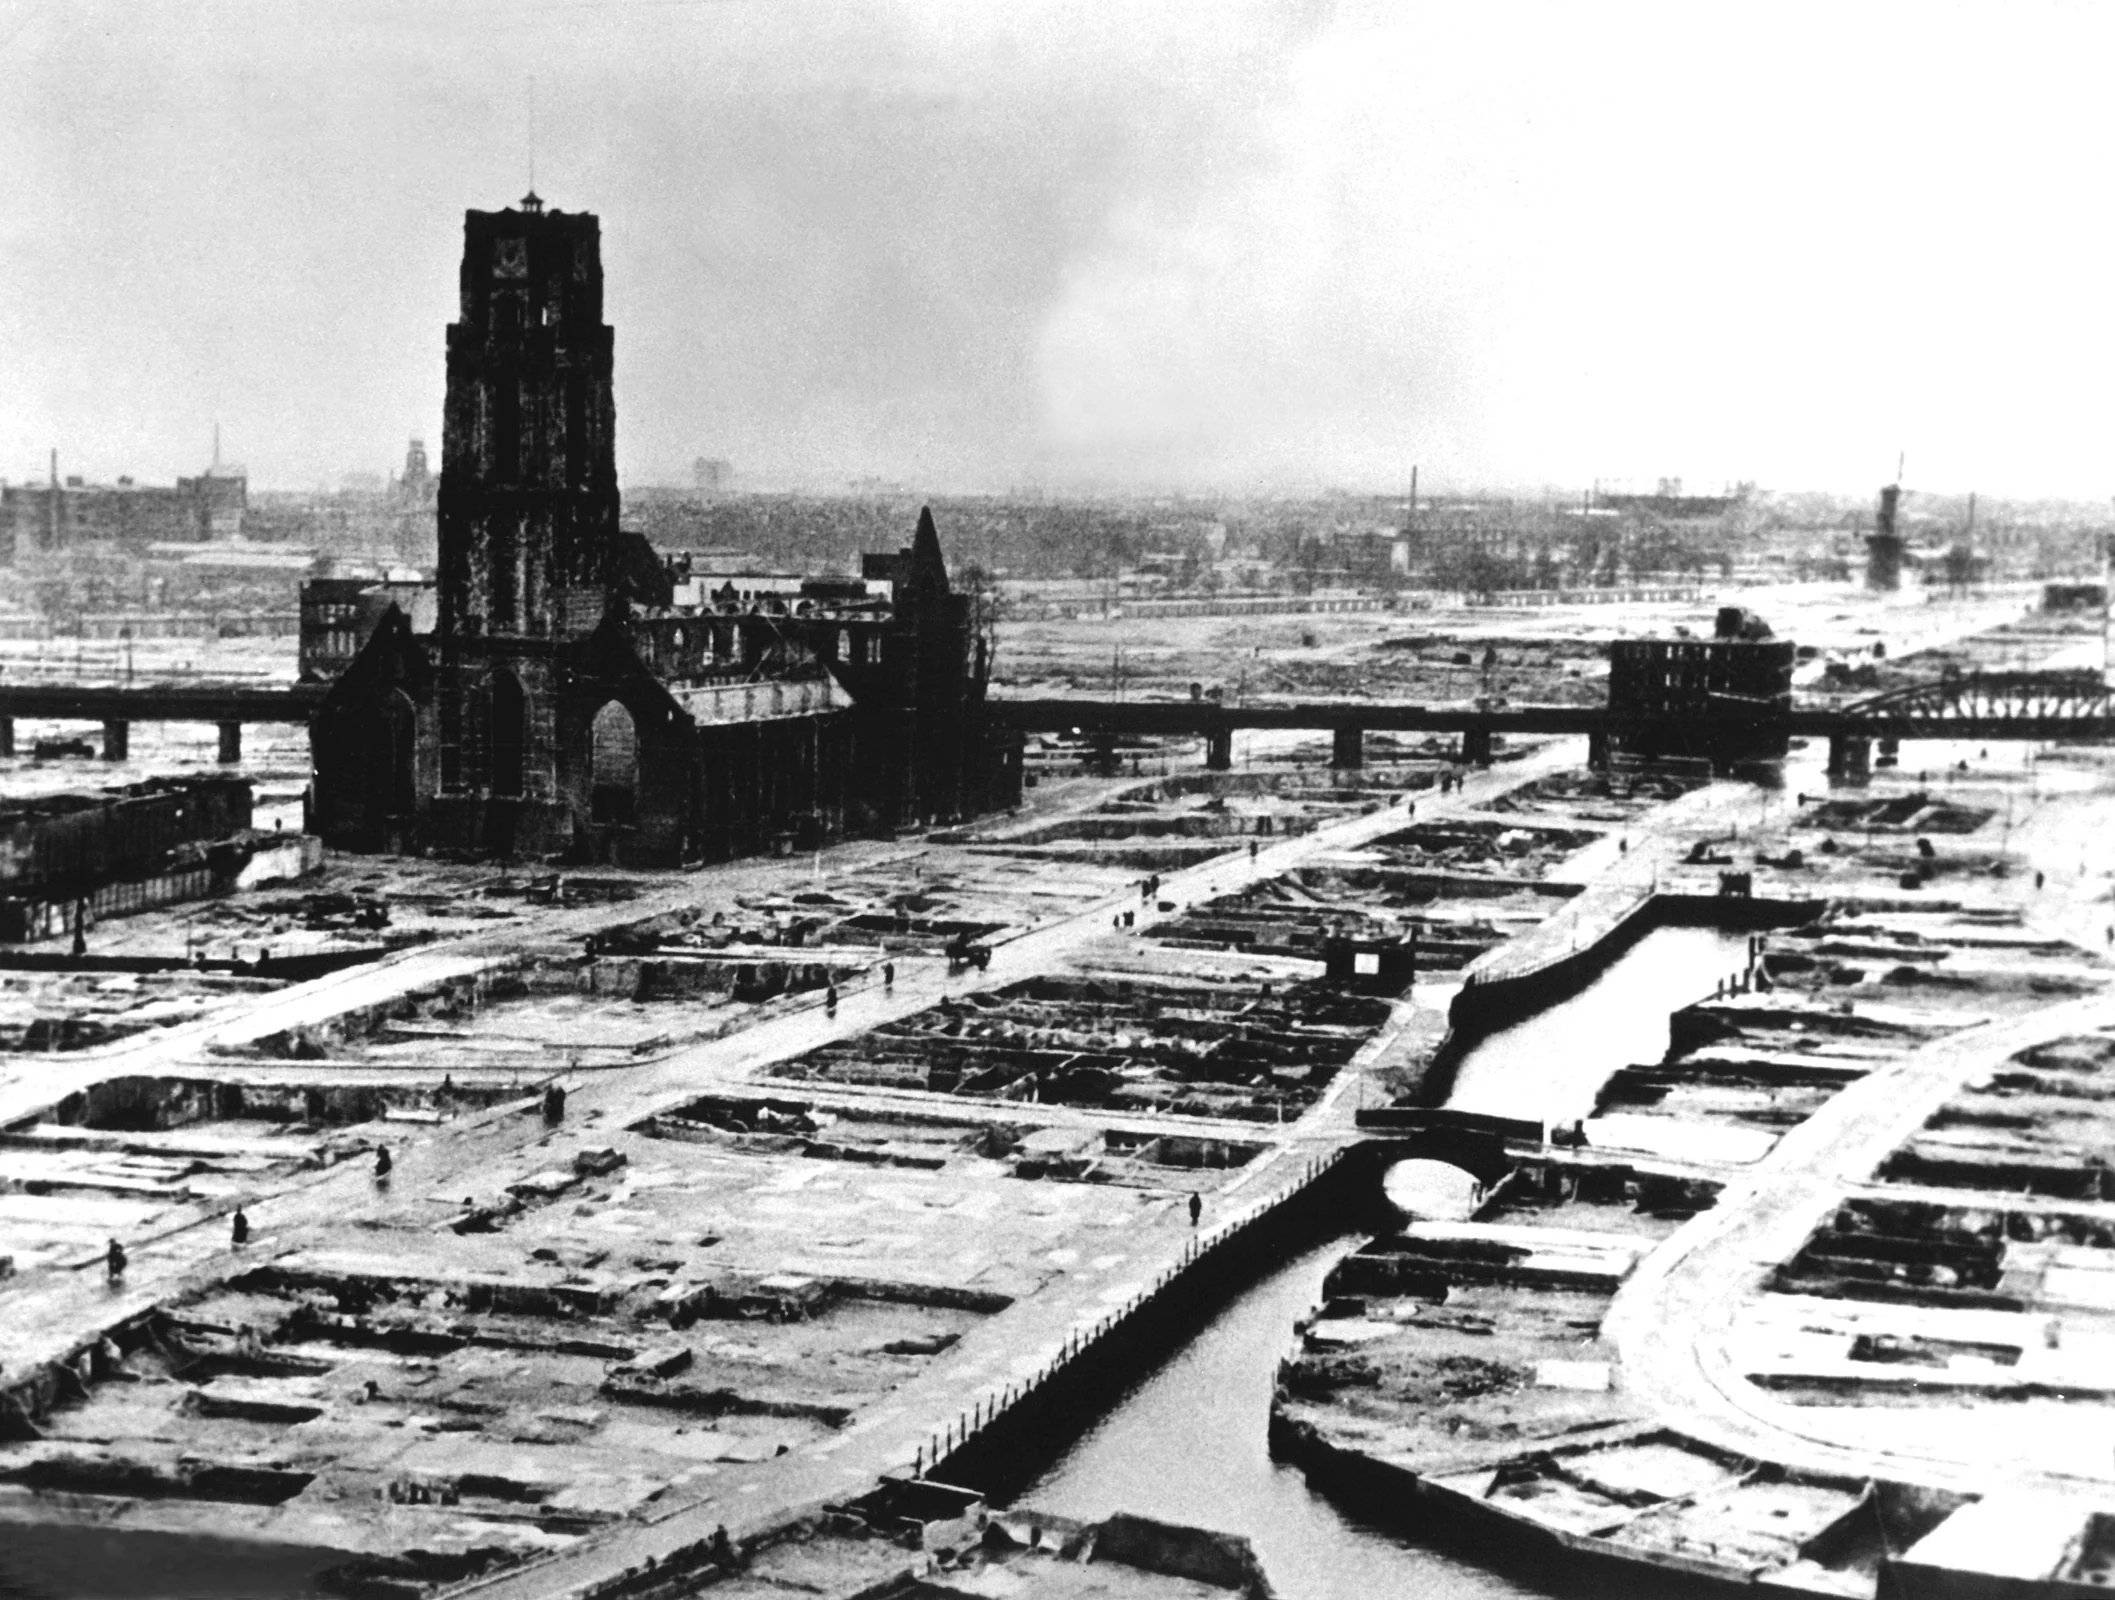
Photo credit: Unknown author; 1940Commons file: Rotterdam, Laurenskerk, na bombardement van mei 1940.jpgLicense: Public domain
WHO IS COUNTED
713 names, 32 suspected cases and different histories of estimation
713 names. A name-by-name study links these civilian victims, directly or indirectly, to the 14 May 1940 bombing.
The list holds 32 suspected cases separately. NIOD estimates 650–900 civilian deaths in the inner city; Stadsarchief records earlier estimates of 800–1,400. Their boundaries and methods differ, so they do not form one range.
An expanded register for Rotterdam events from 10 to 14 May totals 1,185 people, including military deaths and victims of other attacks. It answers a broader question than the civilian toll for the 14 May bombing. The next record turns from who was counted to the order that tried to halt the attack.
| Value | Population and period | Counting basis | Interpretive limit |
|---|---|---|---|
| 713 | Civilian victims directly or indirectly linked to the 14 May bombing | Name-by-name list built from archival records and evidence | A maintained research list, not a final forensic census. |
| 32 | Suspected cases, listed separately from named victims | Stichting Voorouder suspected-case register | Suspected status does not confirm a death or its link to the bombing. |
| 650–900 | Civilian deaths in Rotterdam’s inner city, NIOD estimate | NIOD historical synthesis | Geography and method differ from the name-by-name study. |
| 800–1,400 | Earlier historical estimates recorded by Stadsarchief | Ranges published in the municipal archive synthesis | Earlier estimates with non-harmonized boundaries and methods. |
| 1,185 | Rotterdam events from 10 to 14 May, including other attacks and military deaths | Campaign register with distinct categories | The campaign total is not the civilian toll for the 14 May bombing. |
These estimates use different sources and boundaries; they are not averaged.
The 32 suspected cases remain separate from the 713 named civilian victims.
ORDERS AND SIGNALS
The stop signal reached the formation unevenly
Surrender talks led to a postponement, but the stop order did not reach every aircraft clearly. Red flares rose; some crews did not see or understand them. Other aircraft continued the attack.
The RAF Air Historical Branch translation of German records indicates that about half the formation withheld its bombs. NTR’s account and Kesselring’s later testimony describe other parts of the sequence. How the order travelled and where command responsibility lay remain disputed.
The flares and testimony leave the sequence open. The next threshold sits in the documents: Rotterdam’s local surrender and the national capitulation.
Negotiations
Commanders postpone the attack while surrender talks proceed.
Order
The stop message does not reach every aircraft clearly.
Red flares
The signal is fired; some crews do not see or understand it.
Formation
Some aircraft continue the attack; records describe the sequence incompletely and differently.
THREE THRESHOLDS
The city’s surrender and the country’s capitulation were separate documents
On 14 May, Rotterdam receives a local ultimatum and sends its reply. That day, General Winkelman orders Dutch forces to lay down arms nationally, citing civilian protection and an end to bloodshed. The national terms are signed at Rijsoord on 15 May.
The German threat to Utrecht, including the comparison with Warsaw, added pressure. NIMH does not establish it as the sole or decisive cause of the national decision. Fighting in Zeeland continued until 19 May. Fire left a different line in the city: Brandgrens.
Rotterdam local surrender
Local ultimatum and reply.
National capitulation
The terms are signed at Rijsoord.
Zeeland
Fighting continues until this date.
A LINE THAT STAYS IN THE CITY
Brandgrens follows the edge of the fire-damaged area
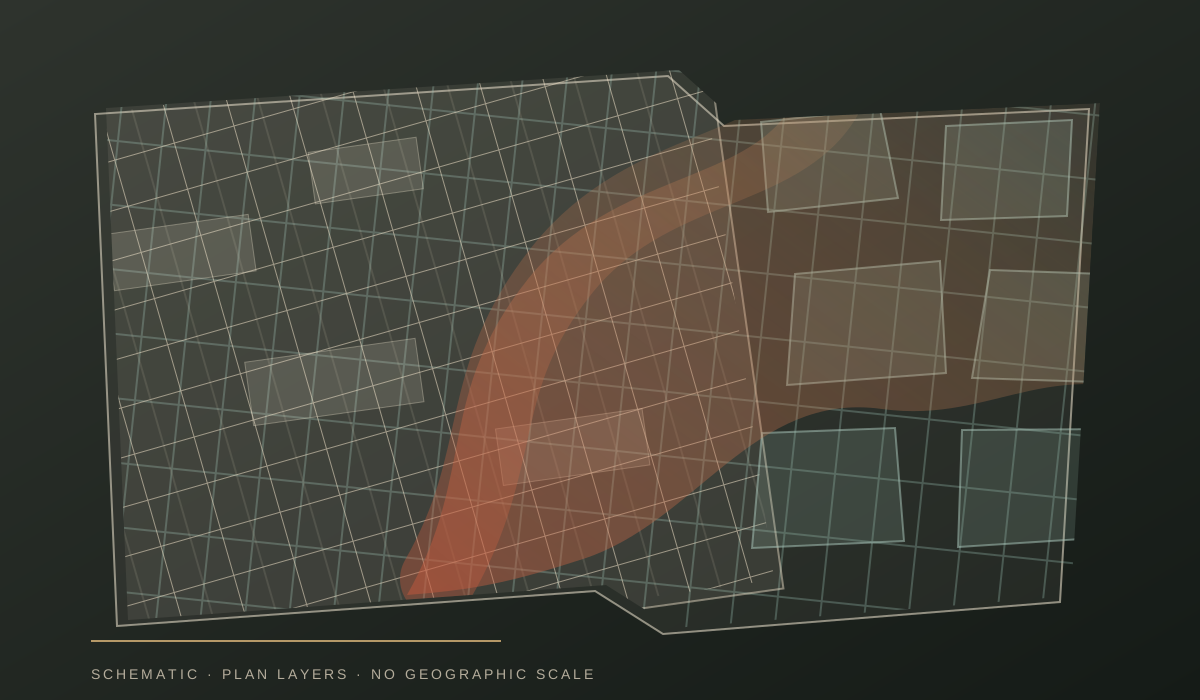
Brandgrens traces the edge of the area damaged by fire; it does not catalogue every impact point. The memorial route opened on 14 May 2010 with 127 ground lights. Red and green mark separate segments; green on Noordereiland marks “friendly fire.”
Municipal technical sheets from 1940 show the city at 1:5,000. OpenStreetMap (OSM) shows the current street network for orientation; today’s roads do not determine Brandgrens. Each layer keeps its date and source. Beyond the fire’s edge is the next question: what did the new plan keep?
- 1940
- 2026 · contemporary
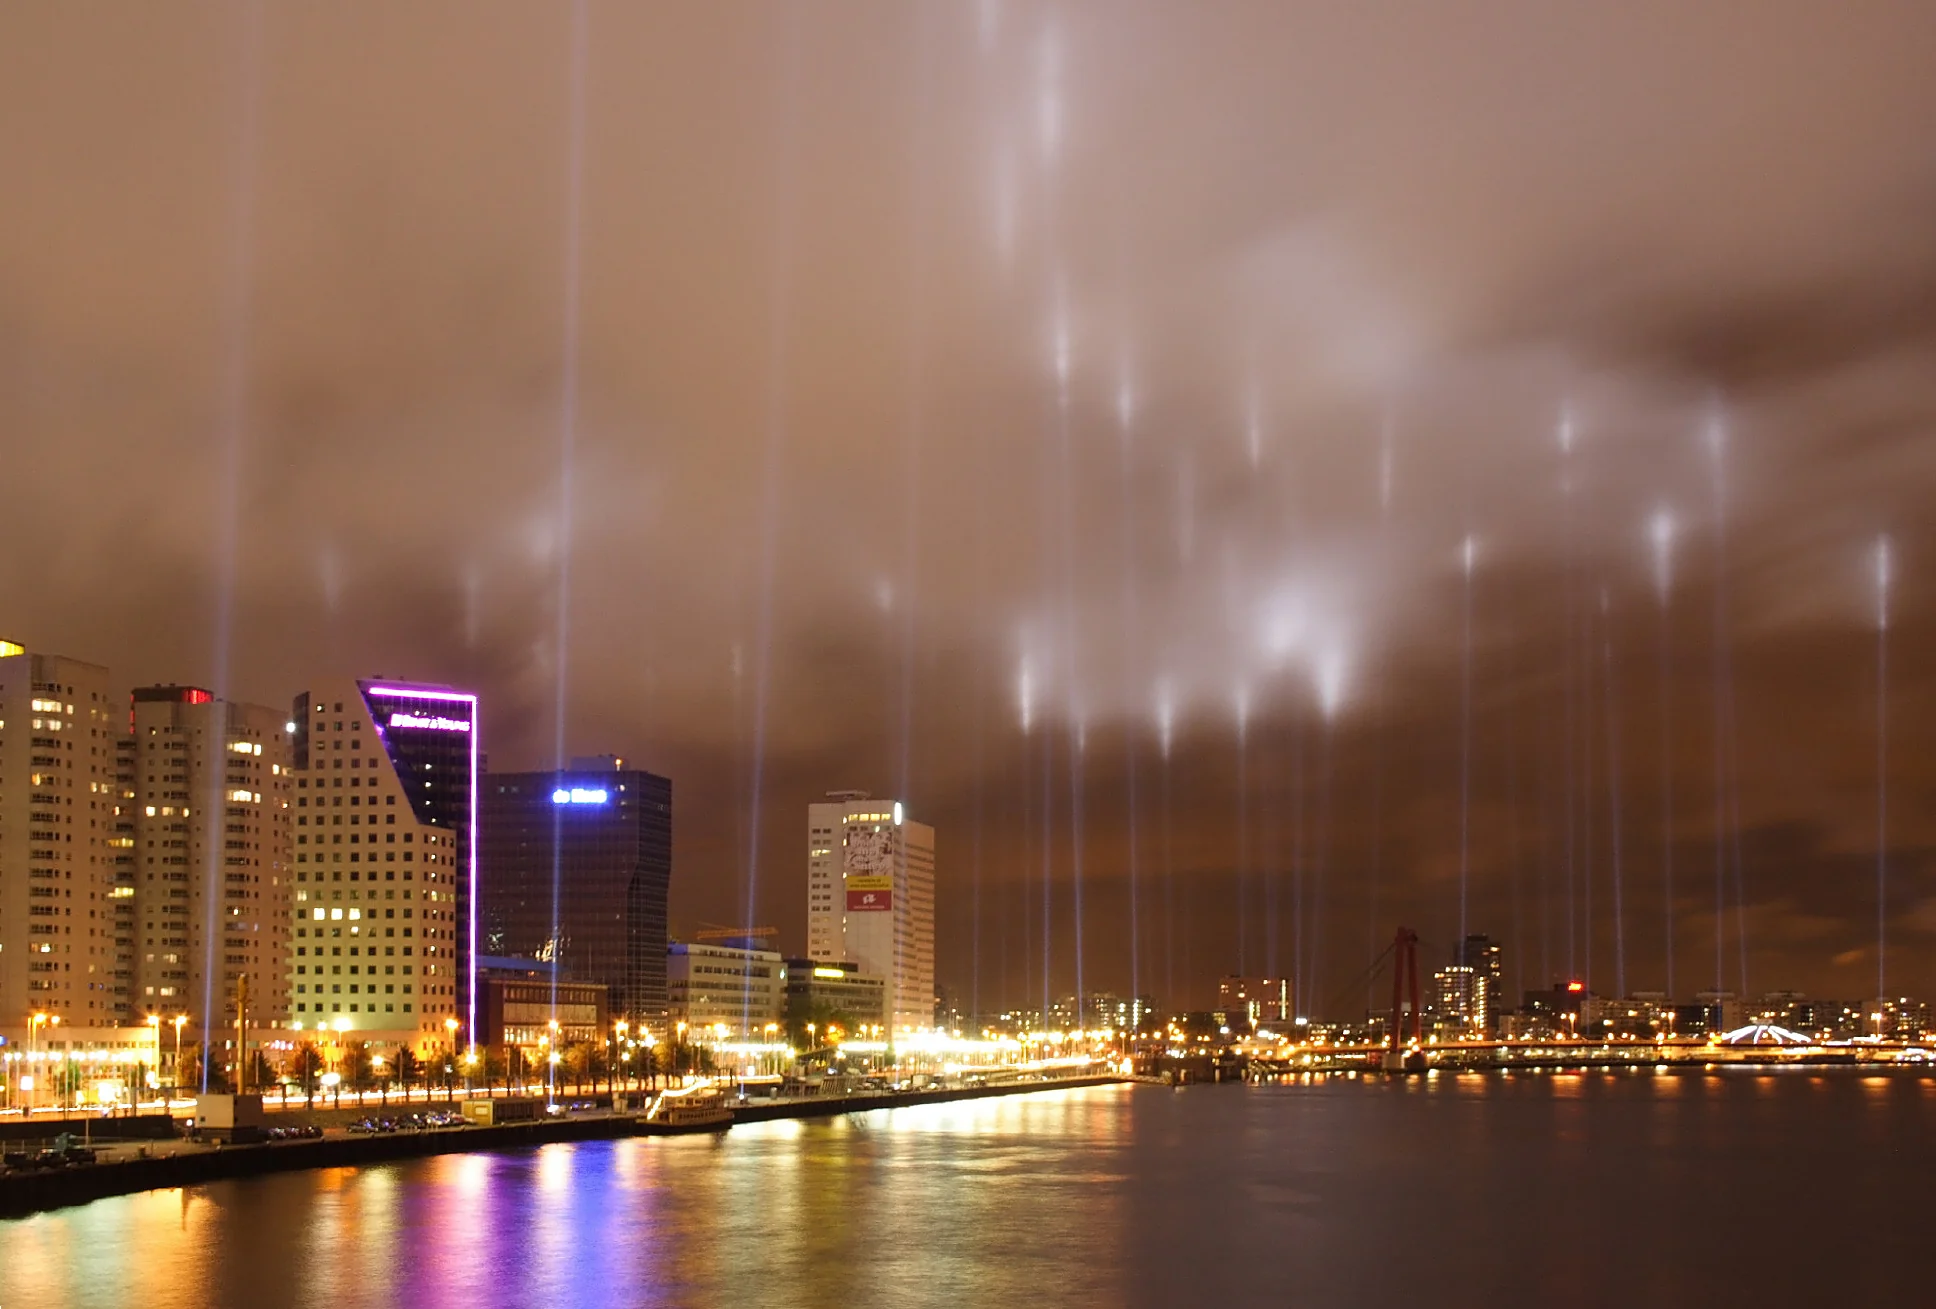
Photo credit: Yorick Groen - Edited by (Noise reduced, sharpened and tilt removed): Arad; 2007-05-15Commons file: HerdenkingVuurgrensRotterdam1940 2007 edit1.jpgLicense: CC BY-SA 3.0
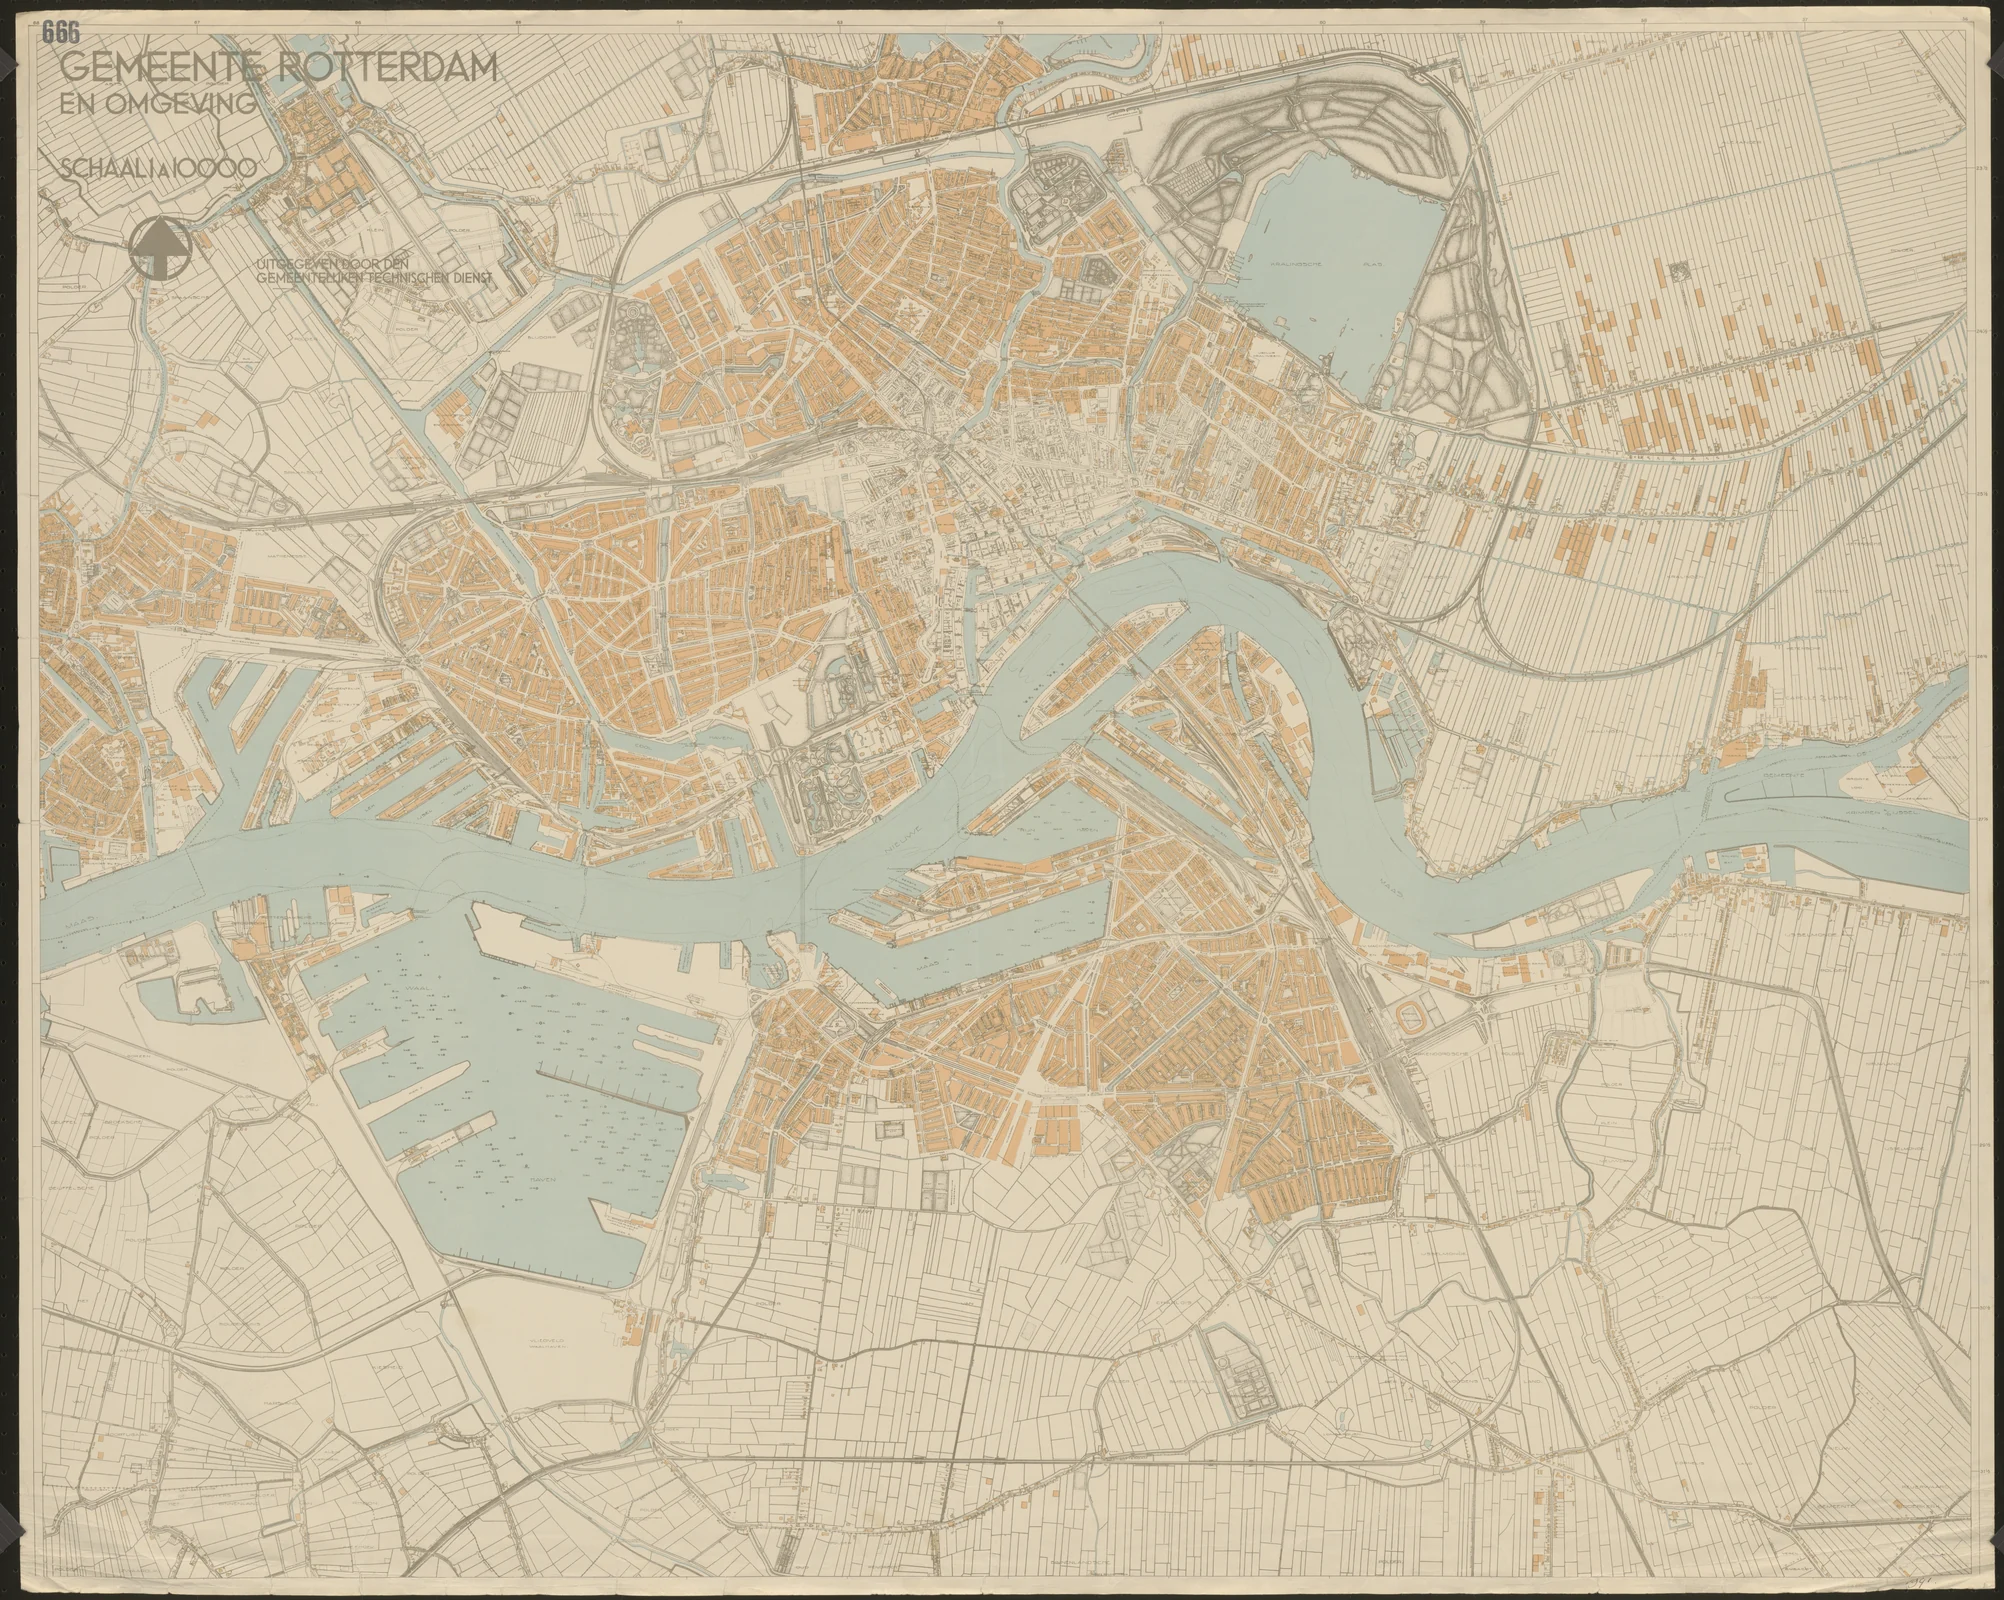
Photo credit: Gemeentelijke Technische Dienst; 1940Commons file: Plattegrond van Rotterdam in 1940.jpgLicense: Public domain
The technical map and OSM base carry separate date and provenance labels. Modern roads do not reconstruct Brandgrens.
- Stadsarchief Rotterdam — history of the Brandgrens lights
- Municipal historical map service, Rotterdam 1940 sheets at 1:5,000
- Stadsarchief Rotterdam — the 127 Brandgrens lights
- BKOR — the Brandgrens artwork
- Rotterdam municipality — 1940 technical map sheets at 1:5,000
- OpenStreetMap — attribution and usage terms
FROM PLAN TO CITY
The 1946 plan chose transformation while older alignments remained
Cornelis van Traa published the Basisplan in 1946. It widened key routes, changed the street network and separated urban functions. “Tabula rasa” names the rhetoric of rupture; some alignments survived.
The Lijnbaan and Groothandelsgebouw opened in 1953. The Lijnbaan is the Netherlands’ first car-free shopping centre, according to the national heritage register. The largely intact port expanded west through Botlek and Europoort. From 1962 to 2004, Rotterdam held the world’s largest-port rank.
The skyline records change; housing statistics need a firmer baseline. That comparable series begins in 1947.
Cornelis van Traa publishes the Basisplan
The Lijnbaan and Groothandelsgebouw open
Europoort is built
Rotterdam is the world’s largest port
The Cube Houses become a local architectural landmark
Markthal opens
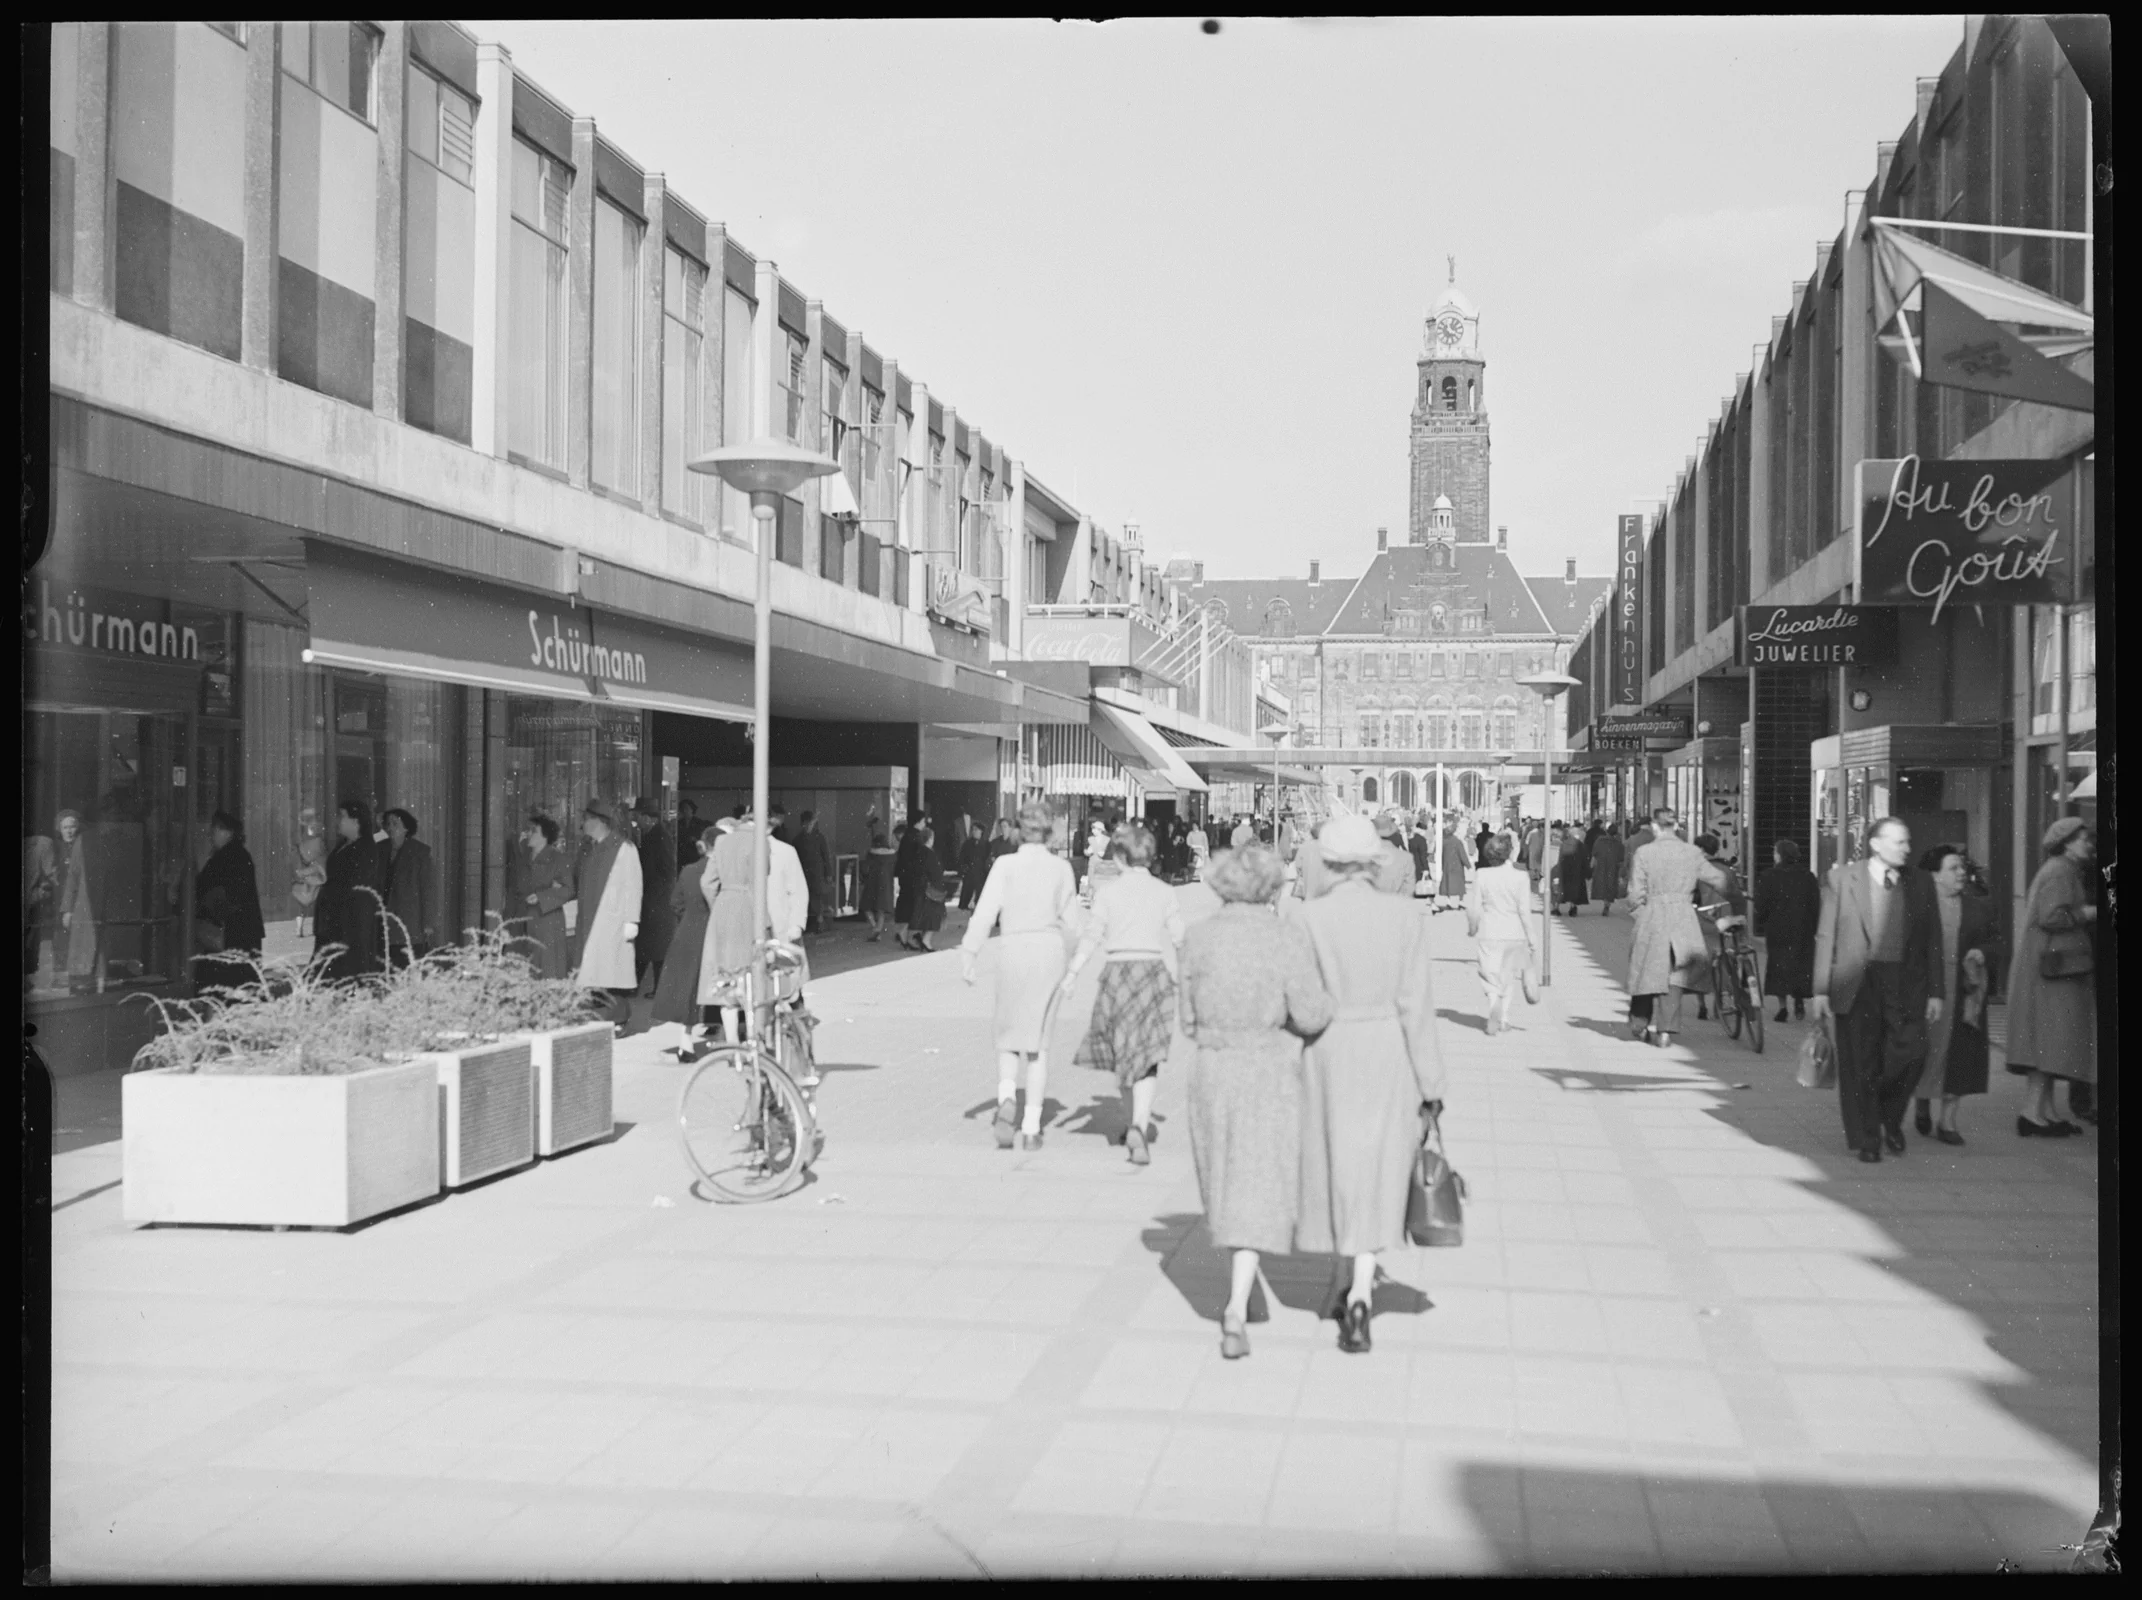
Photo credit: Vervaardiger: Fototechnische Dienst Rotterdam ( Gemeentewerken, Openbare Werken ) ; Auteursrechthouder: Gemeente Rotterdam (Stadsarchief); 01-05-1950Commons file: 1950 Winkelende mensen in de Lijnbaan, Rotterdam.jpgLicense: CC BY 4.0
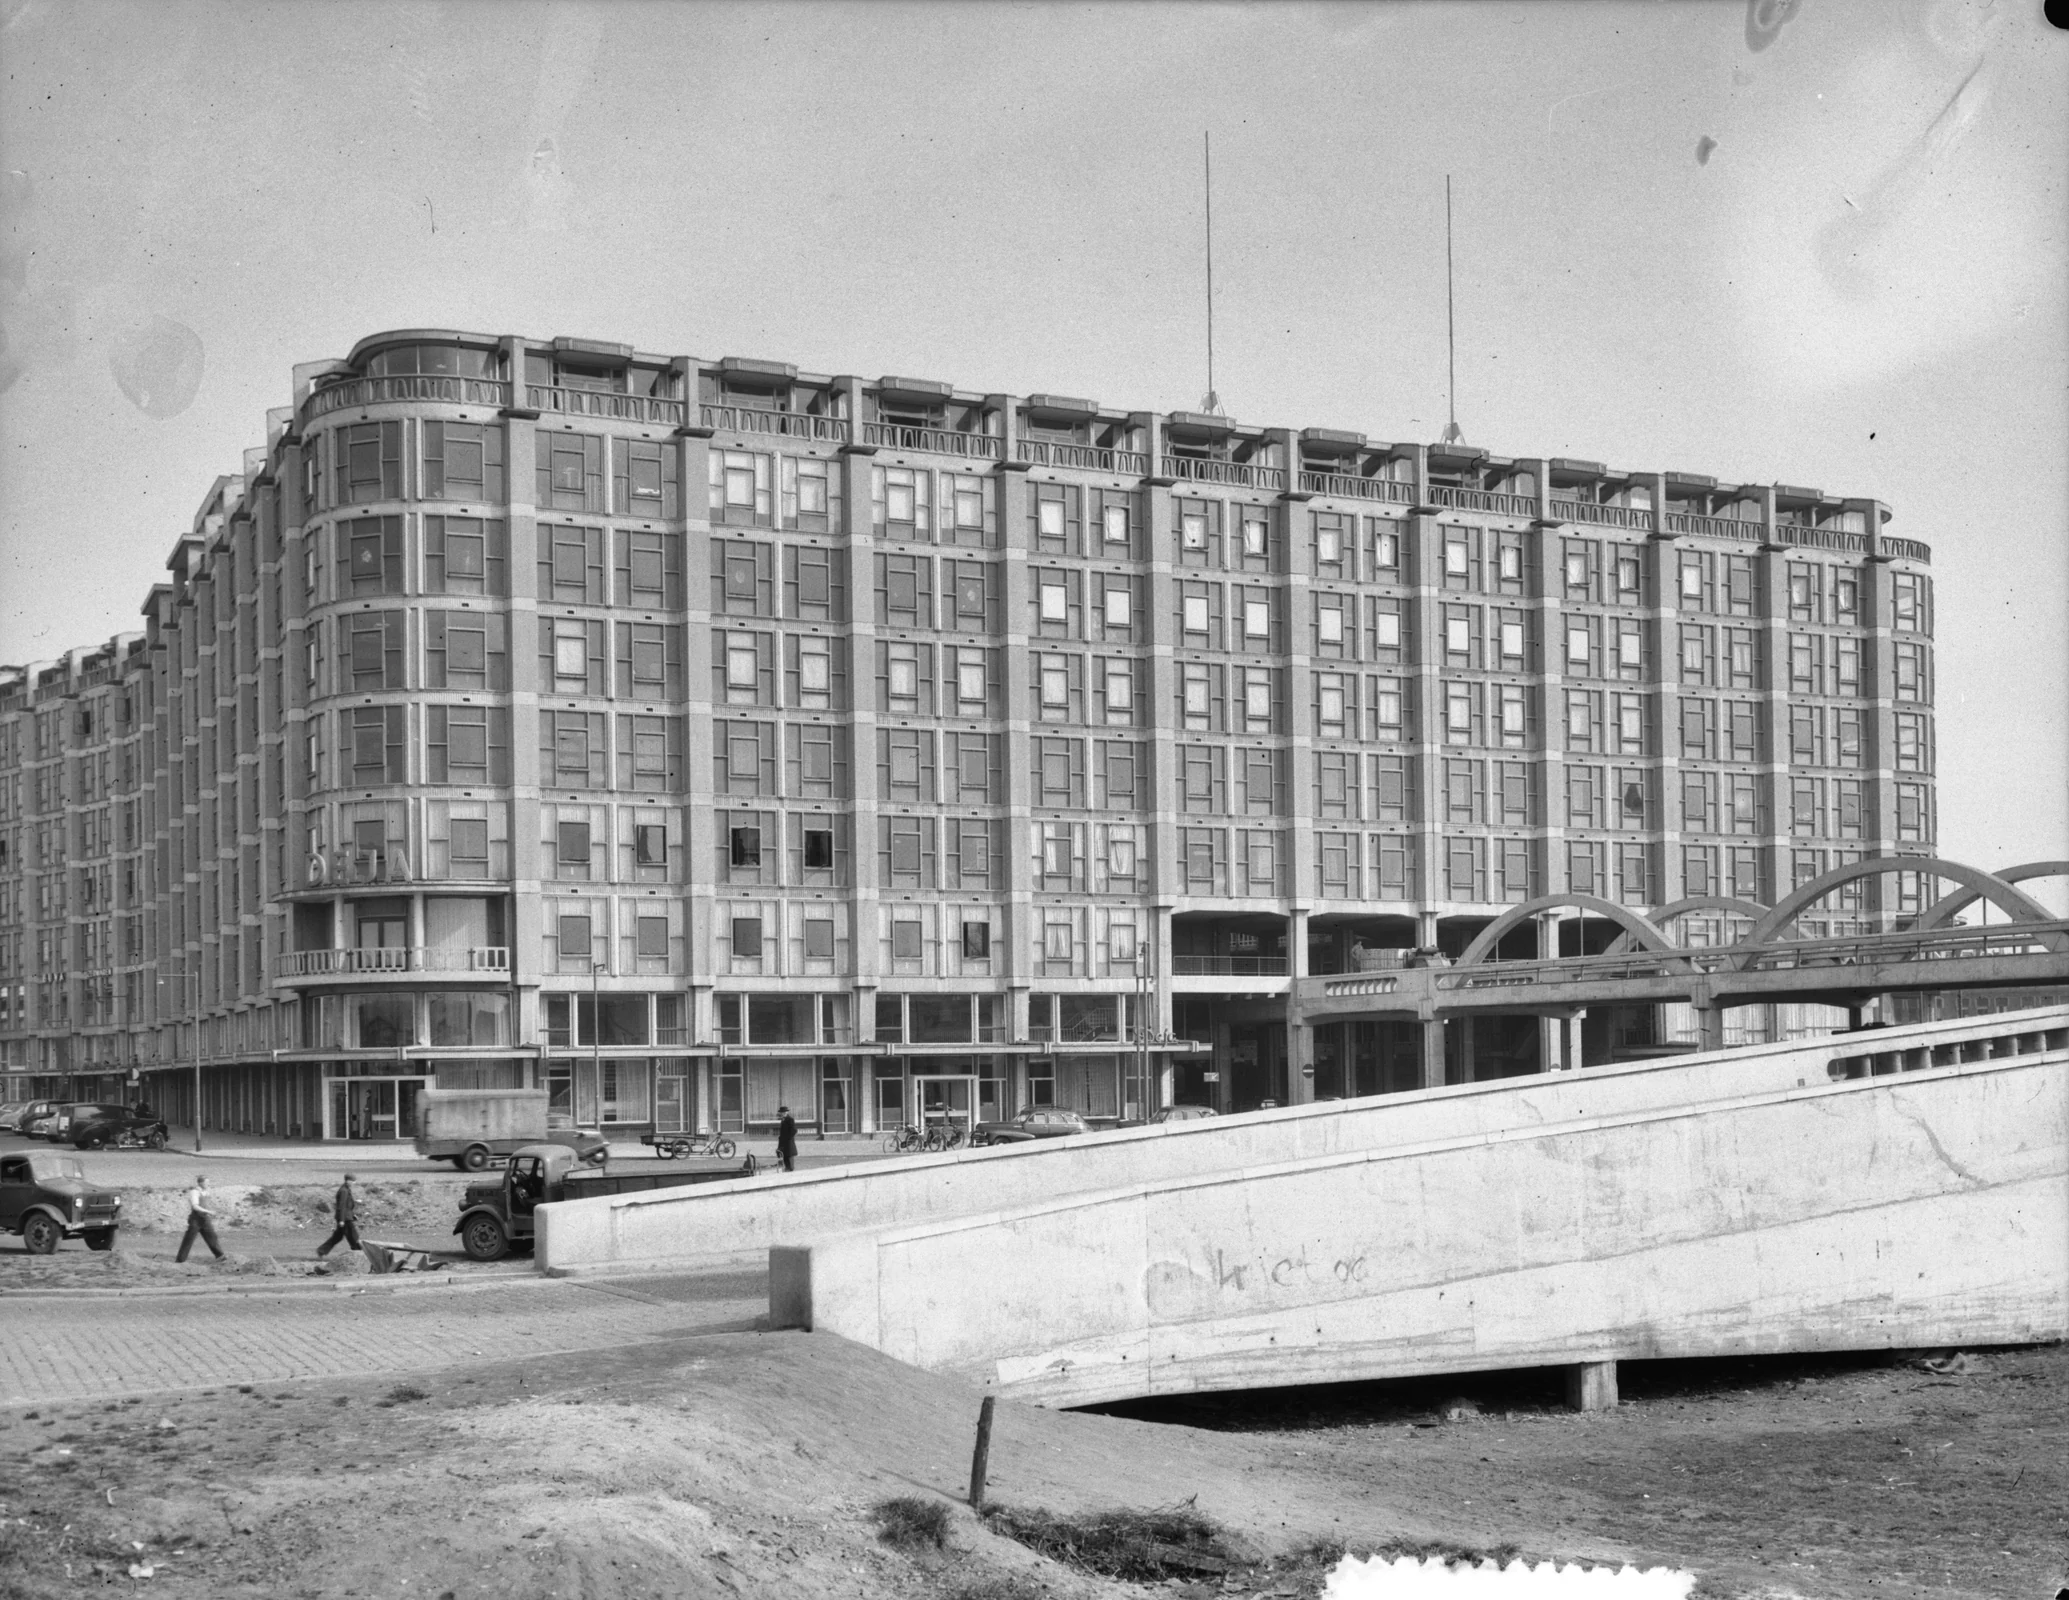
Photo credit: van Duinen / Anefo; 1953-03-24Commons file: Het Groothandelsgebouw in Rotterdam, Bestanddeelnr 905-6285.jpgLicense: CC0
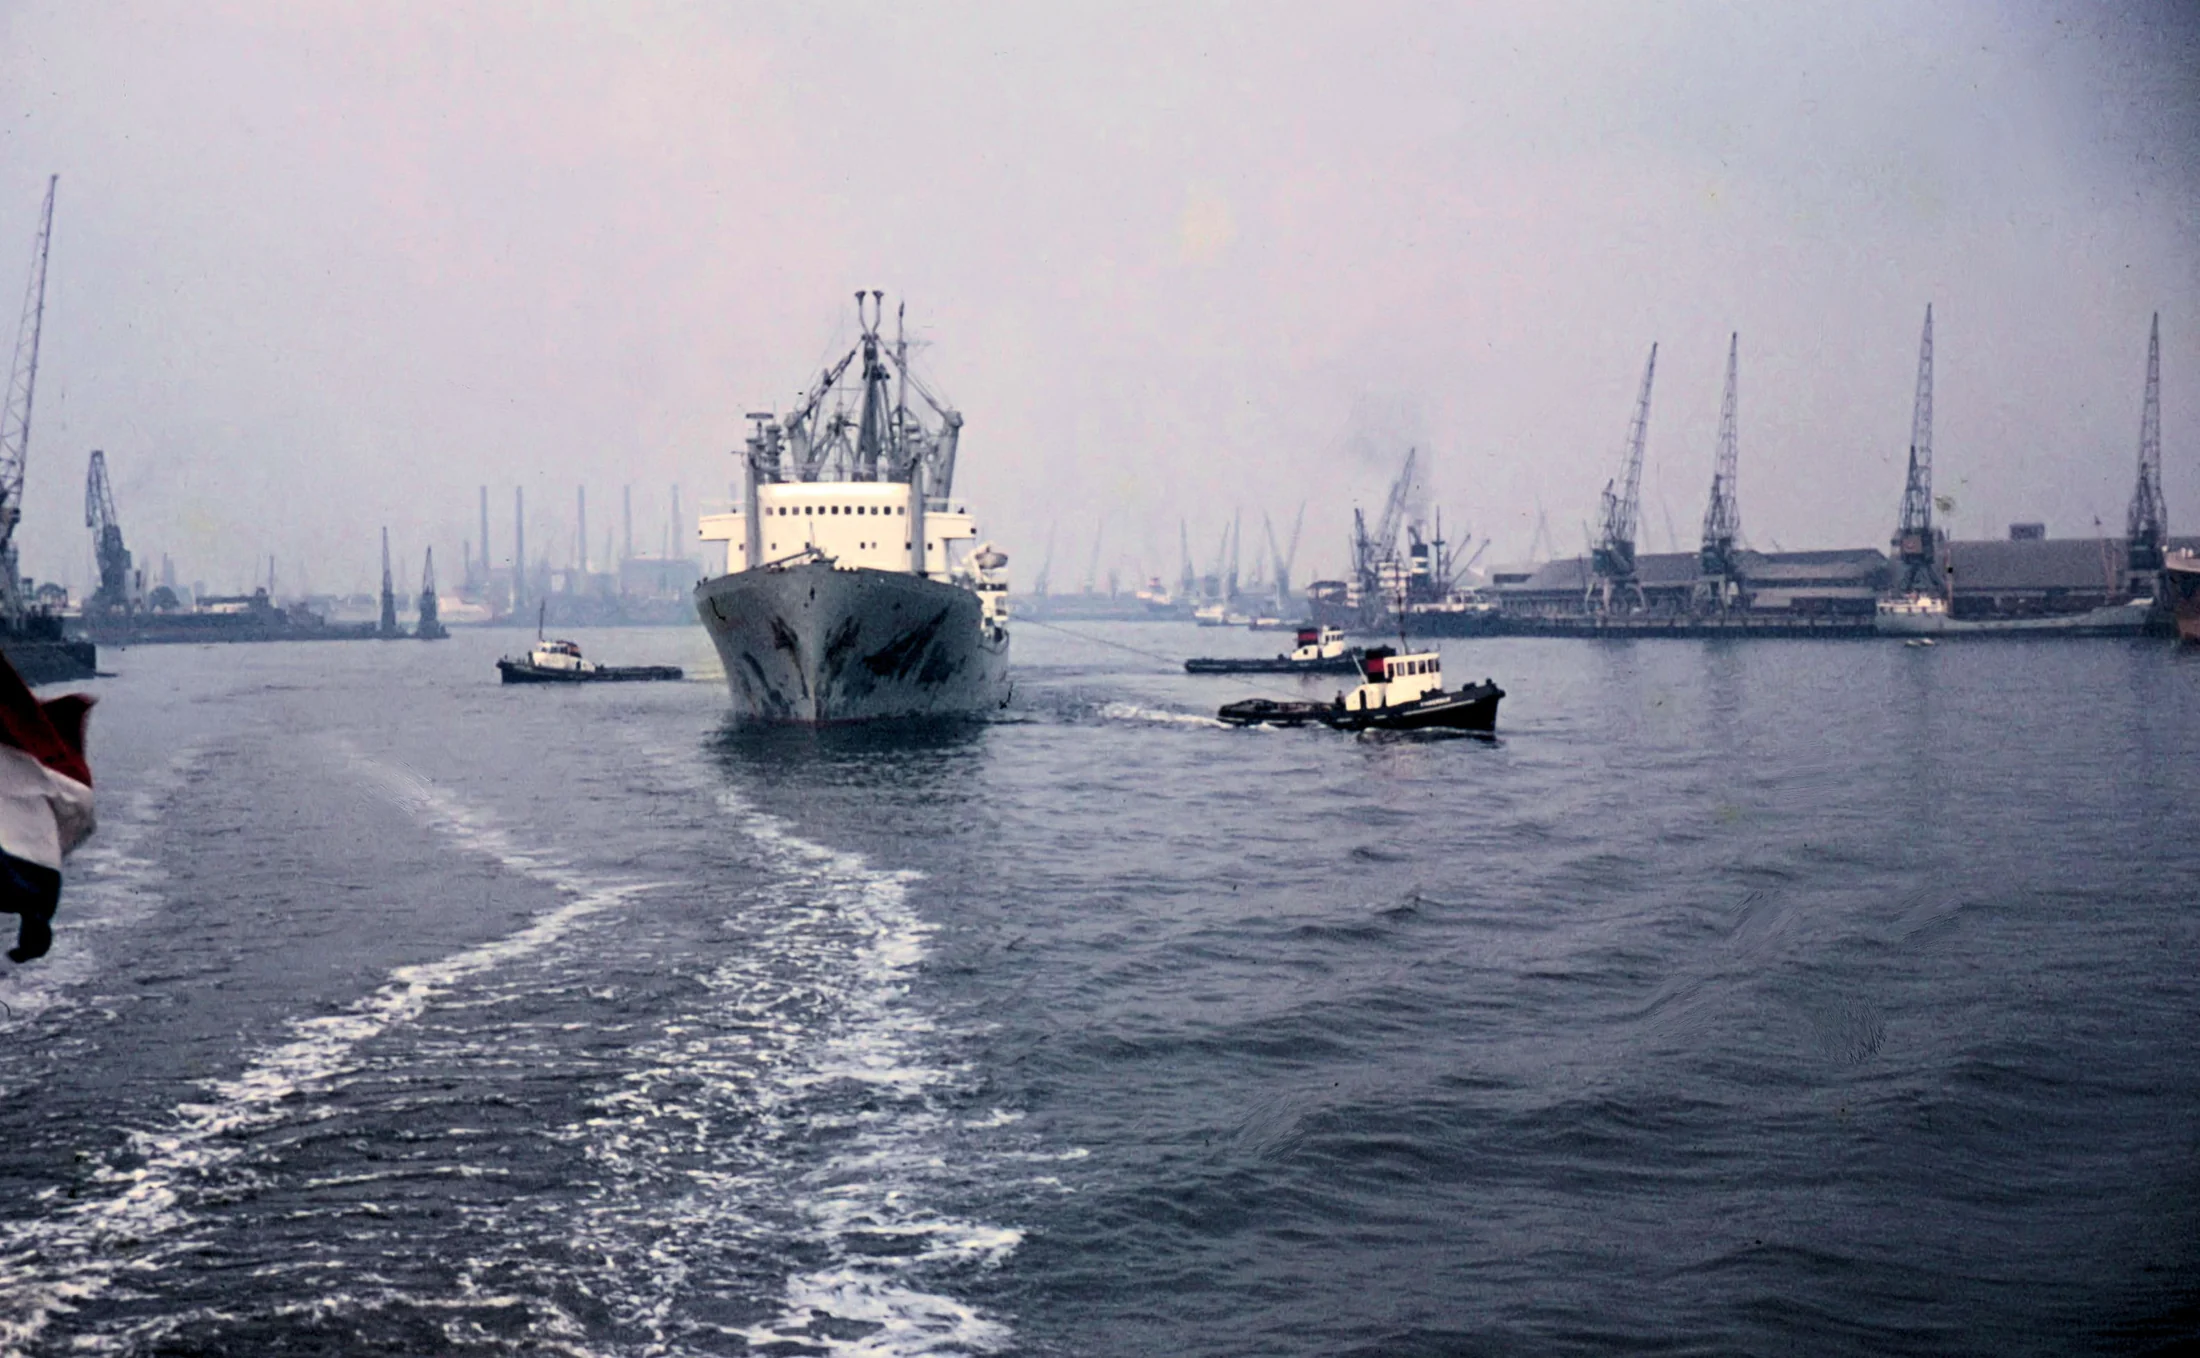
Photo credit: Olavtenbroek; 1962Commons file: Rotterdam harbour 1962.jpgLicense: CC BY-SA 3.0
- Stadsarchief Rotterdam — Plan van Traa and the Basisplan brochure
- Netherlands Cultural Heritage Agency — Lijnbaan complex
- Stadsarchief Rotterdam — Groothandelsgebouw opening
- Port of Rotterdam — a brief port history
- Rotterdam — urban history, heritage and reconstruction records
- Stadsarchief Rotterdam — the 1946 Basisplan brochure
- RCE — heritage record for the Lijnbaan ensemble
- Port of Rotterdam — Botlek and Europoort
- Rotterdam City Council — urban opening chronology
- Wederopbouw Rotterdam — Lijnbaan chronology
MEASURING RECOVERY
The comparable housing series begins in 1947, not 1940
At the end of 1947, Rotterdam’s total stock stood at 162,836 homes. Then came 168,523 in 1950, 187,020 in 1955 and 207,050 in 1960. From the 1947 baseline to 1960, that is a rise of 44,214 homes, about 27.1%.
The comparable housing series begins in 1947, not 1940. It measures total stock, not destroyed homes rebuilt. Separately, the 1944–45 Hunger Winter caused 2,448 deaths in Rotterdam; that toll belongs to occupation and famine, not the 1940 bombing.
The Cube Houses of 1984 and the Markthal, opened in 2014, close this chronology of architectural experiment. They show a city still changing, not unanimous agreement with postwar choices. Each final figure leaves its source and limit behind.
Total homes in stock at 31 December
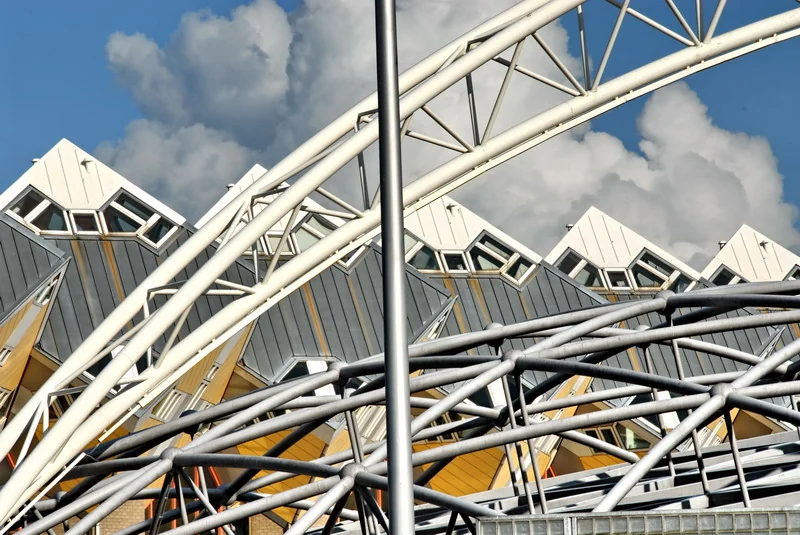
Photo credit: FaceMePLS from The Hague, The Netherlands; 2007-03-08Commons file: Rotterdam 'Kubuswoningen' (417354230).jpgLicense: CC BY 2.0
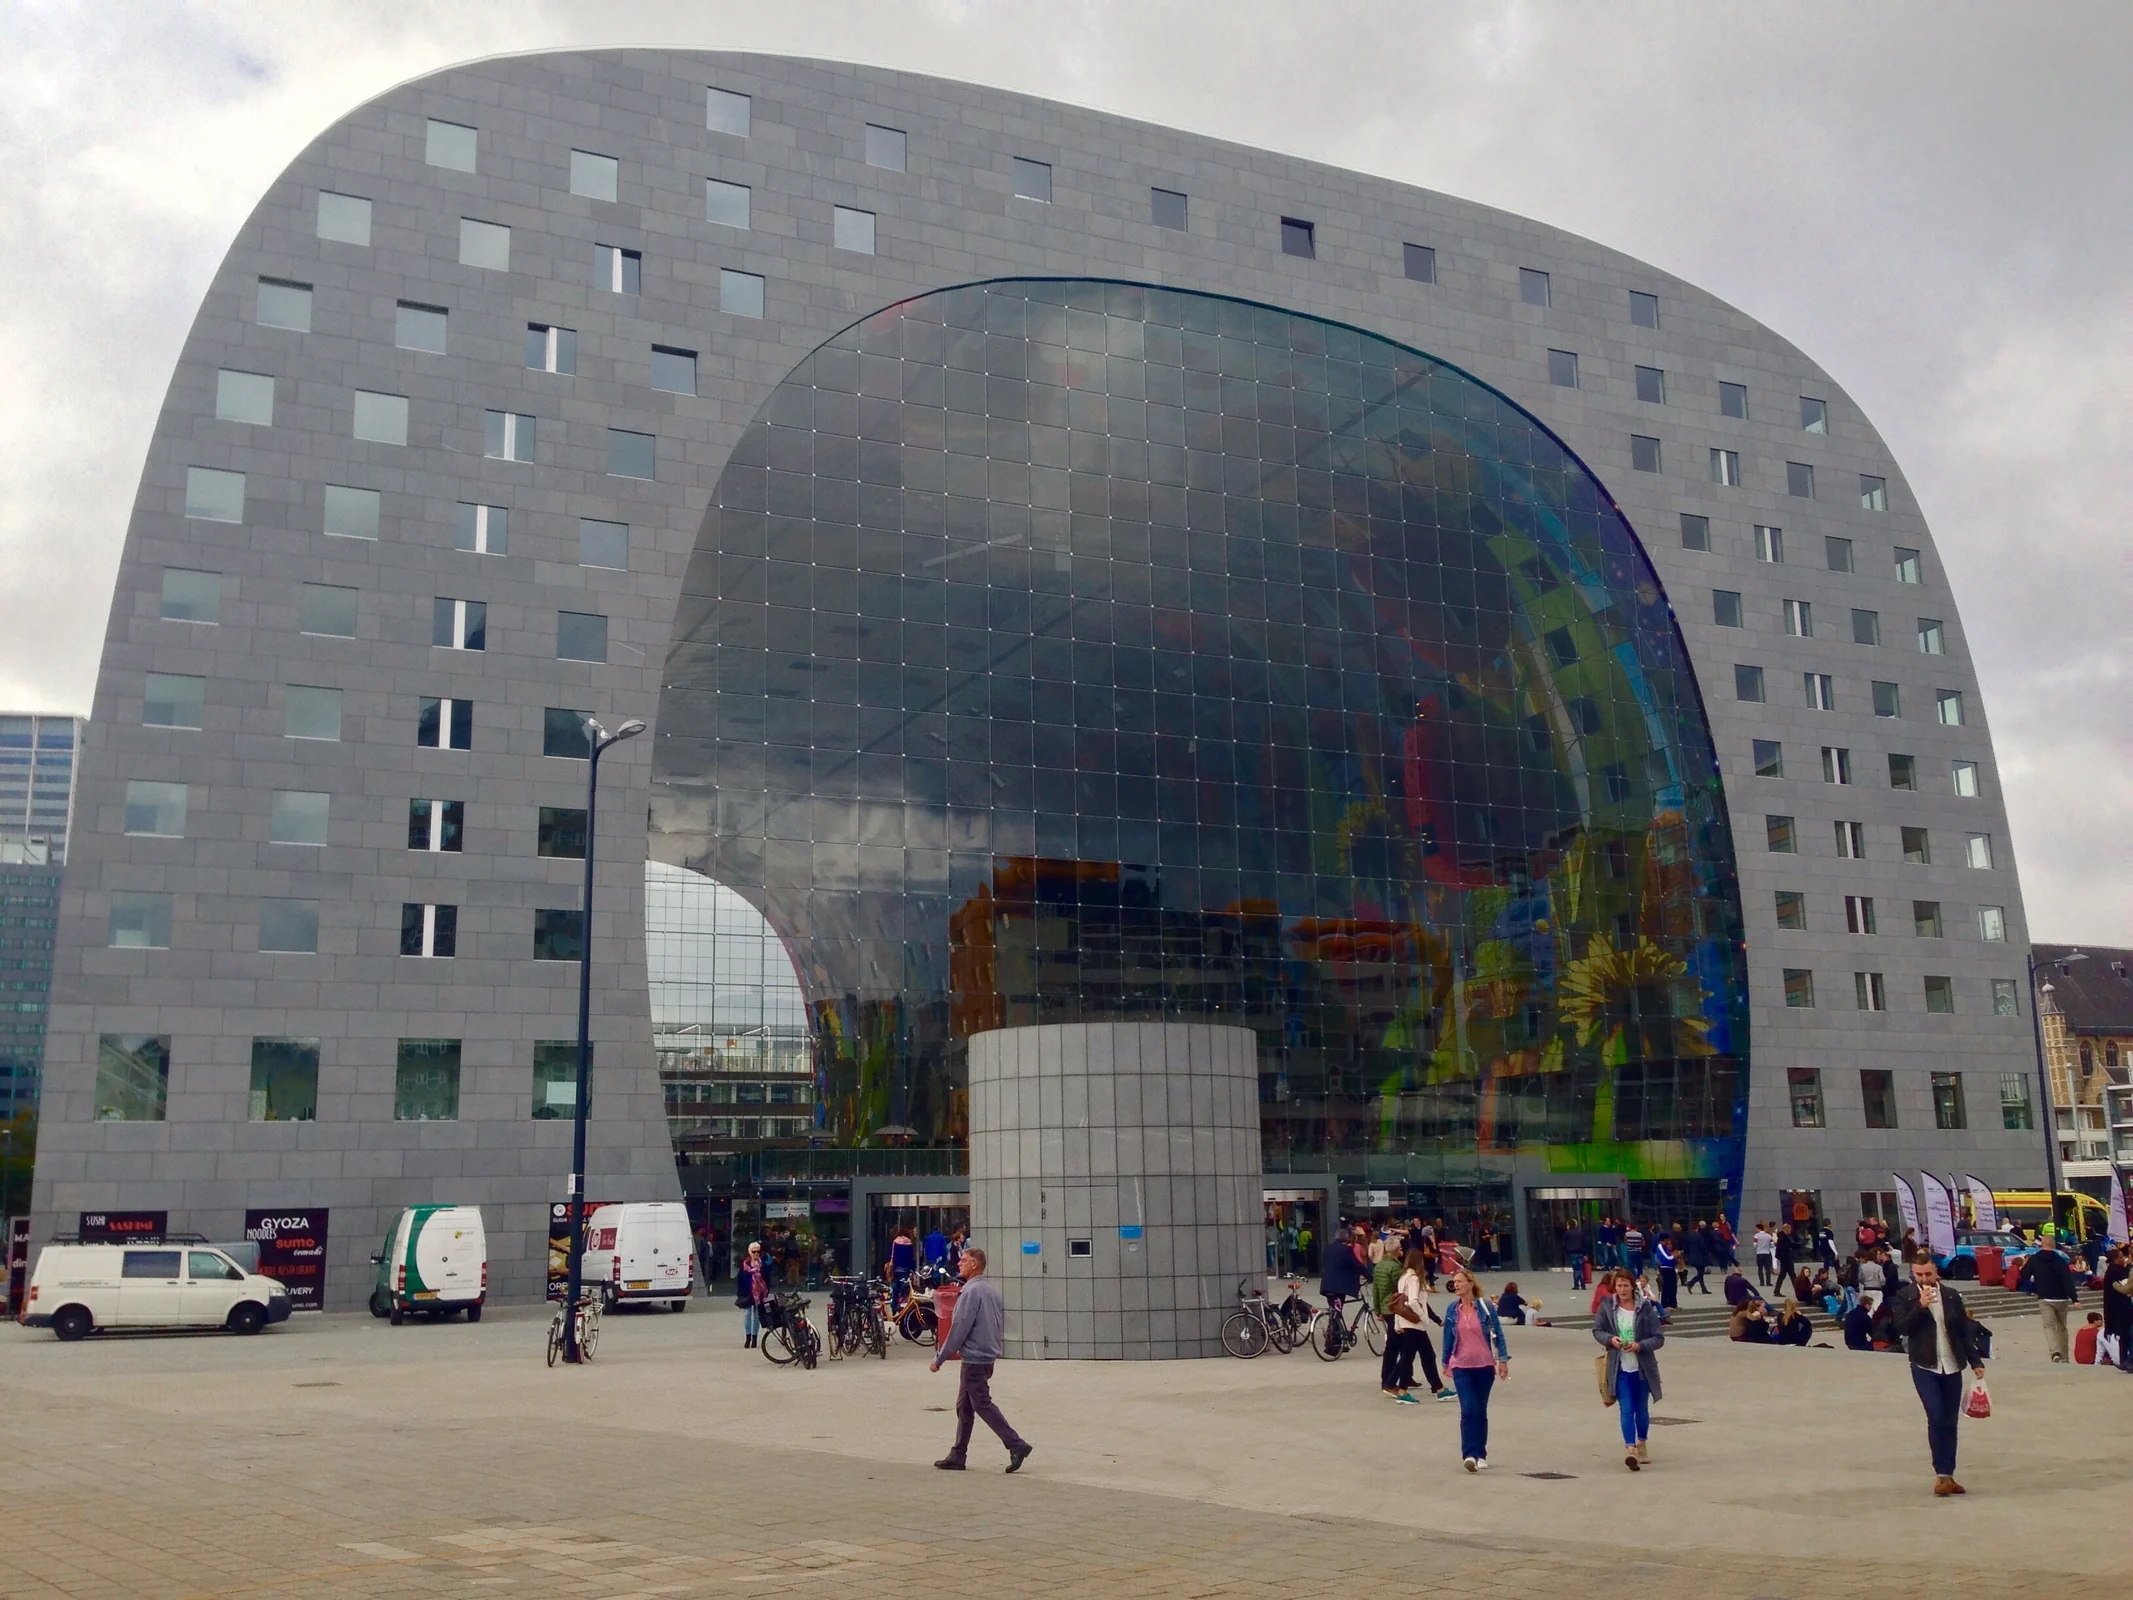
Photo credit: Exmpletree; 2014-10-17Commons file: Markthal-Rotterdam.jpgLicense: CC BY-SA 3.0
The increase from 1947 to 1960 is not a count of destroyed homes rebuilt.
- Rotterdam Library — local guide to the Cube Houses
- Rotterdam City Council — Omgevingsvisie chronology
- CBS — housing stock, 1947–2011
- Stadsarchief Rotterdam — De achterblijvers and the 1944–45 famine
- Rotterdam — urban history, heritage and reconstruction records
- CBS — total homes at 31 December
- Stadsarchief Rotterdam — famine deaths in the winter of 1944–45
- Rotterdam City Council — urban opening chronology
- Rotterdam Library — the Cube Houses since 1984
EVIDENCE AND LIMITS
The sources keep the map, register and memory distinct
Each figure keeps its own period and population. The municipal Fototechnische Dienst collection covers 1945–1965; later frames show the aftermath, not the moment of the bombing. The 15 May 2007 photograph shows an annual Brandgrens commemoration, not permanent lights.
Core sources
- V01Nationaal Archief — Rotterdam bombing photo dossier
- V02Laurenskerk — church history
- V03Stadsarchief Rotterdam — history of the Brandgrens lights
- V04Municipal historical map service, Rotterdam 1940 sheets at 1:5,000
- V05UNESCO Memory of the World — Rotterdam local capitulation document
- V06Stadsarchief Rotterdam — Plan van Traa and the Basisplan brochure
- V07Netherlands Cultural Heritage Agency — Lijnbaan complex
- V08Stadsarchief Rotterdam — Groothandelsgebouw opening
- V09Rotterdam Library — local guide to the Cube Houses
- V10Rotterdam City Council — Omgevingsvisie chronology
- V11Port of Rotterdam — a brief port history
- V12CBS — housing stock, 1947–2011
- V13NIMH — chronology of the Dutch capitulation
- V14RAF Air Historical Branch — translation of German records on the stop signal
- V15Stadsarchief Rotterdam — De achterblijvers and the 1944–45 famine
- V16Rotterdam — urban history, heritage and reconstruction records
Additional sources
- R01Stadsarchief Rotterdam — Rotterdam at war
- R02Stadsarchief Rotterdam — albums of the destroyed city
- R03Stadsarchief Rotterdam — bombing-victim research
- R04NIOD — estimates of bombings in the Netherlands
- R05Stichting Voorouder — civilians linked to the 14 May 1940 bombing
- R06Stichting Voorouder — suspected cases in Rotterdam, May 1940
- R07Stichting Voorouder — names and categories in Rotterdam, 10–14 May
- R08NIMH — national capitulation and its documents
- R09UNESCO — Rotterdam capitulation document, Museum Overloon
- R10RAF AHB — 1954 translation of captured records
- R11NTR — Bombarderen of niet?
- R12Kesselring testimony at Nuremberg, 15 March 1946
- R13Laurenskerk — restoration from 1952 to 1968
- R14Stadsarchief Rotterdam — the 127 Brandgrens lights
- R15BKOR — the Brandgrens artwork
- R16Stadsarchief Rotterdam — the 1946 Basisplan brochure
- R17RCE — heritage record for the Lijnbaan ensemble
- R18Port of Rotterdam — Botlek and Europoort
- R19CBS — total homes at 31 December
- R20Stadsarchief Rotterdam — famine deaths in the winter of 1944–45
- R21Rotterdam City Council — urban opening chronology
- R22Wederopbouw Rotterdam — Lijnbaan chronology
- R23Rotterdam municipality — 1940 technical map sheets at 1:5,000
- R24OpenStreetMap — attribution and usage terms
- R25Stadsarchief Rotterdam — Gemeentewerken collection, 1945–1965
- R26Nationaal Archief — contemporary photographs from May 1940
- R27Stadsarchief Rotterdam — photographic albums after the bombing
- R28Rotterdam Library — the Cube Houses since 1984