SAN FRANCISCO · 18 APRIL 1906
The 1906 San Francisco earthquake: a city measured by its traces
Around 5:12 a.m., the ground shook. Fire burned for three days; rebuilding took longer. San Francisco keeps the traces of both—and figures that count differently.
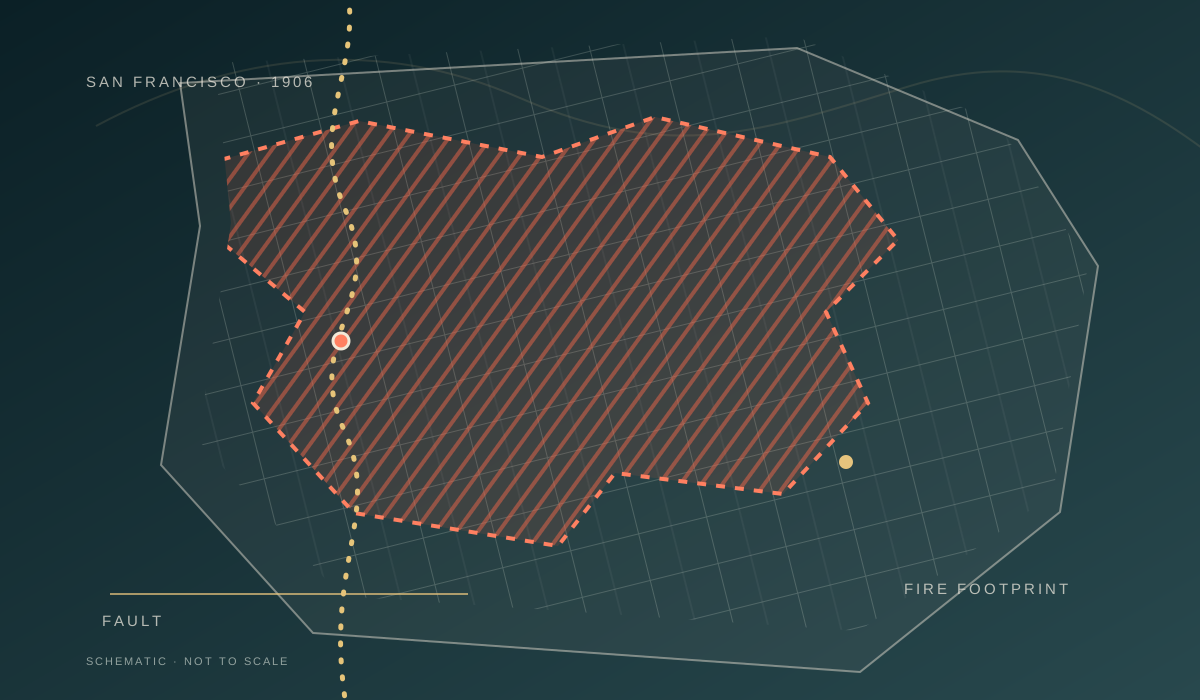
Before the flames
The rupture crossed far beyond the city
Around 5:12 a.m., residents felt a foreshock. The main shock followed 20–25 seconds later; shaking lasted about 45–60 seconds across the Bay Area. The modern consensus is Mw 7.9, calculated retrospectively; the Lawson Commission did not measure it in that form.
USGS reconstructs the San Andreas rupture across about 296 miles (477 km), from the San Juan Bautista area north toward Cape Mendocino. The familiar 8.3 and 8¼ are traditional estimates tied to later magnitude methods, not a modern Mw measurement made by Lawson.
Shaking damaged buildings; the effects varied with structure and ground. Fire then caused most of the urban destruction.
The Ferry Building clock cannot pin the moment exactly. Popular accounts say 5:12, a contemporary newspaper reported 5:16, and accounts note that the clock may have run fast. Water and gas mains left a different trace.
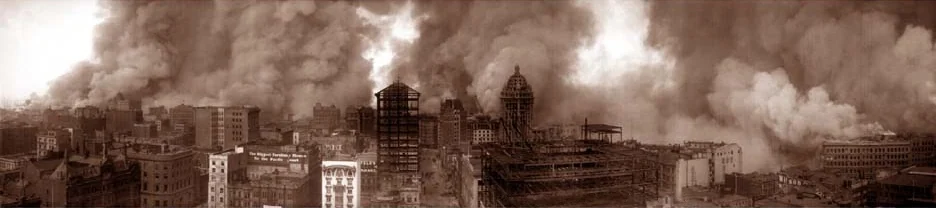
Credit: Pillsbury Picture Co.; 18 April 1906Commons file: San francisco fire 1906.jpgLicense: Public domain
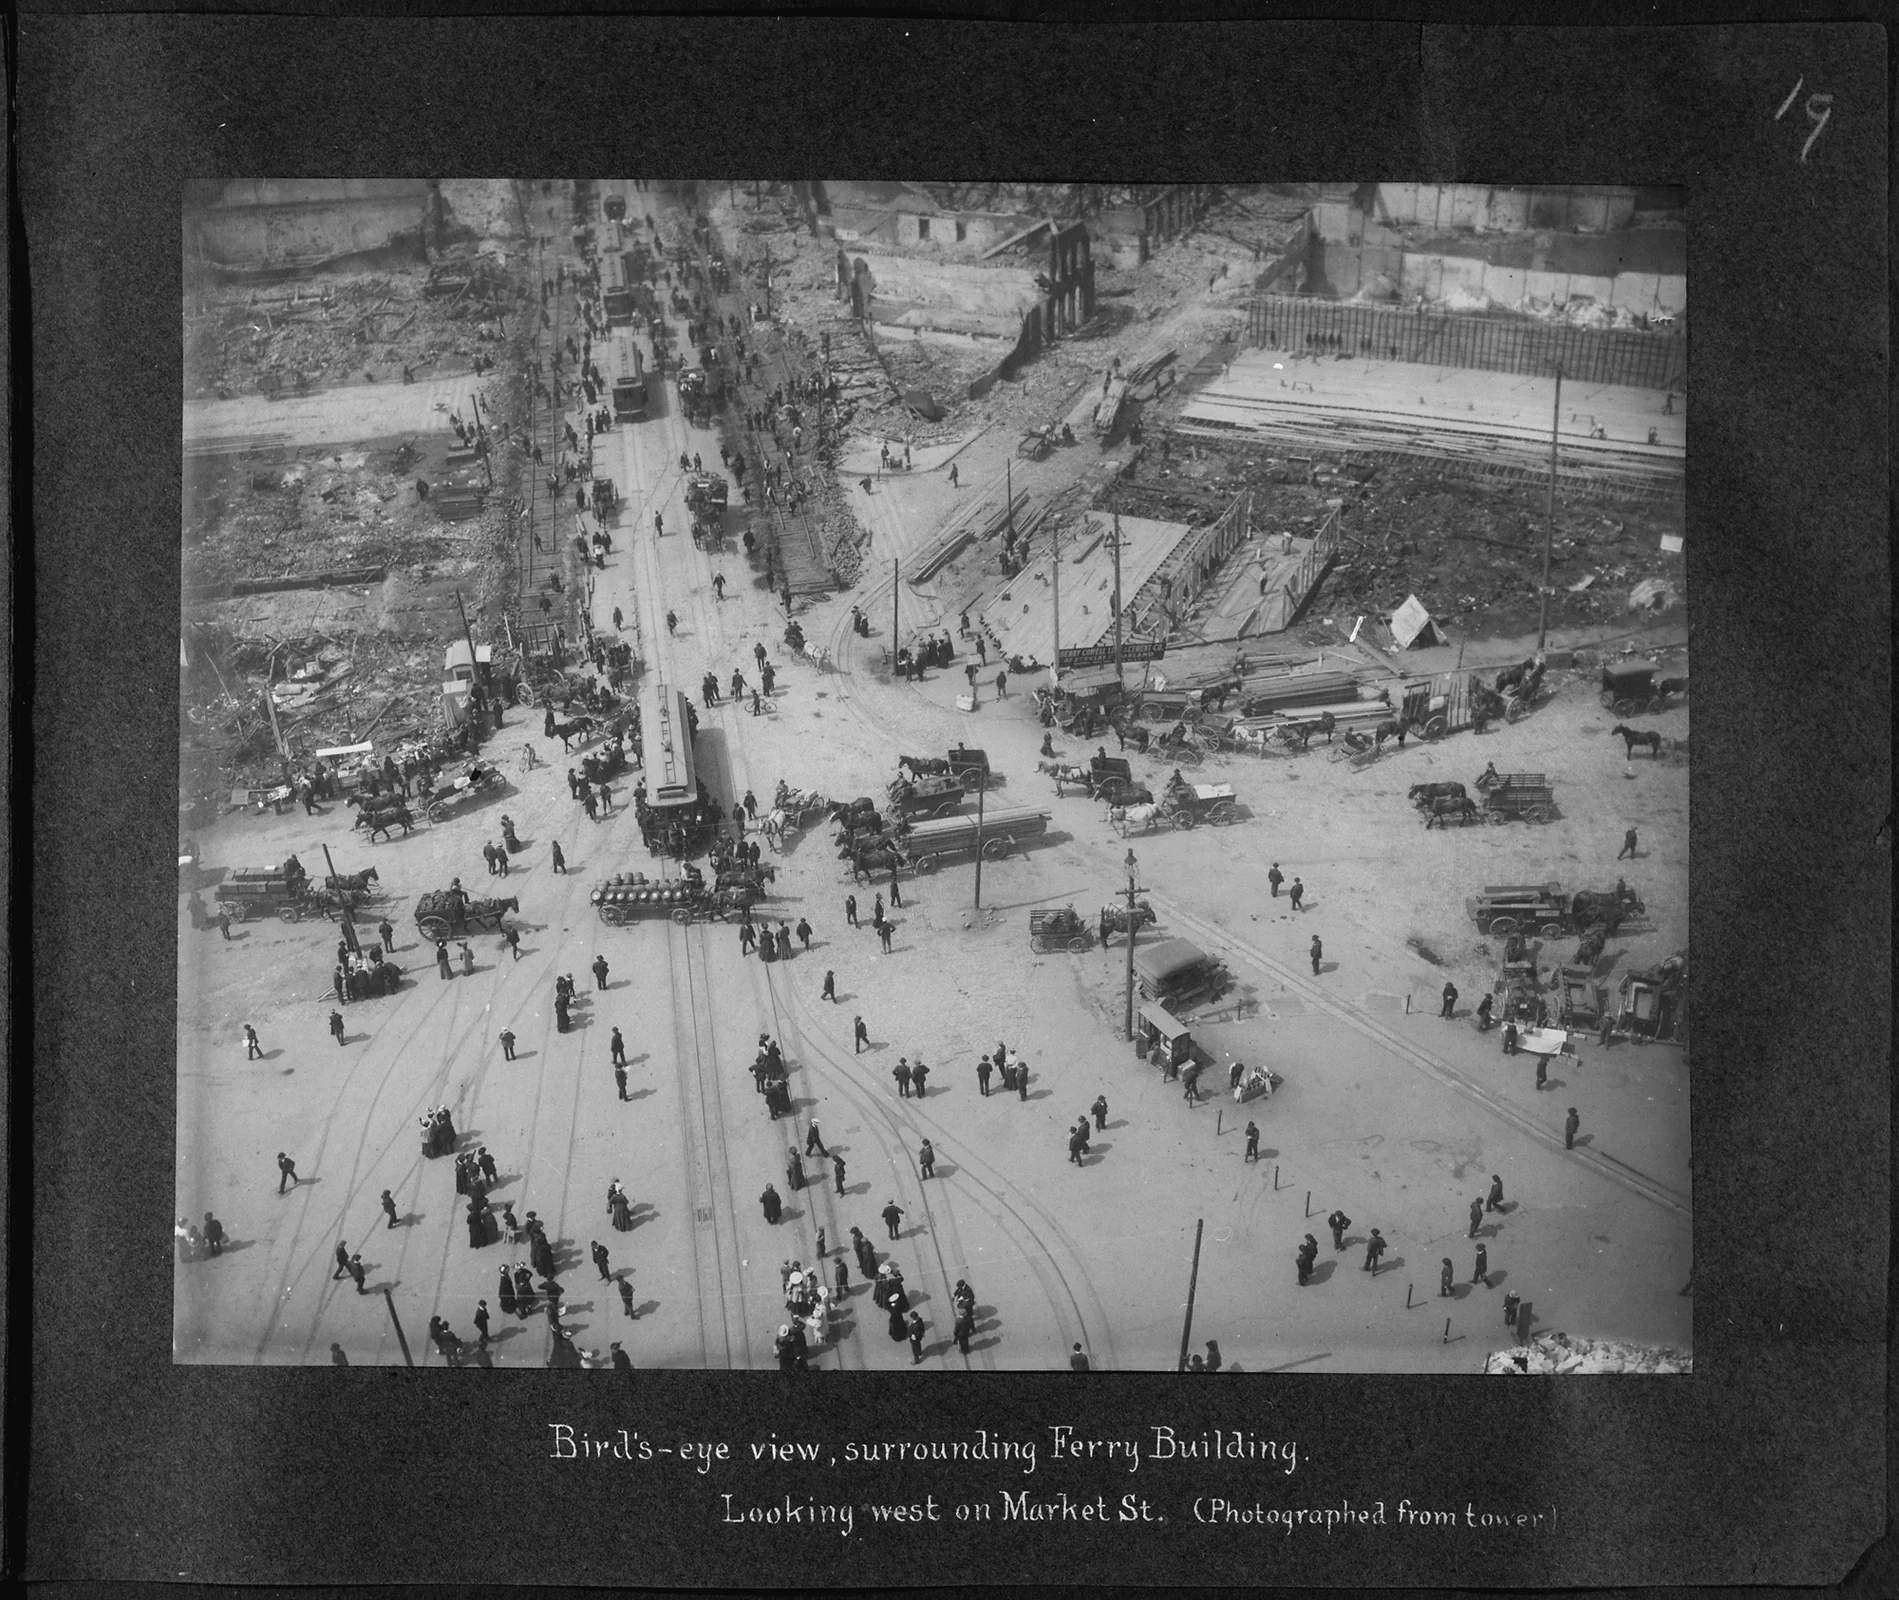
Credit: Chadwick, H. D., Photographer ( NARA record: 8467279 ); April 1906Commons file: San Francisco Earthquake of 1906, Bird's-eye view, surrounding Ferry Building. Looking west on Market Street.... - NARA - 524397.tifLicense: Public domain
When the water failed
A broken network changed the scale of the disaster
The earthquake broke water and gas mains and damaged the water system. With too little water for fire crews, separate ignitions joined into one conflagration. It burned through 21 April: three days of urban fire.
Fire caused most of the urban destruction; shaking also damaged buildings. The City Hall ruins make that damage visible. Contemporary studies record different outcomes by building and ground.
On the map, the fire has an outline. DataSF digitizes the boundary R.J. Waters & Co. drew in 1906: a mapped footprint, not a sequence of daily fire fronts.
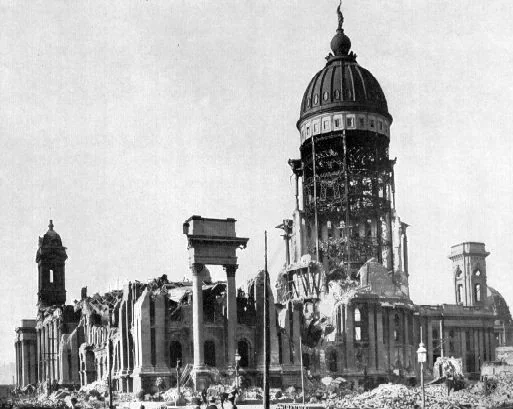
Credit: Frank Soule; 1906Commons file: San-Francisco City Hall 1906.jpgLicense: Public domain
Read the boundary as the fire’s footprint; sources use different limits and methods.
What 80% measures
Property value is not the area that burned
A contemporary insurers’ report estimated that the fire destroyed at least 80% of the city’s pre-fire property value. It did not say that 80% of San Francisco’s land burned.
The report gave about 2,381 acres, or 3.72 square miles; other sources draw boundaries around 4.7. Across the sources, the burned area ranges from 3.7 to 4.7 square miles. The range stays visible because outlines and counting methods differ.
Dynamiting left a mixed record. Some attempts started new fires; others failed to make an effective break.
The claim that dynamiting “burned more than it saved” cannot be measured from the available evidence.
The Van Ness defense line held as the wind changed and water supplies returned. Military and naval crews also worked the hoses.
80% = estimated pre-fire property value. The burned footprint remains a range.
A history of the count
478 is a record floor, not a complete census
The city’s official 1907 count stops at 478 recovered or recorded deaths. The Army kept a separate tally: 498 deaths in San Francisco, plus deaths elsewhere. NOAA later called 700–800 reasonable.
Gladys Hansen and Emmet Condon argued from archival research that direct and indirect deaths exceeded 3,000. USGS commonly uses that estimate; Hansen later cited more than 3,400. These are attributed estimates, not a final list of identified people.
A 2005 city resolution set aside the 478 figure and said few, if any, Chinatown deaths had been included. It also noted suspected victims of shootings against looters.
Hansen argued that commercial interests minimized the toll to protect the city’s business recovery. That remains her explanation, not a conclusion proved by one document.
| Figure | Record | What it counts | Limit |
|---|---|---|---|
| 478 | City’s official count, 1907 | Recovered or recorded deaths in the municipal record | Not a complete census; the 2005 resolution said Chinatown deaths were almost certainly missing. |
| 498 | Army report for San Francisco | Separate military record; deaths elsewhere also counted | A different administrative series, not a direct correction of 478. |
| 700–800 | NOAA assessment cited later | Range called reasonable in a later synthesis | An estimate, not a named list or municipal count. |
| >3,000 | Hansen and Condon; commonly cited by USGS | Archival estimate of direct and indirect deaths | Attributed estimate; not a final count of identified people. |
The rows use different places, methods and periods; they are not one unified list.
Geographies, methods and periods differ: the rows neither add up nor replace one another.
Shelter and return
Hundreds of thousands left; recovery was not shared equally
Sources estimate that between about 225,000 and more than 250,000 people were displaced. Before the earthquake, the city was described as having roughly 400,000–410,000 residents. The Army managed many camps, including at the Presidio, Golden Gate Park and Fort Mason.
The cottage program is often put at roughly 5,300 homes. NPS says they housed about 16,000 people at peak. The figures do not form a complete register of residents or cottages. Two Presidio cottages survive as historic objects.
Before the disaster, Chinatown had about 15,000 residents; NPS says around 400 remained immediately afterward.
Chinese residents faced segregated camps and exclusion from some aid. Officials discussed moving the district to Hunters Point.
Community leaders resisted and returned to rebuild. The later “Oriental” architectural vision took shape under racist constraints and economic pressure.
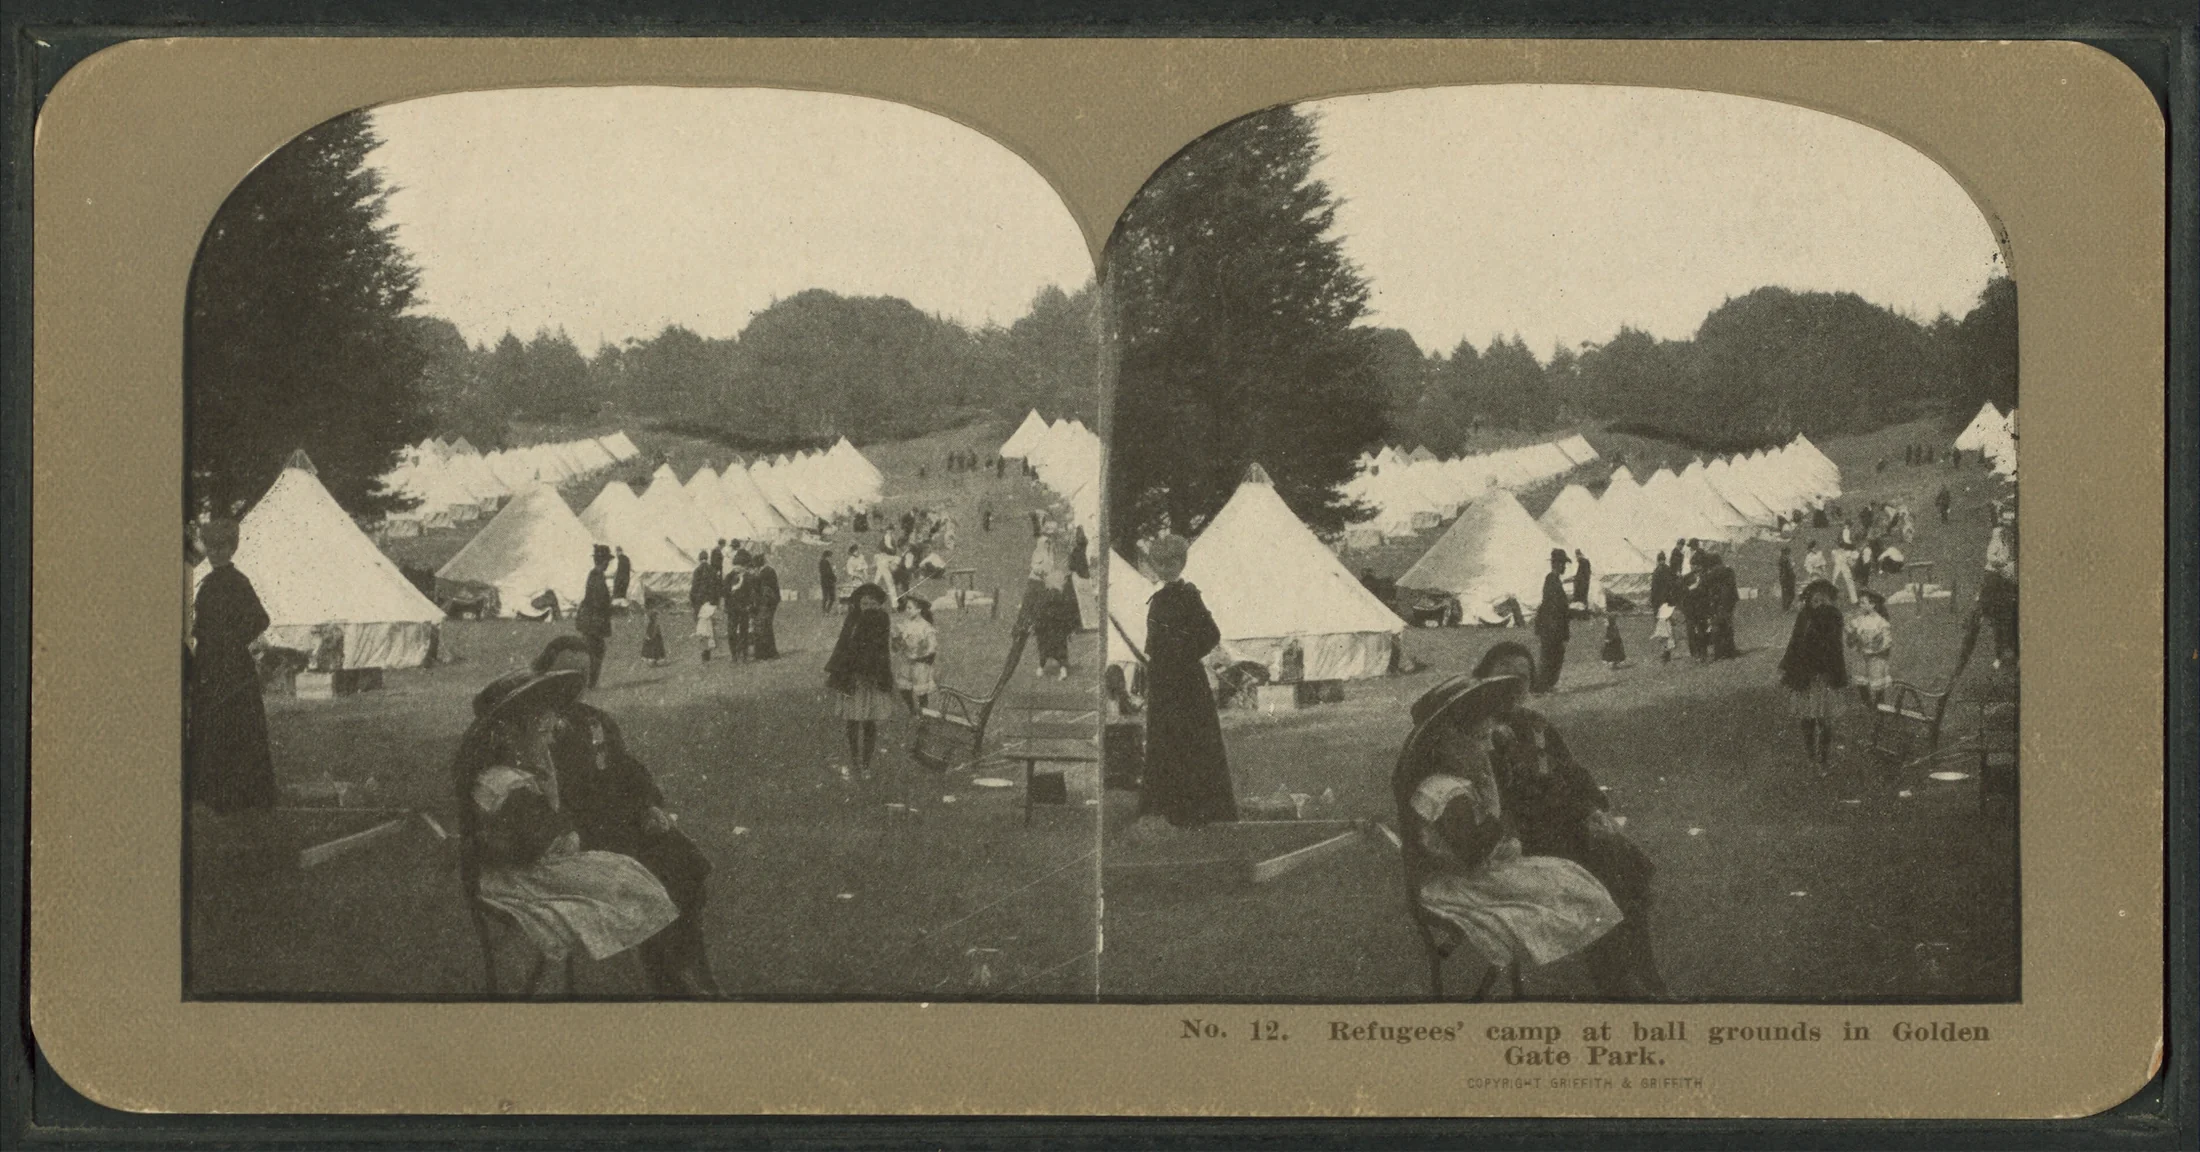
Credit: Griffith & Griffith -- Publisher; 1906Commons file: Refugees' Camp at ball grounds in Golden Gate Park, by Griffith & Griffith.pngLicense: Public domain
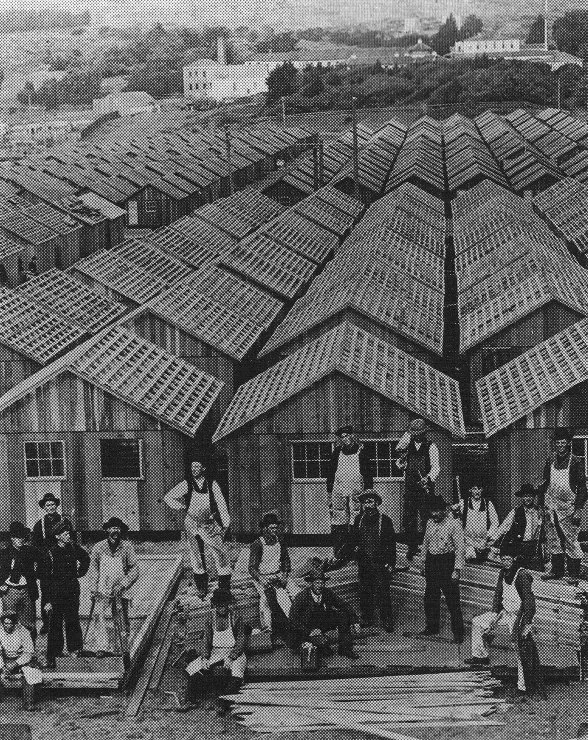
Credit: NPS; 1906Commons file: Row of shacks, 1906 earthquake in San Francisco.jpgLicense: Public domain
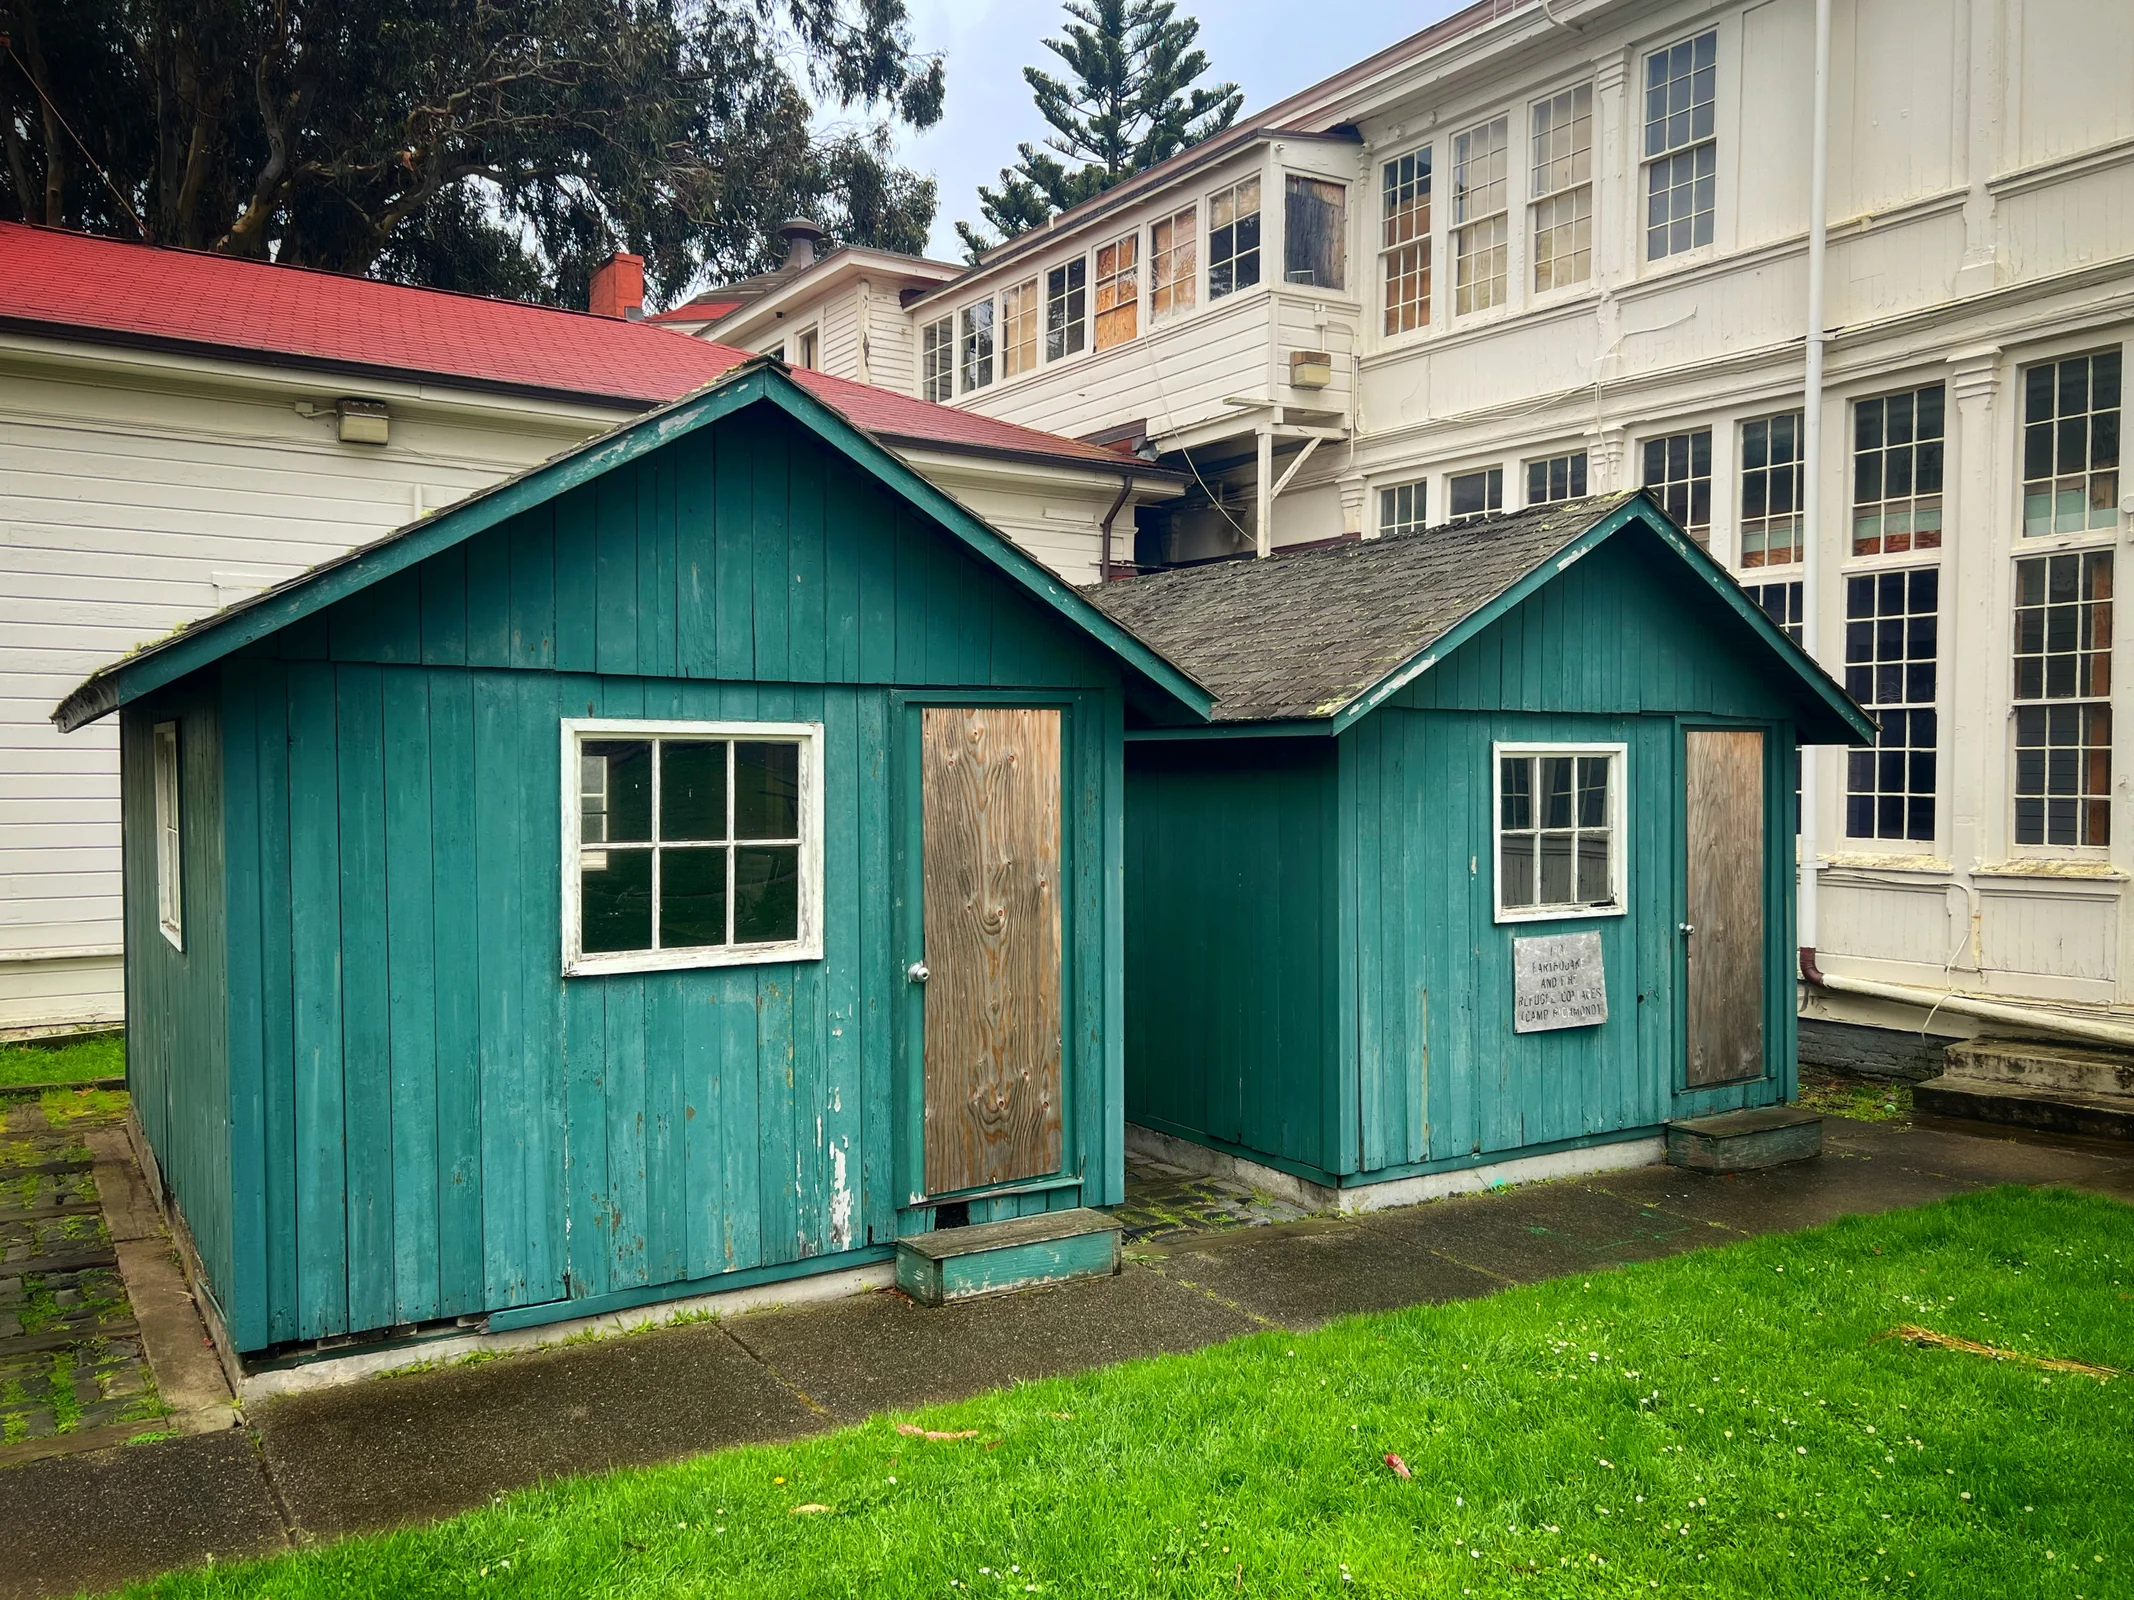
Credit: Elena.laps; 2024-03-03Commons file: San Francisco 1906 earthquake shacks Presidio.jpgLicense: CC BY 4.0
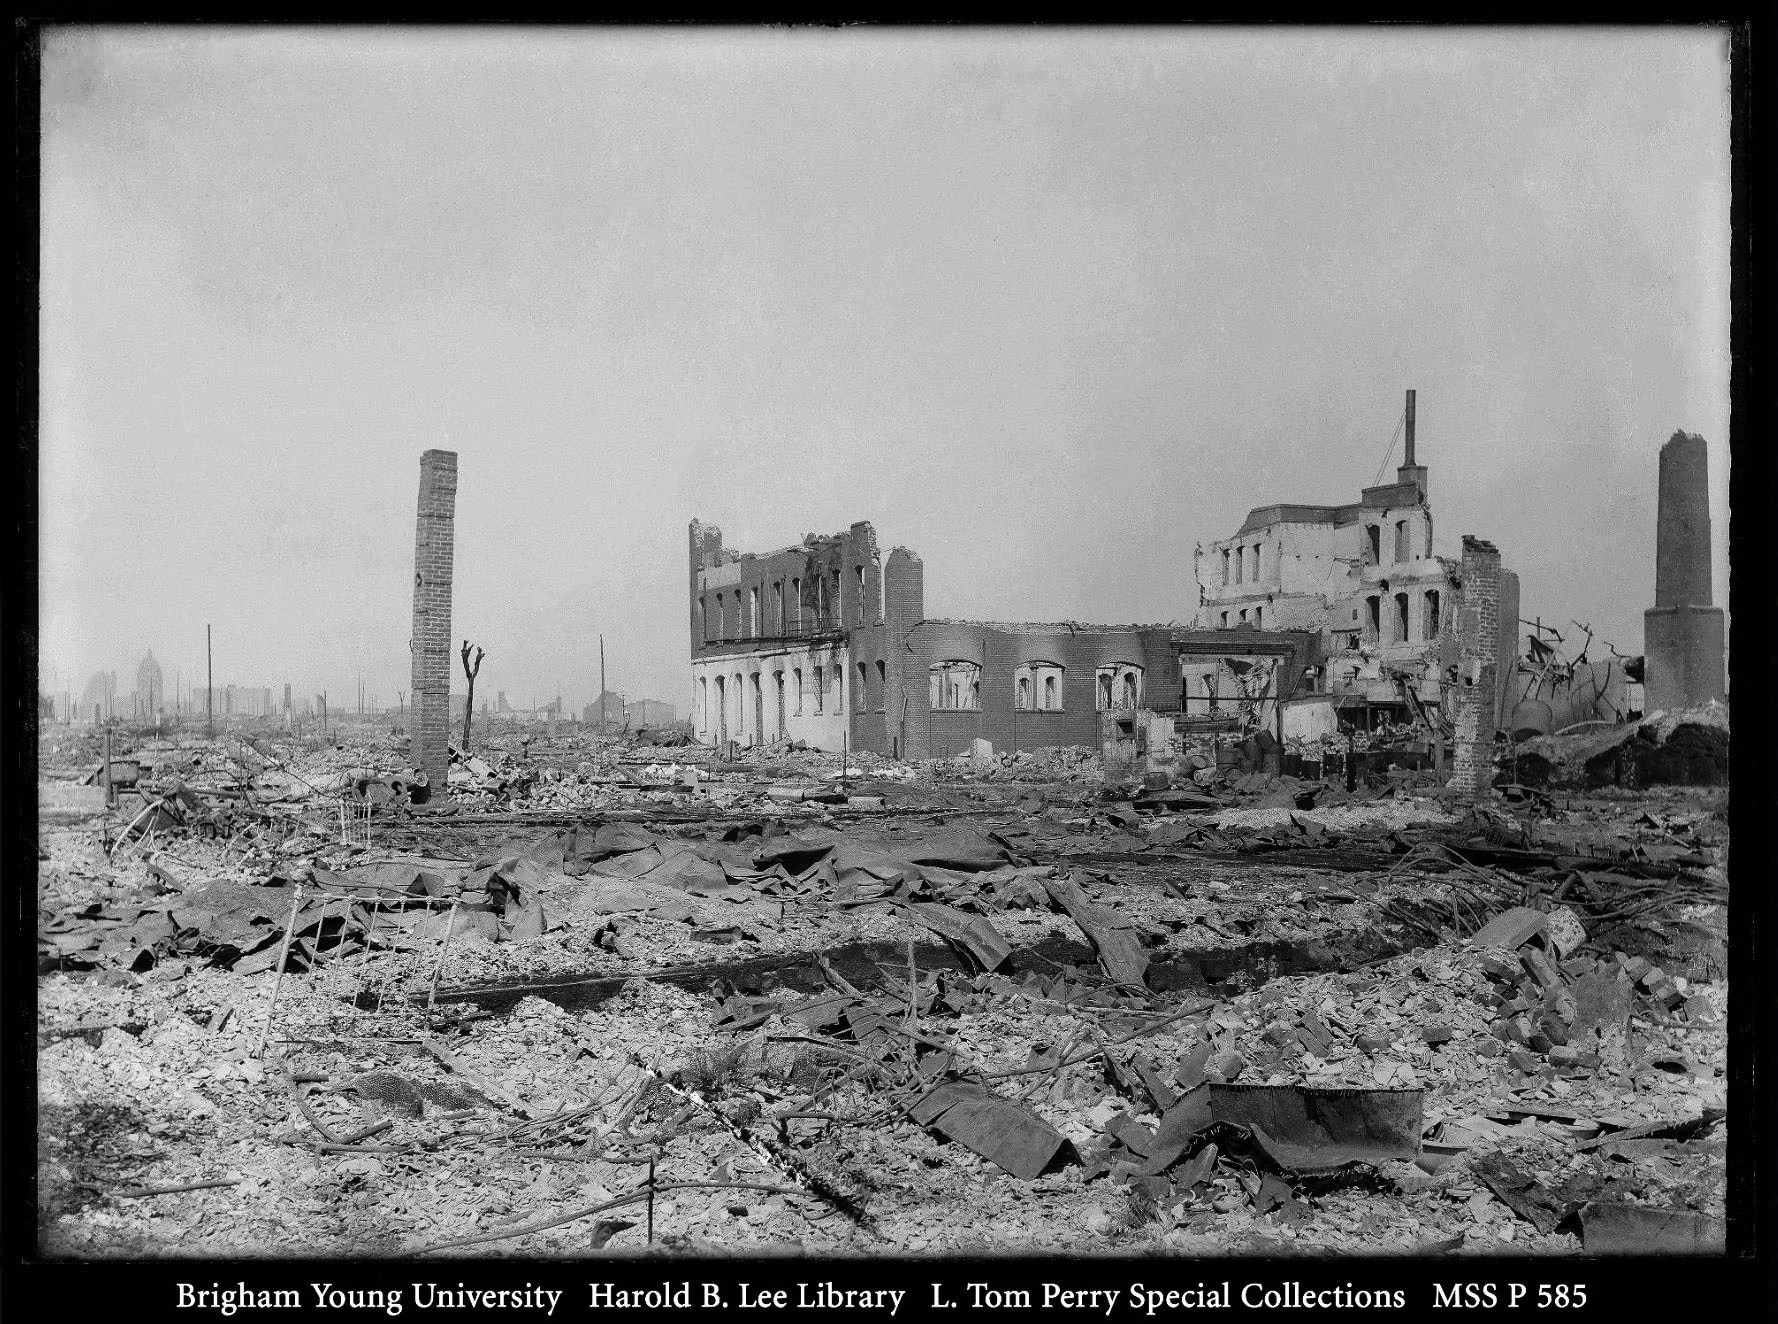
Credit: Edith Irvine; 1906Commons file: Chinatown after San Francisco Earthquake 1906.jpgLicense: Public domain
Displacement, camp and cottage counts are estimates from different sources and periods.
- National Archives — relief and discrimination after the earthquake
- NPS — camps and temporary accommodations
- NPS — treatment of Chinese residents
- LOC — Golden Gate Park refugee camp
- SF Planning — historic context for relief housing
- National Park Service — preserved Presidio cottages
- LOC — Chinatown images after the fire
A mistaken attribution
The handbill was Mayor Schmitz’s, not a Funston proclamation
Mayor Eugene Schmitz issued the handbill ordering looters shot. Retellings sometimes assign it to General Frederick Funston; the document was not Funston’s proclamation.
The National Park Service concludes that neither Schmitz nor Funston officially declared martial law. Orders overlapped, shots were fired, and legal authority was disputed. Funston’s role and responsibility for civilian deaths remain contested in the historical record.
The panel is an editorial diagram of the attribution, not a facsimile of the historical handbill.
Attribution: Mayor Eugene Schmitz. NPS: neither Schmitz nor Funston formally declared martial law.
Rebuilding at two speeds
Downtown returned quickly; the city kept rebuilding
Shops, commercial activity and many downtown buildings returned quickly. Broader recovery continued through the following decade; the entire city was not rebuilt in three years.
Federal censuses counted 342,782 residents in 1900, 416,912 in 1910 and 506,676 in 1920. These three decennial snapshots do not isolate migration or prove that the disaster alone caused the increase.
In 1915 San Francisco hosted the Panama-Pacific International Exposition. The fair celebrated the Panama Canal and the city’s return; it does not prove recovery was complete or shared equally.
The fire ends; commercial activity begins to return.
Downtown rebuilds rapidly; census totals also reflect other changes.
The Panama-Pacific Exposition marks a public return, not equal recovery.
The wider city continues to rebuild.
Census population counts are snapshots, not a year-by-year rebuilding measure.
The city not built
The Burnham Plan remained a vision, not the city’s full blueprint
In 1905, Daniel Burnham and Edward Bennett published a plan for monumental avenues, civic centers and a broad redesign. San Francisco did not implement it as a comprehensive plan.
The obstacles had names: cost, land acquisition, political opposition and property owners. After the fire, many owners pressed to rebuild on existing lots and street alignments. Some Burnham ideas and routes still influenced later development.
The dispute was over who would pay for change and what could be rebuilt quickly. The plan remained incomplete, though some of its ideas carried into the city that followed.
A schematic comparison of two urban intentions; it does not georeference Burnham’s drawing.
What stayed in the record
The disaster changed science and rules; it did not invent earthquake insurance
The California Earthquake Investigation Commission, led by Andrew C. Lawson, published its major report in 1908. Two years later, H.F. Reid offered the elastic-rebound interpretation. The disaster became a landmark in modern earthquake science in the United States; it did not invent seismology.
Lloyd’s was writing earthquake risks before 1906. The disaster reshaped catastrophe claims and insurance disputes and helped drive policy and regulatory changes. California adopted a standard fire policy in 1909.
The Palace of Fine Arts shown at the 1915 exposition was a temporary structure. Today’s building is a later reconstruction and restoration, with a related form but a different construction.
The Lawson Commission publishes its major report.
California adopts a standard fire policy.
H.F. Reid publishes the elastic-rebound interpretation.
PPIE displays a temporary Palace of Fine Arts.
Science and regulation changed in different years; neither came from a single cause.
Sources and limits
How to read the traces
This register keeps scientific studies, contemporary reports, public resolutions, historical estimates and mapped layers distinct. The seven selected photographs have verified identities, dates and rights; unselected alternatives remain research leads.
Core sources V01–V16
- V01LOC Prints & Photographs — Pillsbury panorama
- V02USGS Bulletin 324 — buildings and City Hall
- V03Coleman and underwriters’ report — firefighting and dynamiting
- V04LOC — Golden Gate Park refugee camp
- V05SF Planning — historic context for relief housing
- V06National Park Service — preserved Presidio cottages
- V07LOC — Chinatown images after the fire
- V08LOC — image records for the San Francisco earthquake
- V09National Park Service — law enforcement in 1906
- V10Lawson Commission — California earthquake report
- V11David Rumsey — Burnham plan for San Francisco
- V12NPS — Panama-Pacific International Exposition
- V13NPS — Palace of Fine Arts at the 1915 exposition
- V14U.S. Census — city population, 1900–1920
- V15DataSF — 1906 fire damage area
- V16USGS — the scientific legacy of the 1906 earthquake
Additional sources
- R01USGS — earthquake, rupture and virtual tour
- R02USGS — magnitude analysis
- R03USGS — casualties and damage
- R041906 Fire Chief report
- R05LeVert Coleman — Army report on the fire
- R06National Board of Fire Underwriters — contemporary report
- R07San Francisco Board of Supervisors resolution, 2005
- R08National Archives — relief and discrimination after the earthquake
- R09NPS — camps and temporary accommodations
- R10NPS — treatment of Chinese residents
- R11San Francisco.gov — the city’s recovery
- R12National Archives — rebuilding San Francisco
- R13Cuthbert Heath and Lloyd’s — insurance history
- R14NAIC — history of California’s standard fire policy
- R15OpenStreetMap — copyright and attribution
- R16NPS — the fire and firefighting operations
- R17LOC — city ruins after the disaster
- R18Transcription of Mayor Eugene Schmitz’s handbill
- R19California Geological Survey — San Francisco earthquake
- R20Panama-Pacific Exposition — dates and purpose
For the fire perimeter, see DataSF and the R.J. Waters & Co. lineage; for street orientation, OpenStreetMap with attribution. Modern OSM does not show the 1906 shoreline.