Bucharest · STB timetable, October 2026
Bucharest’s buses, trams and trolleybuses: the timetabled speed of every STB line, hour by hour
At 5 am, the timetable of STB, Bucharest’s public transport company, runs its trips at an average 20.4 km/h. At 5 pm it gives them 13.1 km/h, below the 15 km/h of an unhurried cyclist.
The map shows, hour by hour, the speeds STB’s timetable sets for its buses, trams and trolleybuses on every street. Further down you pick your line, two stops and a time.
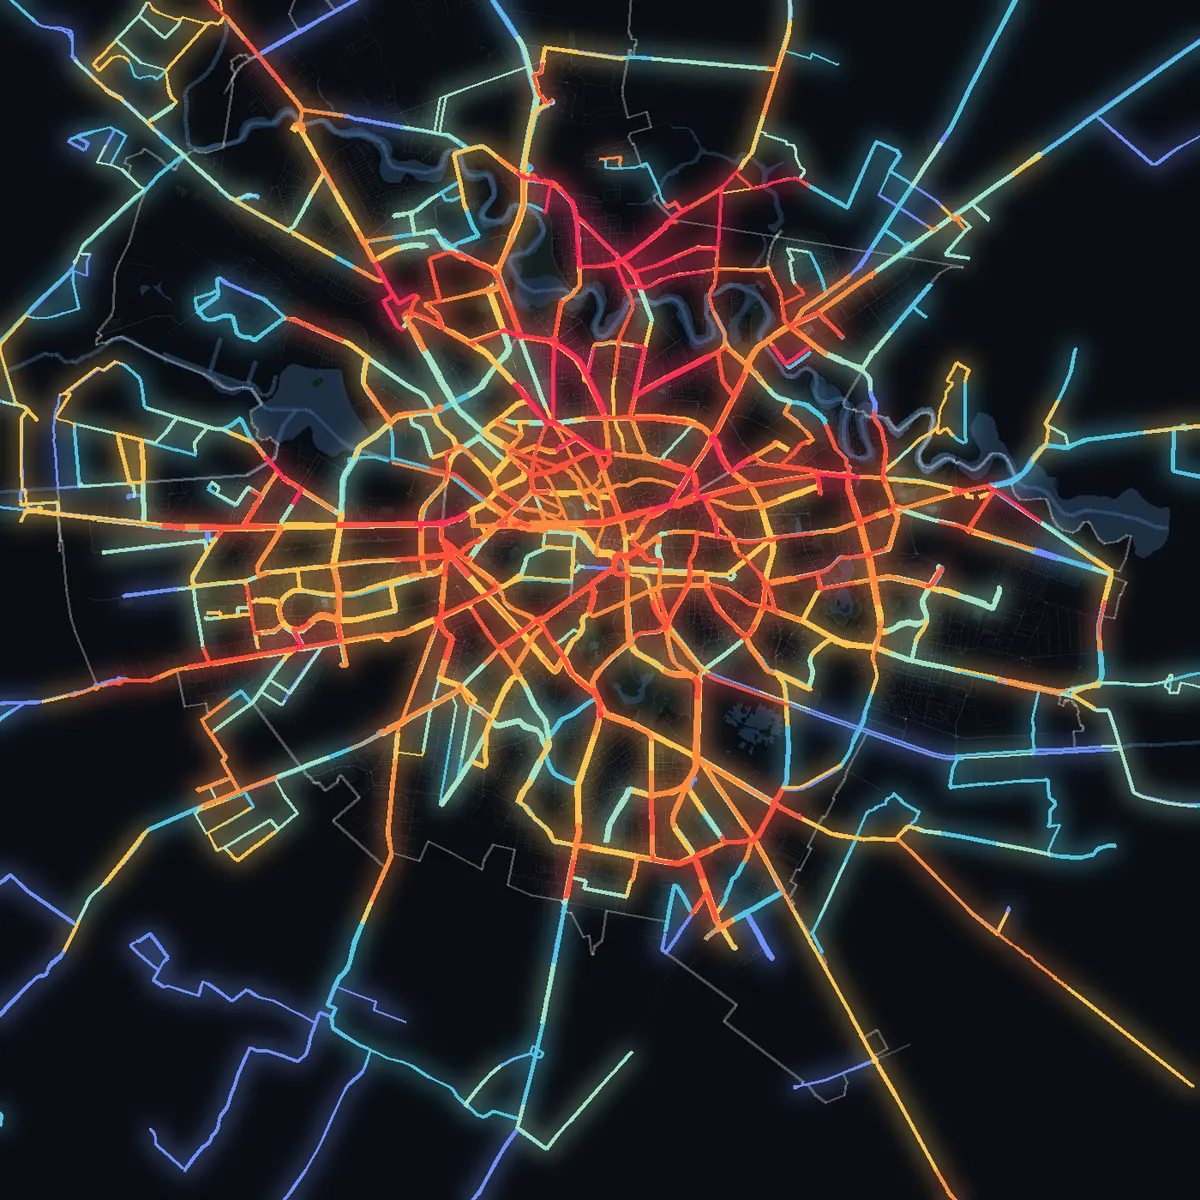
Each stretch is coloured by the weekday timetabled speed of the trips passing there at the chosen hour: every surface line in the timetable, STB’s and the Ilfov operators’, night lines included. Speeds are worked out over pieces of at least a kilometre, so rounding to the minute does not change a street’s colour. The numbers in the corner cover STB daytime trips only. Tap a street to see the lines that use it.
#How long does the bus take between two stops, by the timetable?
Pick the line, the direction, two stops and the hour. The time comes from STB’s weekday timetable: the average of the trips that pass your starting stop in that hour. The bicycle and the walker cover the same distance, along the line’s route.
No such line. Type its number, for example 135 or N101.
#At what time are Bucharest’s buses slowest?
At 5 pm. Trips on STB’s daytime lines that leave then are timetabled at an average 13.1 km/h, the lowest of the day. At 5 am the same lines run at 20.4 km/h. For 70 of the 121 daytime lines, 5 pm is the slowest hour in the timetable.
The evening counts for more than the morning. Between 4 and 7 pm, 120 of 121 lines are timetabled slower than at midday (11 am to 1 pm). Between 7 and 9 am, 105 are. In those evening hours, 84 lines average below 15 km/h.
The map shows the same change: at 5 am, 7% of the length of the routes in service is timetabled below 15 km/h; at 5 pm, 34%.
The lines where the departure hour matters most
Bus 290 is timetabled at 23.3 km/h at 22:00 and at 7.8 km/h at 17:00: the same journey takes 3.0 times as long.
| Line | Fastest hour | Slowest hour | Journey takes |
|---|---|---|---|
| 290 | 23.3 km/h · 22:00 | 7.8 km/h · 17:00 | ×3.0 |
| 222 | 26.0 km/h · 23:00 | 8.9 km/h · 7:00 | ×2.9 |
| 282 | 19.9 km/h · 5:00 | 8.1 km/h · 17:00 | ×2.5 |
| 343 | 21.9 km/h · 22:00 | 9.0 km/h · 17:00 | ×2.4 |
| 331 | 21.4 km/h · 5:00 | 9.2 km/h · 17:00 | ×2.3 |
| 485 | 23.5 km/h · 23:00 | 10.7 km/h · 7:00 | ×2.2 |
| 103 | 34.4 km/h · 23:00 | 16.0 km/h · 17:00 | ×2.1 |
| 335 | 23.8 km/h · 23:00 | 11.1 km/h · 17:00 | ×2.1 |
#Where does STB’s timetable add the most minutes at 5 pm?
Each row is a 1.5–4 km stretch of a single line, between two of its stops. The time is the timetable’s for trips leaving the first stop at 5 pm, against those leaving at 11 am. Rows are ordered by the minutes added in the evening. Tap a row to see the stretch on the map.
#Which STB lines are the slowest and the fastest?
Averaged over all their timetabled trips, the slowest daytime lines are trolleybus 66 (12.5 km/h), bus 282 (12.6) and tram 27 (12.7). The fastest are the express buses to Ilfov, the county around Bucharest: 446 (35.0 km/h) and 444 (33.3).
Over all trips, buses are timetabled at 16.7 km/h, trams at 14.9 and trolleybuses at 14.0. 41 daytime lines have a daily average below 15 km/h. The metro, for comparison: from 25.6 km/h (M5) to 37.9 km/h (M2).
| Line | Ends | Average | At 5 pm | Slowest hour |
|---|---|---|---|---|
| 66trolleybus | Spitalul Fundeni – Vasile Parvan | 12.5 | 9.6 | 9.6 · 17:00 |
| 282bus | Gara Basarab – Soseaua Fundeni | 12.6 | 8.1 | 8.1 · 17:00 |
| 27tram | Faur – Piata Unirii | 12.7 | 11.4 | 11.3 · 19:00 |
| 85trolleybus | Arena Nationala – Gara de Nord | 12.7 | 10.5 | 10.5 · 17:00 |
| 86trolleybus | Cartier Pajura – Baicului | 12.7 | 10.2 | 10.2 · 17:00 |
| 382bus | Baicului – Escalei | 12.7 | 10.7 | 10.5 · 18:00 |
| 605bus | Piata Sf. Vineri – Soseaua Stefan cel Mare | 13.1 | 10.4 | 10.4 · 17:00 |
| 143bus | Arena Nationala – Bucur Obor | 13.2 | 10.1 | 10.1 · 17:00 |
| 23tram | Zetarilor – Faur | 13.3 | 12.3 | 12.2 · 19:00 |
| 69trolleybus | Valea Argesului – Bd. Basarabia | 13.3 | 10.9 | 10.9 · 17:00 |
| 290bus | Complex Baneasa – Soseaua Colentina | 13.3 | 7.8 | 7.8 · 17:00 |
| 655bus | Piata Sf. Vineri – Piata Iancului | 13.3 | 11.3 | 10.8 · 8:00 |
| 61trolleybus | Complex Apusului – Piata Rosetti | 13.4 | 11.4 | 11.4 · 17:00 |
| 96trolleybus | Depoul Alexandria – Gara de Nord | 13.4 | 11.3 | 10.9 · 8:00 |
| 182bus | Dragonul Rosu – Gara de Nord | 13.4 | 10.5 | 10.5 · 17:00 |
| 331Bbus | Petrom City – Piata Romana | 13.4 | 11.0 | 11.0 · 17:00 |
| 97trolleybus | Clabucet – Pasaj Mihai Bravu | 13.5 | 11.1 | 11.1 · 17:00 |
| 467bus · STV | Bucur Obor – Pod Cfr Afumati | 13.6 | 13.3 | 13.2 · 10:00 |
| 487bus | ELI-NP Magurele – Bd. G-ral Paul Teodorescu | 13.7 | 16.1 | 10.4 · 15:00 |
| 101bus | Faur – Bucur Obor | 13.8 | 10.8 | 10.8 · 17:00 |
| 343bus | Fundeni – Cartier Henri Coanda | 13.8 | 9.0 | 9.0 · 17:00 |
| 5tram | Aeroport Baneasa – Pantelimon | 13.9 | 13.0 | 13.0 · 17:00 |
| 7tram | C.F.R. Progresul – Piata Unirii | 14.0 | 12.9 | 12.9 · 17:00 |
| 47tram | Ghencea – Piata Unirii | 14.2 | 13.5 | 13.4 · 16:00 |
| 62trolleybus | Colegiul Tehnic Iuliu Maniu – Gara de Nord | 14.2 | 11.5 | 11.5 · 17:00 |
| 90trolleybus | Arena Nationala – M Petrache Poenaru | 14.2 | 11.3 | 11.3 · 17:00 |
| 135bus | Pasajul Pipera – C.E.T. Sud Vitan | 14.2 | 10.7 | 10.7 · 17:00 |
| 4tram | Sura Mare – Zetarilor | 14.4 | 13.7 | 13.6 · 6:00 |
| 11tram | Zetarilor – Cartier Giulesti | 14.4 | 13.4 | 13.2 · 9:00 |
| 331bus | Cartier Damaroaia – Piata Romana | 14.4 | 9.2 | 9.2 · 17:00 |
| 122bus | Pasaj Domnesti – Piata 21 Decembrie 1989 | 14.5 | 10.9 | 10.9 · 17:00 |
| 222bus | Pasaj Domnesti – Parcul Drumul Taberei | 14.5 | 10.3 | 8.9 · 7:00 |
| 226bus | Depoul Alexandria – Piata Romana | 14.5 | 11.4 | 11.4 · 17:00 |
| 642bus | Piata Presei – Vasile Parvan | 14.5 | 11.2 | 11.1 · 18:00 |
| 21tram | Piata Sf. Gheorghe – Pasaj Colentina | 14.6 | 13.9 | 13.9 · 15:00 |
| 10tram | Romprim – Bd. Banu Manta | 14.7 | 13.7 | 13.7 · 16:00 |
| 74trolleybus | Arcade Berceni – Piata Unirii | 14.8 | 12.1 | 12.1 · 17:00 |
| 79trolleybus | Clabucet – Calea Mosilor | 14.8 | 12.5 | 12.5 · 17:00 |
| 481bus · STCM | Scoala Gimnaziala Nr. 1 – Bragadiru Diamantului | 14.8 | 15.7 | 14.1 · 10:00 |
| 488bus · STV | M Pipera – Elisabeta Rizea | 14.8 | 8.6 | 8.6 · 17:00 |
| 93trolleybus | Cartier Constantin Brancusi – Piata Presei | 14.9 | 12.4 | 12.4 · 17:00 |
| 117bus | Cartier Confort Urban – Piata Sf. Vineri | 14.9 | 12.3 | 12.3 · 17:00 |
| 619bus | Sura Mare – Faur | 14.9 | 12.0 | 12.0 · 17:00 |
| 25tram | C.F.R. Progresul – Depoul Militari | 15.0 | 14.1 | 14.1 · 17:00 |
| 63trolleybus | Master – Pod Izvor | 15.0 | 13.6 | 13.4 · 16:00 |
| 104bus | Complex Pantelimon – Piata Operei | 15.0 | 12.7 | 12.7 · 16:00 |
| 116bus | C.F.R. Progresul – Piata Sf. Vineri | 15.0 | 12.3 | 12.3 · 17:00 |
| 311bus | Faur – Sala Palatului | 15.0 | 11.6 | 11.6 · 17:00 |
| 1tram | Romprim – Bd. Banu Manta | 15.1 | 14.3 | 14.3 · 17:00 |
| 32tram | Depoul Alexandria – Piata Unirii | 15.1 | 13.6 | 13.6 · 17:00 |
| 73trolleybus | Piata de Gros – Piata Sf. Vineri | 15.1 | 12.4 | 12.4 · 17:00 |
| 312bus | Bd. Alexandru Obregia – Piata Unirii 1 | 15.1 | 12.1 | 12.1 · 17:00 |
| 459bus · STV | M Aurel Vlaicu – Tunari (1 Decembrie) | 15.1 | 11.2 | 9.8 · 16:00 |
| 232bus | Arcade Berceni – Valea Ialomitei | 15.2 | 12.8 | 12.8 · 17:00 |
| 335bus | Faur – Complex Baneasa | 15.3 | 11.1 | 11.1 · 17:00 |
| 479bus · STV | Piata Sudului – Complex Rezidential Allegria | 15.3 | 13.1 | 14.8 · 11:00 |
| 139bus | Zetarilor – Piata Leul | 15.4 | 13.0 | 13.0 · 17:00 |
| 102bus | Complex Pantelimon – C.F.R. Progresul | 15.5 | 12.3 | 12.3 · 17:00 |
| 123bus | C.E.T. Sud Vitan – Gara Basarab | 15.5 | 12.8 | 12.8 · 17:00 |
| 253bus | Spitalul Fundeni – Parcul Teilor | 15.5 | 13.0 | 12.6 · 8:00 |
| 368bus | Valea Oltului – Piata Romana | 15.5 | 12.1 | 12.0 · 16:00 |
| 455bus · STV | Bd. Basarabia – Victor Dumitrescu | 15.5 | 14.9 | 14.7 · 10:00 |
| 72trolleybus | Turnu Magurele – Costache Stamate | 15.6 | 13.2 | 13.2 · 17:00 |
| 330bus | Parcul Teilor – Dristorului | 15.6 | 12.3 | 12.3 · 17:00 |
| 381bus | Piata Resita – Clabucet | 15.6 | 11.9 | 11.9 · 17:00 |
| 163bus | Giulesti Sarbi – Piata Operei | 15.7 | 14.5 | 14.1 · 8:00 |
| 452bus · STV | Pantelimon – Islaz | 15.7 | 15.7 | 15.2 · 7:00 |
| 76trolleybus | Piata Resita – Costache Stamate | 15.8 | 13.5 | 13.1 · 18:00 |
| 137bus | Carrefour Militari – Piata 21 Decembrie 1989 | 15.8 | 12.6 | 12.6 · 17:00 |
| 105bus | Valea Oltului – Soseaua Nicolae Titulescu | 15.9 | 13.4 | 13.4 · 16:00 |
| 138bus | Complex Militari – Dedeman Ghencea | 15.9 | 13.2 | 13.2 · 17:00 |
| 112bus | Pasajul Pipera – Complex Colosseum | 16.0 | 12.2 | 12.2 · 17:00 |
| 205bus | M Straulesti – Piata Unirii 2 | 16.0 | 11.8 | 11.8 · 17:00 |
| 216bus | Zetarilor – Piata Sudului | 16.0 | 13.5 | 13.5 · 17:00 |
| 228bus | Depoul Alexandria – Cartier Confort Urban | 16.0 | 14.0 | 13.3 · 7:00 |
| 627bus | M Nicolae Teclu – Dristorului | 16.0 | 13.1 | 13.1 · 17:00 |
| 450bus · STV | Complex Baneasa – M Pipera | 16.0 | 12.8 | 11.0 · 15:00 |
| 323bus | Zetarilor – Piata Unirii 1 | 16.1 | 13.4 | 13.4 · 17:00 |
| 485bus | Bragadiru Diamantului – Parcul Drumul Taberei | 16.1 | 13.1 | 10.7 · 7:00 |
| 178bus | Complex Apusului – Sala Palatului | 16.2 | 13.2 | 13.2 · 17:00 |
| 439bus · STV | Piata Sudului – Danubiana | 16.2 | 14.0 | 14.0 · 7:00 |
| 168bus | Valea Ialomitei – Piata Romana | 16.3 | 13.6 | 13.6 · 17:00 |
| 196bus | Aeroport Baneasa – Autogara Filaret | 16.3 | 12.4 | 12.4 · 17:00 |
| 95trolleybus | M Straulesti – Cartier Pajura | 16.4 | 13.6 | 13.6 · 17:00 |
| 141bus | Zetarilor – Vulcan Berceni | 16.4 | 13.9 | 13.8 · 16:00 |
| 482bus · STCM | Scoala Gimnaziala Nr. 1 – Bragadiru Diamantului | 16.4 | 15.7 | 15.5 · 7:00 |
| 470bus · STCM | Complex Colosseum – Tudor Arghezi | 16.6 | 16.2 | 16.1 · 15:00 |
| 243bus | Emil Racovita – Bd. Lacul Tei | 16.7 | 12.9 | 12.9 · 17:00 |
| 483bus | Chiajna-Stelelor – M Lujerului | 16.7 | 13.7 | 13.2 · 7:00 |
| 416bus · STV | M Pipera – Strada Garii Pantelimon | 16.8 | 13.7 | 12.0 · 16:00 |
| 322bus | Bd. Preciziei – Parcul Drumul Taberei | 16.9 | 12.2 | 12.2 · 17:00 |
| 484bus | Bragadiru Diamantului – Ghencea | 16.9 | 13.5 | 13.0 · 16:00 |
| 640bus | Isovolta – Piata Sf. Vineri | 17.0 | 13.5 | 13.5 · 17:00 |
| 106bus | C.E.T. Vest Militari – Cartier Rosu | 17.1 | 14.5 | 14.5 · 17:00 |
| 458bus · STV | Pantelimon – Branesti | 17.2 | 17.2 | 16.6 · 6:00 |
| 53tram | Mezes – Depoul Bucurestii Noi | 17.3 | 16.7 | 15.6 · 8:00 |
| 246bus | M Nicolae Teclu – Pantelimon | 17.3 | 11.9 | 11.9 · 17:00 |
| 478bus | Bd. Preciziei – Chiajna-Militari | 17.3 | 13.5 | 13.5 · 17:00 |
| 41tram | Piata Presei – Ghencea | 17.4 | 16.8 | 16.6 · 14:00 |
| 162bus | Giulesti Sarbi – Gara Basarab | 17.4 | 16.1 | 15.7 · 8:00 |
| 227bus | Depoul Alexandria – Cartier Confort Urban | 17.4 | 15.7 | 15.2 · 16:00 |
| 436bus · STCM | M Straulesti – Oras Buftea | 17.4 | 14.3 | 11.5 · 6:00 |
| 301bus | Pasaj CFR Tunari – Piata Romana | 17.6 | 12.7 | 12.7 · 17:00 |
| 408bus · STV | M Nicolae Teclu – Manolache | 17.6 | 17.4 | 17.1 · 7:00 |
| 476bus · STCM | M Straulesti – Pasaj Cfr Chitila | 17.6 | 17.0 | 16.6 · 14:00 |
| 440bus · STV | Piata Sudului – Leordeni | 17.7 | 15.7 | 15.7 · 17:00 |
| 301Bbus | Tunari – Piata Romana | 17.9 | 13.0 | 13.0 · 17:00 |
| 475bus · STV | Piata Sudului – Mega Parc | 17.9 | 14.7 | 14.7 · 17:00 |
| 220bus | Vulcan Berceni – Piata Rahova | 18.1 | 15.6 | 15.4 · 16:00 |
| 185bus | Ghencea – Cimitirul Ghencea 3 | 18.2 | 17.6 | 14.4 · 7:00 |
| 385bus | Valea Oltului – Piata Sf. Vineri | 18.2 | 16.4 | 16.4 · 13:00 |
| 473bus · STV | Complex Baneasa – Strada Garii Pantelimon | 18.4 | 18.2 | 14.6 · 8:00 |
| 457bus · STV | Pantelimon – Piteasca | 18.7 | 18.7 | 18.2 · 7:00 |
| 221bus | Dedeman Ghencea – C.E.T. Vest Militari | 18.8 | 14.6 | 14.6 · 17:00 |
| 103bus | Pantelimon – Isovolta | 18.9 | 16.0 | 16.0 · 17:00 |
| 413bus · STV | Bucur Obor – Piteasca | 18.9 | 18.6 | 18.3 · 8:00 |
| 425Bbus | Clinceni – Ghencea | 19.0 | 15.2 | 15.2 · 17:00 |
| 435bus · STCM | Complex Baneasa – Pasaj Cfr Chitila | 19.0 | 17.9 | 17.3 · 6:00 |
| 454bus · STV | Pantelimon – Ferma Pantelimon | 19.0 | 16.7 | 16.2 · 7:00 |
| 434bus | Chiajna-Stelelor – M Lujerului | 19.3 | 16.0 | 15.4 · 16:00 |
| 241bus | Biserica Sfintii Brancoveni – Cartier Aparatorii Patriei | 19.4 | 16.2 | 16.2 · 17:00 |
| 438bus · STV | Piata Sudului – Vidra | 19.4 | 16.5 | 16.4 · 16:00 |
| 429bus · STCM | Valea Cascadelor – Pasaj Cfr Chitila | 19.6 | 18.5 | 18.1 · 12:00 |
| 468bus · STV | Bucur Obor – Gagu | 19.6 | 18.9 | 18.6 · 13:00 |
| 409Bbus · STV | Bucur Obor – Crizantemelor | 19.7 | 19.3 | 19.0 · 14:00 |
| 422bus | Darvari – Ghencea | 19.8 | 15.7 | 13.4 · 7:00 |
| 428bus · STV | C.f.r. Progresul – Ghencea | 20.2 | 17.4 | 17.1 · 7:00 |
| 472bus · STV | M Nicolae Teclu – Caldararu | 20.2 | 20.2 | 19.9 · 7:00 |
| 423bus | Teghes – Ghencea | 20.4 | 16.4 | 14.2 · 7:00 |
| 427bus · STV | Ghencea – Darasti | 20.5 | 18.0 | 17.2 · 16:00 |
| 484Bbus | Bragadiru Diamantului – Depoul Alexandria | 20.7 | 16.5 | 16.3 · 7:00 |
| 405bus · STV | M Nicolae Teclu – Spital Balaceanca | 20.7 | 20.6 | 20.4 · 11:00 |
| 407bus · STV | Pantelimon – Sat Posta | 20.8 | 20.8 | 20.3 · 6:00 |
| 449bus · STV | M Aurel Vlaicu – Dumbraveni Spital Sri | 20.9 | 18.6 | 14.7 · 7:00 |
| 417bus · STV | Bucur Obor – Piteasca | 21.1 | 20.4 | 20.4 · 9:00 |
| 451bus · STV | Pantelimon – Tanganu | 21.1 | 21.0 | 20.4 · 6:00 |
| 462bus · Regio Serv | Studiourile Buftea – Primaria Chitila | 21.1 | 21.1 | 20.6 · 7:00 |
| 466bus · Regio Serv | Studiourile Buftea – Primaria Chitila | 21.5 | 21.0 | 21.2 · 6:00 |
| 425bus | Ordoreanu – Ghencea | 21.6 | – | 15.0 · 7:00 |
| 125bus | Vulcan Berceni – Peco Silflor Move | 21.7 | 17.7 | 16.6 · 18:00 |
| 426bus · STV | Ghencea – Pruni | 21.8 | 22.0 | 19.7 · 7:00 |
| 412bus · STV | Bucur Obor – Maineasca | 22.0 | 21.4 | 21.3 · 7:00 |
| 411bus · STV | Bucur Obor – Gagu | 22.2 | 21.6 | 21.5 · 7:00 |
| 464bus · STV | Depoul Alexandria – Varteju | 22.2 | 21.6 | 18.8 · 15:00 |
| 480bus · STV | M Nicolae Teclu – Pasarela M Berceni | 22.3 | 20.6 | 18.7 · 15:00 |
| 203bus | Cartier Greenfield – Piata Victoriei | 22.4 | 16.6 | 16.6 · 17:00 |
| 419bus · STV | C.f.r. Progresul – Bumbacaria Jilava | 23.3 | 19.9 | 19.9 · 17:00 |
| 403bus · STV | Piata Presei – Vadu Anei | 23.6 | 23.9 | 22.9 · 6:00 |
| 468Bbus · STV | Bucur Obor – Sitaru | 23.6 | 23.0 | 22.3 · 16:00 |
| 409bus · STV | Bucur Obor – Merii Petchii | 23.9 | 23.9 | 23.1 · 14:00 |
| 424bus | Clinceni – Depoul Alexandria | 24.0 | 20.1 | 20.1 · 17:00 |
| 100bus | Piata Unirii 2 – Aeroport Henri Coanda | 24.1 | 16.7 | 16.7 · 17:00 |
| 421bus | Cornetu – Depoul Alexandria | 24.1 | 20.1 | 20.1 · 17:00 |
| 304bus | M Straulesti – Piata Presei | 24.5 | 21.3 | 19.5 · 8:00 |
| 223bus | Univ. Crestina Dimitrie Cantemir – Pasarela | 25.1 | 22.3 | 22.3 · 17:00 |
| 442bus | Therme Bucuresti – Piata Presei | 25.7 | 22.2 | 20.9 · 18:00 |
| 432bus | Zurbaua – Valea Cascadelor | 26.1 | 21.7 | 20.4 · 8:00 |
| 433bus | Dragomiresti Deal – Valea Cascadelor | 26.1 | 22.0 | 19.2 · 7:00 |
| 465bus · STV | C.f.r. Progresul – 1 Decembrie | 26.1 | 23.9 | 23.9 · 7:00 |
| 418bus · STV | C.f.r. Progresul – Copaceni | 26.2 | 24.9 | 24.7 · 7:00 |
| 447Bbus · STV | Piata Presei – Micsunestii Mari | 27.8 | 27.9 | 27.5 · 6:00 |
| 447bus · STV | Piata Presei – Gruiu Lipia Urcare | 27.9 | 27.9 | 27.5 · 6:00 |
| 441Bbus | Tamasi – Piata Presei | 28.1 | 23.2 | 22.5 · 8:00 |
| 441bus | Ostratu – Piata Presei | 28.8 | 24.1 | 23.1 · 7:00 |
| 448bus | Moara Vlasiei – Piata Presei | 29.5 | 26.1 | 25.9 · 8:00 |
| 431bus | Darvari – Valea Cascadelor | 30.5 | 25.3 | 21.9 · 7:00 |
| 443Bbus | Peris Sat – Piata Presei | 32.1 | 28.1 | 26.4 · 8:00 |
| 443bus | Peris – Piata Presei | 32.4 | 29.0 | 28.6 · 8:00 |
| 477bus | Sitaru – Piata Presei | 32.4 | 29.0 | 28.8 · 8:00 |
| 444bus | Piscu – Piata Presei | 33.3 | 29.5 | 28.9 · 8:00 |
| 446bus | Gruiu-Lipia – Piata Presei | 35.0 | 32.6 | 30.3 · 7:00 |
| N103bus | Piata Unirii 2 – Institutul Oncologic | 19.3 | – | – |
| N102bus | Piata Unirii 2 – Pantelimon | 20.9 | – | – |
| N120bus | Piata Unirii 2 – Soseaua Fundeni | 21.7 | – | – |
| N108bus | Piata Unirii 2 – Pasaj Colentina | 22.1 | – | – |
| N116bus | Piata Unirii 2 – Valea Ialomitei | 22.3 | – | – |
| N121bus | Piata Unirii 2 – Valea Argesului | 22.3 | – | – |
| N114bus | Piata Unirii 2 – Autobaza Alexandria | 23.1 | – | – |
| N106bus | Piata Unirii 2 – Turnu Magurele | 23.3 | – | – |
| N119bus | Piata Unirii 2 – Complex Baneasa | 23.6 | – | – |
| N118bus | Piata Unirii 2 – Zetarilor | 23.7 | – | – |
| N107bus | Piata Unirii 4 – C.F.R. Progresul | 23.9 | – | – |
| N113bus | Piata Unirii 2 – Mezes | 23.9 | – | – |
| N1bus | Romprim – Bd. Banu Manta | 24.0 | – | 21.0 · 22:00 |
| N115bus | Piata Unirii 2 – Colegiul Tehnic Iuliu Maniu | 24.0 | – | – |
| N117bus | Piata Unirii 2 – M Straulesti | 24.0 | – | – |
| N101bus | Piata Unirii 2 – Valea Oltului | 24.1 | – | – |
| N112bus | Piata Unirii 4 – Piata Resita | 24.1 | – | – |
| N122bus | Piata Unirii 4 – Faur | 24.2 | – | – |
| N10bus | Romprim – Bd. Banu Manta | 24.4 | – | 20.3 · 22:00 |
| N104bus | Piata Unirii 4 – Parcul Teilor | 24.4 | – | – |
| N105bus | Piata Unirii 4 – Vulcan Berceni | 25.4 | – | – |
| N109bus | Piata Unirii 2 – Isovolta | 25.7 | – | – |
| N110bus | Piata Unirii 2 – Cartier Giulesti | 25.8 | – | – |
| N111bus | Piata Unirii 4 – M Nicolae Teclu | 26.4 | – | – |
Average for the day, at 5 pm and at the slowest hour between 6 am and 10 pm, over the trips of the line’s main variant in both directions. Tap a line to try it above.
#Do the buses really go as fast as the timetable says?
This page uses only the timetable, so its speeds are the ones STB has planned. TPBI also publishes live vehicle positions. The speed measured from those positions over one whole weekday (26 October 2026) is on a separate page.
How fast Bucharest's buses, trams and trolleybuses really move →
Two public sources give lower speeds. A Bucharest City Hall feasibility study, quoted by HotNews on 6 June 2026, puts line 222 at 6.46 km/h on average on weekdays. The October timetable gives it 14.5 km/h (8.9 at 7 am). The same study counts 12 of 66 urban bus lines above 15 km/h. In the timetable, 43 of the 59 bus lines numbered 100 to 399 are above 15 km/h. I could not find the study published, and the article does not say how or when the speeds were measured, or which 66 lines count as urban, so the two sets of lines may differ.
The gap does not always run the same way. Trolleybus 96 has 9.62 km/h in the study and 13.4 in the timetable, but trolleybus 97 has 17.52 km/h in the study and only 13.5 in the timetable.
STB reports its own average operating speed. In its 2020–2030 strategy, the 2019 values are 12.9 km/h for buses, 12.6 for trams and 11.1 for trolleybuses. The 2026 timetable, over all trips, gives 16.7, 14.9 and 14.0. The years differ (2019 against 2026), and the strategy does not say whether its average includes time spent at the terminus, so part of the gap may come from that.
#How the speeds were worked out
The data is the timetable TPBI, the Bucharest–Ilfov transport authority, publishes in GTFS format (version 6.41, valid 7 October 2026 to 5 January 2027), with every trip scheduled Monday to Friday: 121 daytime and 24 night lines run by STB, plus 50 lines of the Ilfov operators (STV, STCM, Regio Serv).
Distance is measured along each trip’s drawn route, stop to stop. Time is the difference between the timetable’s clock times, which are given to the minute. A line has several variants (short workings, depot runs); a line’s speed uses its main variant in each direction, the most frequent pair of ends, and divides all its kilometres by all its trips’ time. A trip’s hour is the hour it leaves the first stop.
On the map, each stretch’s speed is worked out over pieces of at least a kilometre of every trip, then averaged over all the lines that use it, so rounding to the minute does not visibly change a street’s colour.
The average wait at the stop is an estimate: half the interval between trips of the chosen variant in that hour, assuming they are evenly spaced. It is what you wait if you turn up at a random time. When two stops are so close that the timetable gives them the same minute or a single one, no speed is worked out. The bicycle (15 km/h) and walking (5 km/h) are reference speeds over the same distance; getting to the stop is not counted for anyone.
Stops more than 150 metres from the trip’s drawn route are left out (tram 1’s route towards Romprim ends before its last stop). For the metro the timetable gives only the times at the ends; 112 trips that took more than twice the usual time were removed as file errors. The metro is shown only for comparison.
Stop names are written as in STB’s timetable, without Romanian diacritics. TPBI’s file states no licence; the page publishes only the numbers worked out per line.
#Sources
- TPBI (the Bucharest–Ilfov public transport authority): timetable in GTFS format, version 6.41, valid 7 October 2026 – 5 January 2027
- HotNews, 6 June 2026, in Romanian: “The Bucharest bus line that moves at walking pace” (Bucharest City Hall feasibility study)
- STB SA, Strategy 2020–2030 (in Romanian), figure 49, p. 47: average operating speed, 2000–2019
- Base map: © OpenStreetMap contributors (ODbL)