mariuscomper.uk Română

INS data · births in Romania, day by day, 1995–2025

How rare is your birthday?

Pick your birthday to see where it ranks among the 365 dates of the year, by how often babies are born on it. The same data show how the birth calendar has changed: fewer and fewer babies are born at weekends, on public holidays, on the 13th of any month and on 29 February.

The ranking comes from 6,532,338 births registered in Romania between 1995 and 2025, counted by INS, the national statistics office. Add the year to see how many babies were born on your exact birthday.

an average dayJanFebMarAprMayJunJulAugSepOctNovDec

Example: first place in the ranking

18 September

1of 365 dates, from most common to rarest

15% more babies are born than on an average day of the same year.

  • On average, 664 babies a year.
  • 20,595 births on 18 September across the 31 years.
  • Tied with 16 September: the gap between them is under a tenth of a percentage point.
  • The largest surplus over an average day of any date in the year.

18 September, year by year

1995, Monday: 693 births (+7% against an average day)1996, Wednesday: 649 births (+3% against an average day)1997, Thursday: 732 births (+13% against an average day)1998, Friday: 722 births (+11% against an average day)1999, Saturday: 704 births (+10% against an average day)2000, Monday: 712 births (+11% against an average day)2001, Tuesday: 715 births (+18% against an average day)2002, Wednesday: 673 births (+17% against an average day)2003, Thursday: 622 births (+7% against an average day)2004, Saturday: 576 births (−3% against an average day)2005, Sunday: 591 births (−2% against an average day)2006, Monday: 695 births (+16% against an average day)2007, Tuesday: 735 births (+25% against an average day)2008, Thursday: 791 births (+30% against an average day)2009, Friday: 744 births (+22% against an average day)2010, Saturday: 537 births (−8% against an average day)2011, Sunday: 511 births (−5% against an average day)2012, Tuesday: 688 births (+25% against an average day)2013, Wednesday: 844 births (+43% against an average day)2014, Thursday: 725 births (+31% against an average day)2015, Friday: 733 births (+30% against an average day)2016, Sunday: 525 births (−8% against an average day)2017, Monday: 771 births (+31% against an average day)2018, Tuesday: 789 births (+34% against an average day)2019, Wednesday: 753 births (+28% against an average day)2020, Friday: 776 births (+34% against an average day)2021, Saturday: 461 births (−17% against an average day)2022, Sunday: 443 births (−14% against an average day)2023, Monday: 604 births (+31% against an average day)2024, Wednesday: 563 births (+31% against an average day)2025, Thursday: 518 births (+30% against an average day)1995200520152025
  • weekday
  • Saturday or Sunday

Each bar is a year. It rises above the dotted line when more babies were born on that date than on an average day of that year.

31 years, day by day

Weekends turned into blue stripes#

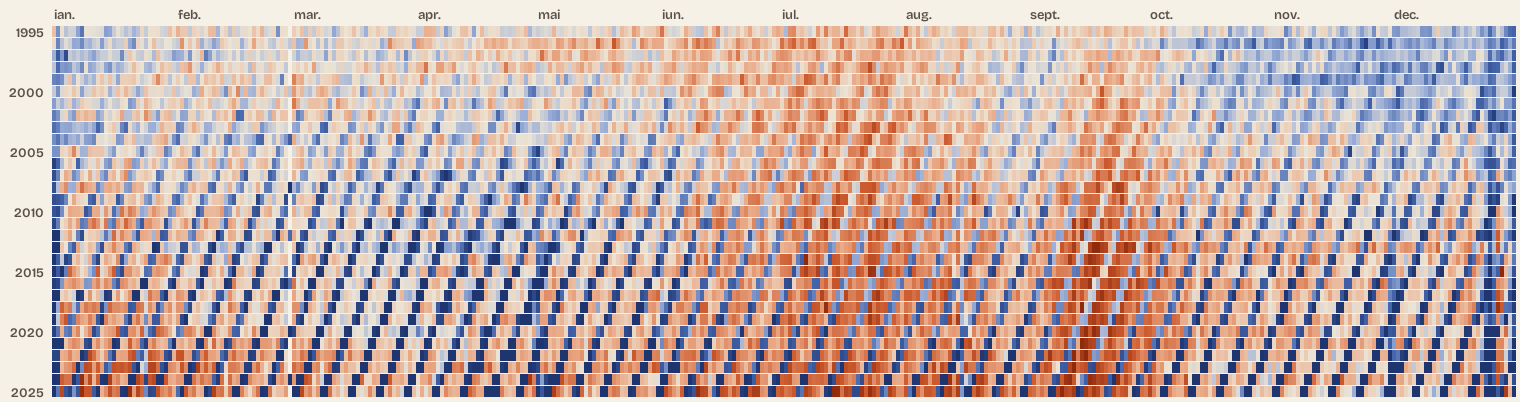
Each row below is a year, from 1995 at the top to 2025 at the bottom. Each square is a day. The colour compares the day with that year's average: orange means more births, blue fewer.

In the mid-1990s the map is almost even. Only summer shows, a little more orange, and the end of December, in blue. Towards 2025 evenly spaced diagonal stripes appear: Saturdays and Sundays. They slant because each year shifts the weekdays by one place, and a leap year by two.

Comparing with each year's average matters because births fell, from 236,640 in 1995 to 145,725 in 2025. Without it, recent years would simply look paler.

A map of births in Romania: 31 rows, one per year from 1995 to 2025, and 366 columns, one per day. Towards 2025 regular diagonal blue stripes appear: Saturdays and Sundays, with fewer births.

fewer birthsmore· an average day = background colour
Each square compares a day with the daily average of its year. On narrow screens the map turns: each column is a year and the days run downwards. Source: INS.

The week

Monday is now the busiest day for births#

In 1995 the day of the week mattered little: a Sunday had 4% fewer births than an average day. In 2025 a Sunday had 33% fewer, and a Monday 18% more. The 2025 figures are still semi-final; in 2024, the latest final year, the gaps were almost the same: Sunday −32%, Monday +17%.

The day spontaneous labour begins is not scheduled. A planned caesarean or an induction, by contrast, can within limits be arranged for a particular day, usually a weekday, when the maternity ward has its full team. The INS table does not record how each baby was born, so it cannot show directly how much of the gap comes from caesareans or inductions. But the pattern is consistent with a growing share of births whose timing can be scheduled: the days that lose births are exactly the days an intervention can be moved away from.

Caesarean sections became much more common over the same period. Romania reported 23,883 of them to Eurostat in 1995 and 82,299 in 2023, while births fell by almost 30%. For comparisons between countries, Eurostat measures the procedure against population: in 2023 Romania recorded 431.8 caesareans per 100,000 inhabitants, against an EU average of 246.1; only Cyprus was higher, at 664.2 (Eurostat, surgical operations).

The same scheduling shows on the clock: Ora nașterii (in Romanian) shows births bunching up in the morning, as the working day starts.

470babies on an average Monday in 2025
268on a Sunday
−30%−20%−10%0+10%+20%1995200520152025Monday +18%Saturday −33%Sunday −33%Tue–Fri
Births on each weekday against an average day of the same year. The dotted line is the average day. Source: INS.

Public holidays

After becoming public holidays, all six dates recorded fewer births#

From 2009 to 2024, six fixed dates became public holidays by law: 15 August, 30 November, 24 January, 1 June, and 6 and 7 January. Before, about as many babies were born on them as on the days around them. As days off they lose on average between 21% and 34% of their births. For 15 August, 30 November, 24 January and 1 June, every weekday year after the law sits below every weekday year before it.

Each dot compares births on a date with the average for the same weekday in the three weeks before and after, leaving out holidays and Christmas and New Year's Eve. Only years in which the date fell Monday to Friday are shown; weekends are emptier anyway. An open circle means the date coincided with Orthodox Easter or Pentecost, which are days off in any case.

15 August

Dormition of the Virgin · a day off since 2009

−40%−20%0+20%1995201020252009
Before: +1%. As a day off: −23%.

30 November

St Andrew · a day off since 2012

−40%−20%0+20%1995201020252012
Before: −1%. As a day off: −25%.

24 January

Union of the Principalities · a day off since 2017

−40%−20%0+20%1995201020252017
Before: +1%. As a day off: −22%.

1 June

Children's Day · a day off since 2017

−40%−20%0+20%1995201020252017
Before: +1%. As a day off: −21%.

6 January

Epiphany · a day off since 2024

−40%−20%0+20%1995201020252024
Before: +2%. As a day off: −30%. Only one year so far.

7 January

St John · a day off since 2024

−40%−20%0+20%1995201020252024
Before: 0%. As a day off: −34%. Only one year so far.

The old holidays emptied too

The holidays that were already days off in the 1990s needed no new law. Orthodox Easter Monday had 10% fewer births than the surrounding days in 1995–2004, and 34% fewer in 2015–2025. Christmas Day went from −13% to −39%, and 1 January from −8% to −39%. That is why the bottom of the ranking belongs to 25 December, 31 December, 1 January and 26 December.

1 January

−40%−20%0+20%199520102025
1995–2004: −8%. 2015–2025: −39%.

25 December

−40%−20%0+20%199520102025
1995–2004: −13%. 2015–2025: −39%.

1 May

−40%−20%0+20%199520102025
1995–2004: −4%. 2015–2025: −29%.

Orthodox Easter Monday

−40%−20%0+20%199520102025
1995–2004: −10%. 2015–2025: −34%.

Rare dates

Births on the 13th and 29 February have become much rarer#

No law makes the 13th a day off. Yet between 2015 and 2025 a 13th that fell on a weekday had on average 7% fewer births than the same weekday around it. In 1995–2004 the gap was 1%.

Tuesday the 13th, the unlucky day in Romanian tradition, does not stand out: every 13th from Monday to Friday loses between 5% and 9%. 13 April and 13 December are among the bottom 12 dates of the ranking.

29 February went the same way. In 1996 it had 4% fewer births than the surrounding days; in 2024, 39% fewer. In each of the eight leap years, 1 March had more births than the days around it, by 6% to 18%. Both patterns are consistent with some birth dates being chosen, through a scheduled caesarean or induction. The INS data do not show who chose the date, or why.

−15%−10%−5%0+5%19952005201520251995–2004: −1%2005–2014: −6%2015–2025: −7%
Each year's weekday 13ths against the same weekday in the three weeks before and after. The horizontal lines are ten-year averages. Source: INS.
−40%−20%0+20%1996200020042008201220162020202428 February29 February1 March
The eight leap years from 1996 to 2024, each date against the same weekday around it. Source: INS.

Fewer births

In 2025, 38% fewer babies were born than in 1995#

236,640 births in 1995, 145,725 in 2025. The fall does not change the ranking, because each day is compared with the average of its own year.

Two INS notes matter here. Since 2012 the count covers babies whose mothers had their domicile or usual residence in Romania and whose birth was registered in the country; before, the criterion was the mother's domicile. And the 2025 figures are semi-final: births registered late will still be added.

236,640199520052015145,72520252012: new definition
Live births in each year, 1995–2025. Source: INS.

The ranking

365 dates ranked, plus 29 February separately#

The percentage compares each date with an average day of the same year, averaged over the 31 years; first place has the largest surplus. 29 February is shown without a rank, because it occurs in only eight of the 31 years. Select a date to see it year by year.

The 365 comparable dates ranked by births, 1995–2025, plus 29 February unranked
RankDateAgainst an average dayBirths a year, on averageTotal 1995–2025
118 September+15.5%66420,595
216 September+15.5%66420,598
319 September+15.0%66120,476
423 July+14.9%66320,551
517 September+14.7%66020,471
615 July+14.6%66020,453
725 July+14.5%65920,418
820 September+13.6%65620,335
915 September+13.6%65320,245
1024 July+13.5%65420,272
1112 September+13.2%64820,092
1214 September+13.2%65420,286
1323 September+13.0%65120,177
1424 September+12.9%65220,201
1521 September+12.7%65220,207
1625 September+12.6%64820,075
1717 July+12.5%64820,078
1822 September+12.5%64820,100
1910 July+12.1%64620,037
201 August+11.2%63919,806
2114 July+11.2%63919,819
2218 July+10.9%63719,758
237 July+10.9%63919,814
2412 July+10.9%64019,848
2527 July+10.6%64119,867
2626 July+10.3%63819,771
279 July+10.2%63719,742
2826 September+10.1%63319,618
2911 July+10.0%63219,605
3022 July+10.0%63419,655
318 July+10.0%63419,643
3221 July+9.9%63519,671
3316 July+9.8%63419,661
343 July+9.8%63319,618
3511 September+9.8%63019,523
3629 July+9.5%63219,579
3712 August+9.4%62819,480
381 July+9.3%63019,530
3919 July+9.3%63119,553
4028 July+9.2%63019,545
4120 July+9.2%63319,611
428 August+9.0%62619,394
435 August+9.0%62719,450
441 October+8.9%62719,436
454 July+8.8%62619,394
4628 September+8.5%62919,494
4710 September+8.3%62319,310
489 September+8.2%62019,235
4927 September+8.0%62519,380
505 July+7.8%62319,306
512 August+7.5%62119,236
5220 June+7.5%61819,152
5329 September+7.4%61919,192
5414 August+7.2%61719,127
5518 August+7.1%61819,149
564 August+7.1%61919,178
5730 September+7.1%61719,120
586 July+7.1%62119,237
5910 June+7.0%61519,068
606 August+6.9%61619,105
6112 June+6.9%61519,068
6225 June+6.8%61619,091
6311 August+6.7%61519,068
643 August+6.7%61919,184
6530 July+6.5%61619,089
6626 June+6.5%61419,026
6719 August+6.4%61118,952
6827 June+6.3%61118,956
6931 July+6.2%61319,004
702 July+6.2%61318,992
7110 August+6.0%61319,016
727 August+6.0%61018,917
733 October+5.9%60918,889
7424 June+5.8%61118,928
758 September+5.6%60818,861
7619 June+5.5%60818,833
7716 June+5.4%60818,846
782 October+5.4%60618,800
799 August+5.2%60718,818
8020 August+5.0%60518,758
8110 October+4.9%60218,667
8213 September+4.8%60618,774
8317 August+4.8%60618,796
8418 June+4.7%60518,756
8521 June+4.7%60518,769
8623 June+4.7%60418,733
8714 June+4.6%60418,736
8830 June+4.4%60318,704
8911 June+4.4%60318,685
9017 June+4.4%60118,626
9121 August+4.2%60018,598
925 September+4.2%59818,530
9322 August+4.0%59818,539
944 October+3.9%60018,596
9516 August+3.7%59918,584
9629 June+3.7%60218,648
9710 January+3.6%59318,370
987 June+3.5%59918,577
991 March+3.5%59818,545
10022 June+3.5%60118,624
10113 July+3.3%59918,582
10214 February+3.2%59218,360
10328 June+3.1%59618,472
10420 January+3.0%59118,319
10515 June+2.8%59718,499
1067 October+2.7%59118,321
1075 October+2.5%59418,427
1086 September+2.3%59018,282
10927 January+2.3%58918,258
11025 January+2.3%58818,240
1117 September+2.1%59018,299
1126 June+2.0%58618,177
1131 September+1.9%58718,182
11417 January+1.9%58418,098
11510 February+1.9%58518,143
11615 January+1.8%58518,126
11726 August+1.8%58718,184
11816 January+1.8%58518,132
1196 October+1.8%58718,205
12023 August+1.7%58718,210
1212 September+1.7%58518,128
12219 January+1.7%58618,179
1234 September+1.7%58418,114
1249 October+1.6%58618,154
12525 August+1.5%58518,126
1268 October+1.4%58618,170
1279 June+1.3%58718,192
12812 January+0.9%58118,013
12915 February+0.9%58218,053
1305 May+0.9%58218,042
13128 January+0.9%58318,075
13226 January+0.9%58017,976
13313 August+0.8%58218,039
13430 May+0.7%58017,972
1355 January+0.7%58017,974
13630 January+0.7%57917,953
1378 June+0.7%58418,099
13810 May+0.6%58017,992
13928 August+0.5%57817,932
14027 December+0.5%57617,866
14121 May+0.4%58017,977
1429 May+0.4%57717,895
14322 January+0.4%57717,901
1443 September+0.4%57917,941
14521 January+0.4%57917,964
1463 March+0.2%57717,896
14712 February+0.2%57717,902
1482 February+0.2%57817,910
14918 January+0.1%57717,884
15015 May+0.1%57717,895
15114 October0.0%57617,854
15223 January0.0%57517,825
15324 August0.0%57817,923
15411 January0.0%57617,846
15520 May−0.1%57617,869
1563 June−0.1%57517,818
1573 February−0.2%57417,792
1581 February−0.3%57417,808
15929 August−0.3%57317,776
16016 May−0.4%57417,781
16127 May−0.4%57517,815
1627 February−0.5%57117,707
1639 January−0.7%57017,672
1644 January−0.7%57217,717
16514 January−0.7%57317,758
16611 November−0.7%57117,710
16720 December−0.7%57317,750
16815 October−0.8%57217,737
16929 January−0.8%57117,714
17012 May−0.8%57317,754
17115 April−1.1%57017,662
17211 October−1.1%57217,731
17313 June−1.1%57117,699
1747 May−1.1%57017,685
17521 February−1.2%56717,589
1768 February−1.3%56917,630
17717 May−1.3%57117,703
17816 February−1.3%57017,673
17925 March−1.3%56817,612
18019 May−1.4%57017,683
1815 March−1.4%56917,625
18220 February−1.4%56817,607
18322 May−1.4%56917,641
18411 May−1.4%57317,756
18528 December−1.4%56917,628
1865 June−1.5%57017,669
1874 February−1.5%56917,649
1886 February−1.5%56617,545
1895 February−1.6%56717,587
19014 May−1.6%56817,593
1914 March−1.6%56617,552
19223 May−1.6%56617,539
19317 October−1.6%56617,553
1948 January−1.7%56317,467
1956 January−1.7%56717,587
19629 May−1.7%56817,597
19710 March−1.7%56617,557
19819 December−1.7%56517,513
19911 April−1.7%56517,522
20025 May−1.8%56917,648
20128 May−1.8%56817,595
20224 February−1.8%56617,531
20321 October−1.8%56517,516
20427 August−1.9%56617,561
2053 January−1.9%56217,418
20623 October−1.9%56517,527
2074 April−1.9%56417,489
20826 May−1.9%56617,557
2094 June−2.0%56617,558
21016 October−2.1%56517,504
21127 February−2.1%56417,473
21231 January−2.1%56317,445
2137 November−2.1%56217,437
21412 December−2.2%56317,442
21518 May−2.2%56717,570
2166 November−2.2%56317,446
21712 November−2.3%56517,505
21820 October−2.3%56417,483
21912 March−2.3%56417,489
22022 February−2.3%56417,496
22114 March−2.3%56217,421
22215 March−2.3%56517,502
22314 November−2.3%56217,415
22424 October−2.3%56217,435
22517 February−2.3%56217,429
22612 October−2.4%56617,544
2276 March−2.4%56317,455
22818 October−2.4%56317,468
2297 March−2.4%56017,371
2309 February−2.4%56217,432
23126 October−2.5%56617,537
23225 October−2.5%56417,469
23323 February−2.5%56317,451
2344 May−2.6%56617,540
2357 January−2.6%56417,483
23610 November−2.6%56117,401
23731 May−2.6%56317,448
23818 December−2.7%56017,365
23910 April−2.7%56117,390
24015 November−2.7%56117,403
24128 February−2.8%55917,340
24230 October−2.8%56117,376
24319 April−2.8%56117,402
24424 May−2.9%56117,381
24530 August−3.0%55917,336
2465 November−3.1%55917,329
24721 December−3.1%56117,398
24815 December−3.1%55917,324
2496 May−3.1%56117,384
2502 June−3.1%55917,327
2518 November−3.2%56017,355
2525 April−3.3%56017,356
2533 April−3.3%55917,318
2543 November−3.4%55717,261
2554 November−3.4%55617,226
25611 February−3.4%55817,312
25715 August−3.4%56117,392
25811 March−3.4%55617,233
25924 April−3.5%55717,252
26018 April−3.5%55717,280
2618 May−3.5%55617,235
26221 March−3.5%55517,204
26331 August−3.6%55917,314
26416 April−3.6%55717,264
26520 March−3.6%55617,238
2669 November−3.6%55917,324
26717 December−3.6%55617,245
26827 October−3.6%55617,230
2698 April−3.7%55517,191
27029 October−3.7%55717,257
27123 April−3.7%55717,262
27222 October−3.7%55617,227
2732 March−3.8%55817,295
27426 February−3.8%55517,207
27518 February−3.9%55617,237
27627 April−3.9%55817,295
27719 February−3.9%55517,208
27812 April−3.9%55517,213
27918 November−4.0%55317,132
2802 November−4.0%55717,265
28118 March−4.1%55317,137
2822 April−4.2%55417,161
2831 June−4.3%55817,295
28416 March−4.3%55617,223
28521 November−4.3%55117,073
28614 April−4.3%55317,146
28716 December−4.3%55117,079
28828 April−4.3%55217,100
28913 May−4.4%55317,139
29026 April−4.4%55217,120
29119 October−4.5%55317,136
29228 October−4.5%55017,054
29328 March−4.6%55017,054
29429 April−4.6%54917,010
29525 April−4.6%55017,051
29631 October−4.6%54917,025
29722 April−4.7%55017,059
29827 March−4.7%54917,024
29929 December−4.8%54716,953
3006 April−4.8%55217,114
30113 January−4.8%54816,999
30224 January−4.9%55117,072
3035 December−4.9%54616,929
30425 February−4.9%55117,066
30528 November−5.0%54616,927
30623 March−5.0%55217,099
30724 March−5.0%54917,013
30826 March−5.1%54917,018
30922 December−5.1%54716,965
31025 November−5.1%54716,945
3111 November−5.1%54816,984
31217 November−5.2%54616,911
3133 May−5.2%54917,033
3144 December−5.3%54616,916
3156 December−5.3%54716,969
31622 March−5.4%54716,946
31720 November−5.4%54516,892
3189 April−5.4%54616,936
31926 November−5.5%54516,894
32010 December−5.5%54516,903
3218 March−5.5%54716,964
32217 March−5.6%54616,923
32329 March−5.6%54616,918
32430 March−5.6%54716,966
32530 April−5.7%54416,857
3269 March−5.7%54616,938
3277 April−5.7%54516,906
32820 April−5.8%54816,991
32914 December−5.9%54616,912
3303 December−5.9%54216,809
3319 December−6.0%54116,769
33223 December−6.1%54016,752
33313 February−6.2%54116,780
33416 November−6.2%54516,897
3352 May−6.2%54316,823
33627 November−6.3%54016,740
33713 March−6.4%54016,755
33819 November−6.5%54016,727
33923 November−6.5%54216,814
34029 November−6.6%54116,757
34117 April−6.6%54016,737
34224 November−6.6%53916,695
34331 March−6.7%53916,708
34411 December−7.0%53616,628
34519 March−7.0%53716,659
34622 November−7.1%53716,651
34713 October−7.1%53616,627
34821 April−7.6%53716,639
3497 December−7.9%53416,544
3502 December−7.9%53116,446
35113 November−8.0%53116,469
3521 April−9.2%52516,260
3538 December−9.4%52316,199
35413 April−10.0%52316,209
35530 December−10.5%51515,973
35613 December−10.5%51816,064
35730 November−14.3%49915,482
3581 May−15.6%49115,236
3591 December−18.2%47614,764
36024 December−18.4%47514,726
3612 January−19.1%46814,514
36226 December−19.8%46514,405
3631 January−22.0%45414,081
36431 December−23.4%44413,752
36525 December−26.3%42913,296
29 February−21.9%4533,622

Source and method

Where the numbers come from#

The data
National Institute of Statistics (INS), Romania: the table “Live births by date of birth (day, month and year)”, 1995–2025, supplied on request no. 65897 of 15 September 2026. It covers 11,323 days and 6,532,338 births; the days add up exactly to the annual total INS gives for each year. Download the daily data (CSV).
What is counted
Live births, by date of birth. Until 2011, babies whose mothers had their domicile in Romania; from 2012, those whose mothers had their domicile or usual residence in Romania and whose birth was registered at a Romanian civil registry office. Figures for 2013–2023 are revised, 2024 is final and 2025 semi-final.
The ranking
For each year, births on a day are divided by that year's daily average. A date's rank comes from the average of this ratio over the 31 years, so years with many births do not weigh more than years with few. 29 February exists in only eight years and is left out of the ranking.
Surrounding days
For holidays, the 13th and 29 February, each day is compared with the average of the same weekday in the three weeks before and the three weeks after. The comparison leaves out every date that is or became a public holiday, plus 24 and 31 December. Fixed-date holidays use only the years in which they fell Monday to Friday.
The holidays
The year each day became a day off comes from the laws that amended the Labour Code: Legea nr. 202/2008 (15 August), Legea nr. 147/2012 (30 November), Legea nr. 176/2016 (24 January), Legea nr. 220/2016 (1 June), Legea nr. 52/2023 (6 January), Legea nr. 52/2023 (7 January).
What it cannot show
The table does not say how a baby was born, at what time or in which county. The explanation through caesareans and scheduled births is inferred from the pattern of days.
Related