Chapter 5 · Levels of organisationLesson 5.4CS
The biotope and the structural indices of the community: abundance, dominance, frequency
Two meadows have the same four plant species. How do you show, with numbers, that one of them is dominated by a single species?
- Size
- from 10 µm to 20 km
- Level
- from tissue to ecosystem
- Time
- a season
Before you read: what do you think?
In the oilseed rape fields at Secuieni (Neamț county), traps caught 3,007 pest insects from 19 species. What share of the total was a single species, the pollen beetle?
See the answer
Over 70%: 2,114 out of 3,007 insects. The other 18 species shared the rest, under 30%. The list of 19 species does not reveal this imbalance; dominance does, an index calculated from the count.
Between 2010 and 2012, at the agricultural research station at Secuieni, in Neamț county, researchers placed yellow bowls of water, which attract insects, in fields of oilseed rape. Of the 3,007 pest insects caught, 2,114 belonged to a single species, the pollen beetle. To describe a community (biocoenosis), you need the list of species, but also how many individuals each one has and how often it turns up.
The biotope is described by factors you can measure
A biotope has a few main factors. Light matters through its intensity and through how many hours a day the sun shines. Temperature, measured in °C, matters through its averages, but also through extremes and frosts. Water is measured as precipitation, in millimetres per year, and as air humidity and soil moisture. Soil differs in texture (sand, clay), in humus and in mineral substances. pH shows how acidic water or soil is: below 7 is acidic, 7 is neutral, above 7 is basic. In water, dissolved oxygen and salinity matter too.
A measurement has a unit, a place and a moment. A temperature read in the sun cannot be compared with one read in the shade, and the pH of a forest soil cannot be compared with that of a meadow if the samples were taken at different depths.
Abundance and dominance: how many individuals, and what share of the total
Species richness (S) is the number of species found in a sample or an area. The abundance (A) of a species is the number of its individuals in a sample or on a given area.
Dominance (D) is the abundance of a species expressed as a percentage of the total number of individuals of all species: D = A ÷ N × 100, where N is the total number of individuals. By their dominance, species fall into classes: subrecedent (below 1.1%), recedent (1.1–2%), subdominant (2.1–5%), dominant (5.1–10%) and eudominant (above 10%).
Two meadows with the same four species and 20 plants each can look very different. In the first, each species has 5 plants, or 25%. In the second, one species has 17 plants (85%) and the others one each (5%). Species richness is the same, S = 4, but the second meadow is dominated by a single species. The diversity of a community takes both into account: the number of species and how evenly the individuals are shared among them.
For the curious
A widely used diversity index is 1 − Σp², where p is each species’ share of the total. For the first meadow: 1 − 4 × 0.25² = 0.75. For the second: 1 − (0.85² + 3 × 0.05²) = 0.27. A higher value means more species or a more even spread of individuals among them; on its own it does not show that a place is healthier or more valuable, because it says nothing about which species live there.
Frequency: in how many samples the species appears
In the field, several samples are taken: squares of meadow of the same size, or traps of the same size checked at the same intervals. The list of species from a single sample plot, with the abundance of each, is called a relevé. Frequency (also called constancy) shows in what percentage of samples a species appears: F = p ÷ P × 100, where p is the number of samples in which the species was found and P the total number of samples.
By frequency, species are accidental (1–25%), accessory (25.1–50%), constant (50.1–75%) or euconstant (75.1–100%). For both indices, the percentage is rounded to one decimal place before the class is chosen. A species can have many individuals in a single sample and be missing from all the others: its abundance is high, but its frequency low. Each index answers a different question.
For the curious
Some researchers combine the two indices into the ecological significance index, W = F × D ÷ 100. Species with W above 5% are considered characteristic of that community.
Who feeds whom
A community is also described by its feeding relationships. A food chain starts with producers (green plants, algae), passes through consumers (herbivores, then carnivores) and ends with decomposers (bacteria, fungi). In a real community, a species eats several kinds of food and is eaten by several predators, so the chains link up into a food web. When a species becomes eudominant, like a pest in a field, the web around it changes: its food supply shrinks, and its predators find more to eat.
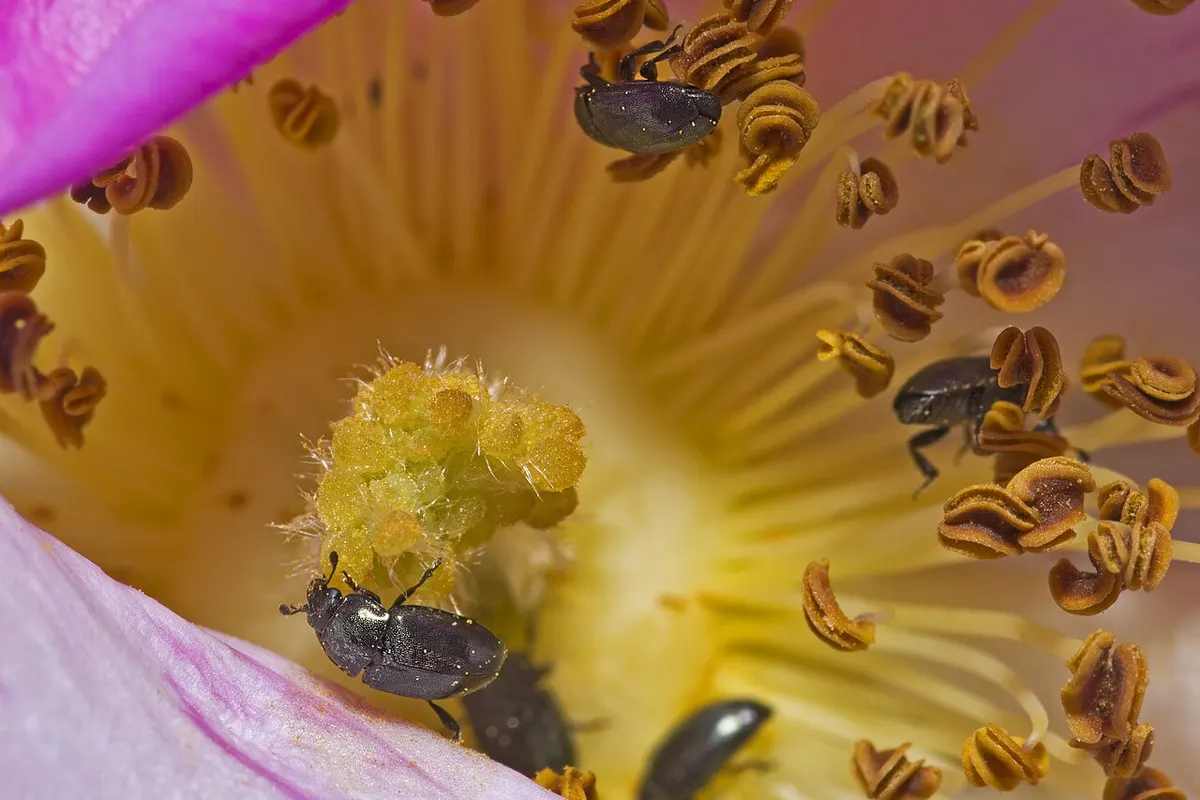
Photo: AJC1, CC BY-SA 2.0, source. Cropped and resized.

Worked example
Three insects from the rape field
Real data from Secuieni: 3,007 pest insects in 54 samples. The pollen beetle (Meligethes aeneus): 2,114 individuals, found in all 54 samples. The flea beetle Phyllotreta atra: 124 individuals, in 40 samples. Oulema melanopa, a cereal beetle: 1 individual, in a single sample.
The dominance of the pollen beetle is 2,114 ÷ 3,007 × 100 = 70.3%, so the species is eudominant. For Phyllotreta atra, D = 124 ÷ 3,007 × 100 = 4.1%, a subdominant species. For Oulema melanopa, D = 1 ÷ 3,007 × 100 = 0.03%, a subrecedent species.
The frequencies are 54 ÷ 54 × 100 = 100% (euconstant), 40 ÷ 54 × 100 = 74.1% (constant) and 1 ÷ 54 × 100 = 1.9% (accidental). The researchers explain the presence of some accidental species, such as Oulema, by the previous crop (barley) and by the neighbouring fields.
The conclusion holds only for this method: yellow bowls mainly attract insects that fly towards yellow, so they show only part of the community.
In Romania
Movile Cave, a biotope without light
Movile Cave, discovered in 1986 near Mangalia, on the Black Sea coast, had no natural entrance. Its biotope is unusual in every factor: total darkness; air with about 10% oxygen, roughly half as much as outside, and 2–3.5% carbon dioxide, about 100 times more than outside; hydrogen sulfide and methane; and thermal water at 21 °C.
Without light there is no photosynthesis. The producers are bacteria that get their energy from hydrogen sulfide and methane, and the cave’s whole food web rests on them. By 2021, 52 species of invertebrates had been found here, and 37 of them live only in the cave and in the groundwater around it. Only species adapted to this biotope live in it.
In short
- The biotope is described by measurable factors: light, temperature, water, soil, pH, and in water also dissolved oxygen and salinity.
- Species richness is the number of species; abundance is the number of individuals of a species in a sample.
- Dominance is the percentage of a species’ individuals out of all individuals: D = A ÷ N × 100; species are subrecedent, recedent, subdominant, dominant or eudominant.
- Frequency (constancy) is the percentage of samples in which a species appears: F = p ÷ P × 100; species are accidental, accessory, constant or euconstant.
- Diversity depends on the number of species and on how evenly the individuals are shared among them.
- Feeding relationships link producers, consumers and decomposers in food chains, which together form a food web.
Common mistakes
WrongIf two places have the same species, they have the same community.
RightThe same species list can hide very different abundances. Dominance shows whether one species dominates the community or whether the individuals are evenly shared.
WrongThe species with the most individuals is also the most frequent.
RightAbundance counts individuals; frequency counts the samples in which the species appears. A species can have many individuals in a single sample and be missing from the others.
WrongA higher diversity index automatically means a healthier ecosystem.
RightThe index describes how individuals are shared among species in the data collected. It does not say which species they are or whether they are rare or invasive, and it depends on the collection method.
Check yourself
Seven questions. For the first six you see the explanation at once, with the paragraph of the lesson that supports it; for the written ones you compare with a good answer.
What does the dominance of a species show?
Answer
b) What percentage of all the individuals of all species belong to that species. Dominance relates the abundance of a species to the total number of individuals. The percentage of samples is frequency; the number of species is species richness.
In a meadow, 20 samples were taken. One ant species has 300 individuals, all in a single sample, next to an anthill. What can you say?
Answer
a) It has high abundance and low frequency. The large number of individuals gives a high abundance, but the species appears in only 1 of the 20 samples, that is, 5%: it is an accidental species.
Which of the following is NOT a factor of the biotope?
Answer
c) The number of insect species. The number of species describes the community (it is species richness). pH, temperature and precipitation are non-living factors of the biotope.
At Secuieni, Phyllotreta atra had 124 individuals out of a total of 3,007. Calculate its dominance, as a percentage, to one decimal place.
%Answer
4.1 %. D = 124 ÷ 3,007 × 100 ≈ 4.1%. The value falls in the 2.1–5% class, so the species is subdominant.
A weevil from the rape field, Baris chlorizans, was found in 27 of the 54 samples. What is its frequency, as a percentage?
%Answer
50 %. F = 27 ÷ 54 × 100 = 50%. The value falls in the 25.1–50% range, so the species is accessory.
The frequencies below were measured at Secuieni. Choose the class of each species.
Answer
Accidental (1–25%): Sitona lineatus: 9.3%; Crepidodera ferruginea: 18.5%.
Accessory (25.1–50%): Lygus pratensis: 40.7%; Oscinella frit: 29.6%.
Constant (50.1–75%): Epicometis hirta: 57.4%; Ceutorhynchus napi: 66.7%.
The class is read straight from the range: up to 25% accidental, between 25.1 and 50% accessory, between 50.1 and 75% constant.
Two classmates count the plants in two meadows to find out which has the more balanced community. The first uses 10 squares of 1 m² in April, the second 3 squares of 4 m² in August. Can they compare their results? What should they change, and which factor of the biotope would be worth measuring?
A good answer
They cannot compare them directly: they used different numbers of samples, different areas and different months, and abundances and frequencies depend on all three. They need to use the same number of squares, of the same size, in the same period, and record the species in the same way. Light or soil moisture would be worth measuring, since either can explain why a species dominates in one meadow and not in the other.
A complete answer names at least two differences in method, proposes a common method and links a factor of the biotope to the structure of the community.
Practical work for this lesson
- The same species, different proportions – Ecological case study, 40–50 minutes (CS)
Terms
- species richness
- The number of species found in a sample or an area.
- abundance
- The number of individuals of a species in a sample or on a given area.
- dominance
- The abundance of a species expressed as a percentage of the total individuals of all species in the sample.
- relevé
- The list of species found on a single sample plot, with the abundance of each species.
- frequency
- The percentage of samples in which a species appears; also called constancy.
- diversity
- The property of a community that takes into account the number of species and how evenly the individuals are shared among them.
- food web
- All the food chains in a community, linked to one another through shared species.
- abiotic factors
- The non-living conditions of the biotope: light, temperature, water, soil, pH.
Sources and link to the programme
- Buburuz, Trotuș, Tălmaciu, Pochișcanu (2013), Analele INCDA Fundulea 81 – Analiza unor indicatori ecologici ai speciilor de insecte dăunătoare din culturile de rapiță de toamnă – the method (yellow bowls, SCDA Secuieni agricultural research station, 2010–2012); the formulas for abundance, dominance (D = nA/N × 100), constancy (C = npA/NP × 100) and the ecological significance index; the dominance classes (D1–D5) and constancy classes (C1–C4); table 1: 19 species, Meligethes aeneus 2,114 individuals and C = 100%, Phyllotreta atra 124 and 74.07%, Oulema melanopa 1 and 1.85%, Baris chlorizans 50.00%, the other frequencies used; dominance of the pollen beetle 70.30%; accidental species arriving from the previous crop (spring barley) and from neighbouring crops
- OpenStax – Biology 2e, 45.6 Community Ecology – species richness and diversity (number of species and relative abundance)
- OpenStax – Biology 2e, 46.1 Ecology of Ecosystems – producers, consumers, decomposers; food chain and food web; chemoautotrophic producers
- OpenStax – Biology 2e, 44.1 The Scope of Ecology – abiotic factors: temperature, light, water, soil, pH
- GeoERA – Valentina Cetean (Geological Institute of Romania): Movile cave, Romania – 5.5 million years time capsule – discovery in 1986 at Mangalia; about 10% oxygen, 2–3.5% carbon dioxide (100 times more than in ordinary air), hydrogen sulfide, 1–2% methane; thermal water at 21 °C
- Brad, Iepure, Sarbu (2021), Diversity 13(3):128 – The Chemoautotrophically Based Movile Cave Groundwater Ecosystem – 52 species of invertebrates (21 aquatic, 31 terrestrial), of which 37 are endemic to the cave ecosystem and its associated groundwater
- Kumaresan et al. (2014), Geomicrobiology Journal 31(3) – Microbiology of Movile Cave: a chemolithoautotrophic ecosystem – cave discovered in 1986; an ecosystem supported by chemoautotrophic primary production from hydrogen sulfide and methane; invertebrates, many of them endemic
From the programme: “Characteristics of the biotope and structural indices of the biocoenosis” (specialism, Natural Sciences). Specific competences addressed: 1.1, 1.2, 2.1, 2.2.