A lunar atlas · The view beyond
The other side
of the Moon
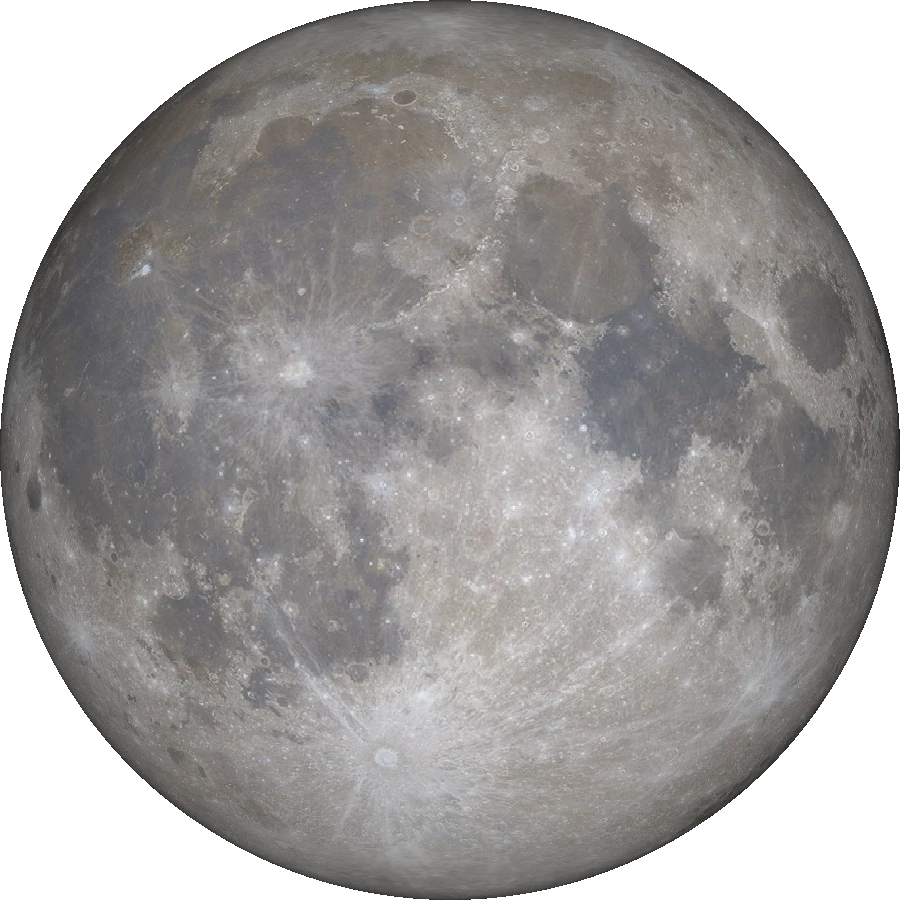
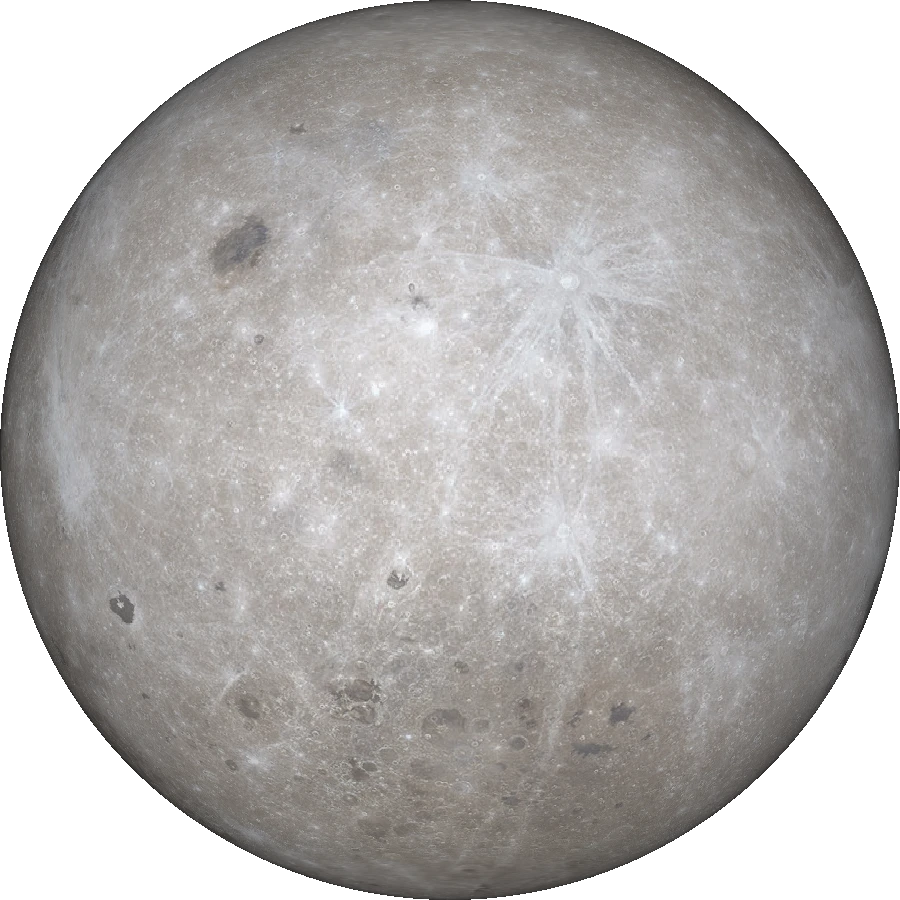
From Earth, we see almost the same face of the Moon. On the other side, dark plains are much rarer. Turn the globe and compare the two hemispheres.
Lunar Reconnaissance Orbiter · NASA / LROC ↗
 0°
0°Comparison images are available below, including without the interactive globe.
An orbital-image mosaic from LROC, processed by NASA SVS. Consistent lighting for comparison; not a photograph of a single moment.
The surface · Follow the dark patches
One Moon.
Two histories on the surface.
The seas on lunar maps are plains of solidified lava. Their dark colour remains visible in full sunlight. On the far hemisphere, these expanses are much rarer. NASA ↗
The difference goes below the surface
The Moon’s crust is generally thicker on the far side than on the near side. The appearance of the two hemispheres records an uneven volcanic history. The origin of this asymmetry remains a research question; the colour of a photographic mosaic alone cannot measure crustal thickness. NASA ↗
Motion · One spin for every orbit
It turns.
And keeps facing us.
The Moon spins once on its axis in the time it takes to orbit Earth: about 27.3 days. This synchronisation keeps almost the same hemisphere facing us. Follow the mark on each Moon in the diagram: its direction in space changes, while it continues to point towards Earth. NASA ↗
Why “almost” matters
The orbit is elliptical, and the Moon’s axis is tilted. Together with changes in our observing position, these motions let us look a little beyond the edges over time. This is called libration. The globe above gives you a freedom of movement that an observer on Earth does not have. NASA ↗
Sunlight · Two views at the same moment
Day breaks
on the far side, too.
When we see a full Moon, the far hemisphere is passing through its night. At new Moon, sunlight falls on the side facing away from us. Move the slider and watch the two discs change together. NASA ↗
Day 14.8 · Near disc illuminated: 100% · Far disc illuminated: 0%
The fixed images above show both hemispheres’ terrain. At new Moon, the near disc is dark and the far disc lit; at full Moon, the situation reverses.
Idealised geometry, north up: a circular orbit without tilt, libration or eclipses. Percentages describe the illuminated portion of each projected disc. This is not a calendar of today’s Moon.
Why the phases need two more days
Relative to the stars, the Moon completes an orbit in about 27.3 days. Meanwhile, Earth moves along its own orbit around the Sun. The Moon must travel a little further to return to the same position relative to sunlight. That is why one new Moon to the next takes about 29.5 days. NASA ↗
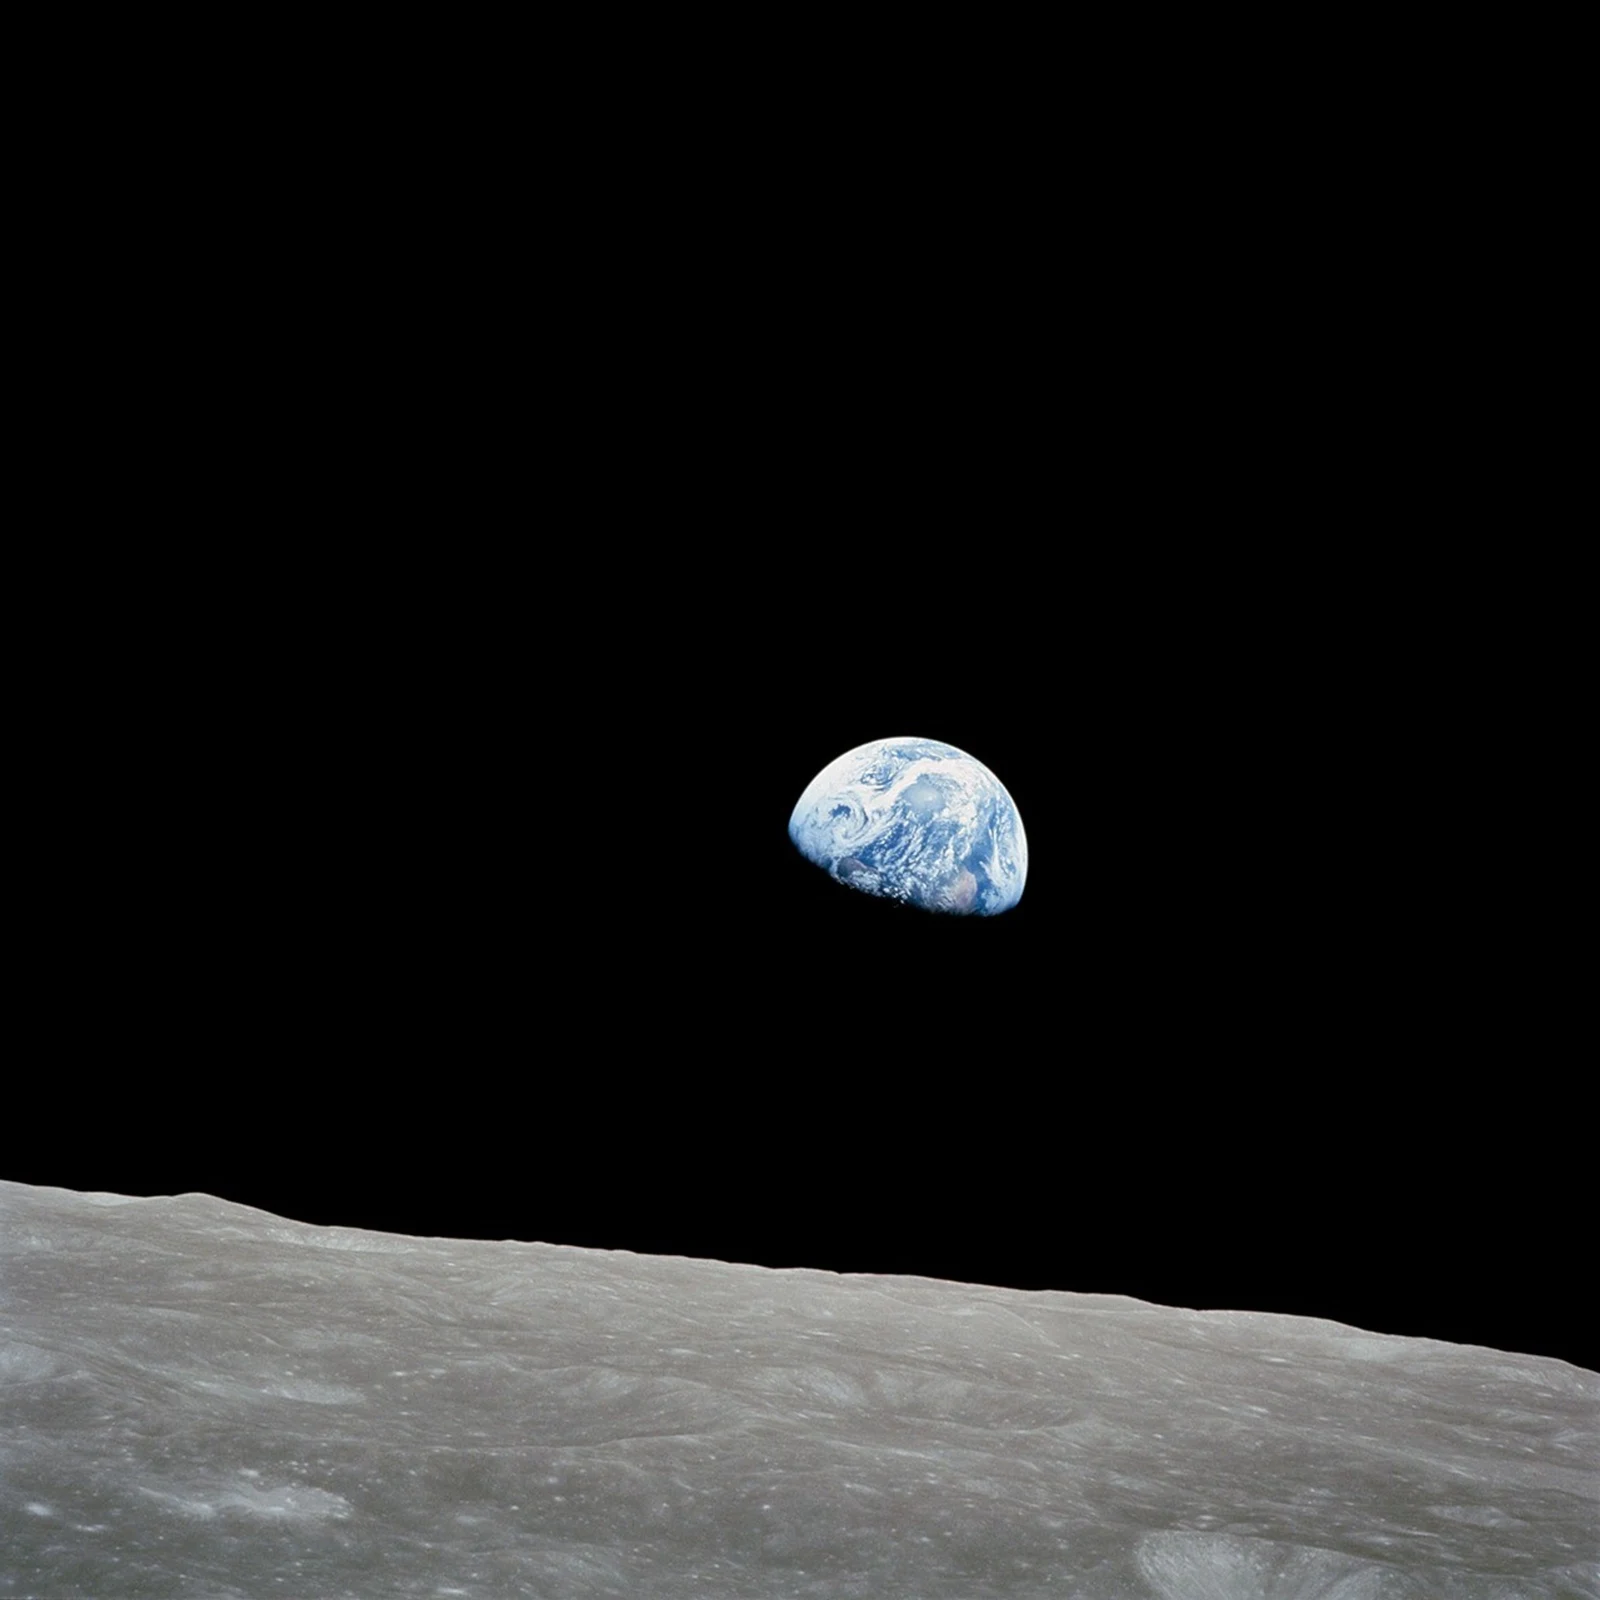
24 December 1968 · Apollo 8
From near the Moon,
home fits in a photograph.
Bill Anders photographed Earth from Apollo 8 as the spacecraft orbited the Moon. The grey horizon in the foreground and the sunlit planet exchange our familiar viewing positions. The photograph “Earthrise” preserves that perspective.
Sources and images
How this view is made
The globe and comparison images use NASA’s 2025 colour map, assembled from Lunar Reconnaissance Orbiter observations. The mosaic was adjusted for visual presentation, with polar gaps filled using laser-altimeter albedo data. The projection keeps north up; comparison lighting makes the surface visible. Scientific measurements should use the original data rather than these images.
Globe and projections: adapted from NASA’s Scientific Visualization Studio, Ernie Wright (USRA), LROC / NASA / GSFC / Arizona State University data. Photograph: NASA / Bill Anders. Informational reuse under NASA’s guidelines; no NASA endorsement implied. NASA image usage guidelines ↗
The explanations follow the NASA material below, accessed on 7 September 2026.
- Lunar surface and structure
- Synchronous rotation
- Moon phases and the two periods
- Lunar mosaic and image processing
- The “Earthrise” photograph
- Lunar libration