
Loading the sea floor…
A map of a drowned land
Doggerland: the land under the North Sea
Dry land once ran from England to Denmark. On this map the sea rises over today’s surveyed sea floor, from 16,000 years ago to now, above the rivers that have been found beneath it. The shore is a computed estimate; the rivers are mapped.
How to read the map
Gold is land that the sea has since taken#
The relief is real: the floor of the North Sea as surveyed today, lit from the north-west, with heights stretched so that a rise of ten metres can be seen.
Grey land is still land. Gold land is sea floor now. The dotted line is today’s coast. The shore of each moment is computed: today’s sea floor against the level the sea had then, place by place.
Keep scrolling. The clock runs from 16,000 years ago to the present.
16,000 to 11,500 years ago
When the ice drew back, the plain was at its widest#
The white is ice, drawn from mapped margins: Scotland’s shrinks to the Highlands, Scandinavia’s pulls back up the Norwegian coast. So much water was still locked in the world’s ice sheets that the sea stood far below its present level.
On this map the land that is now sea floor is largest about 14,500 years ago: 268,000 km² between Yorkshire, Jutland and the Dover Strait.
It was not bare for long. DNA preserved in sediment from one of its buried river valleys, read in 252 samples from 41 cores, shows oak, elm and hazel present more than 16,000 years ago, which the authors read as a sign of sheltered places where trees survived the cold in the north.
10,500 years ago
Land you could cross on foot, from Yorkshire to Denmark#
201,000 km²of land, now sea floorArchaeologists call it Doggerland, after the Dogger Bank, the shoal at its northern edge. The name dates from 1998; the people who lived here left none.
At this moment the map counts 201,000 km² of land where the southern North Sea is now. The island of Great Britain, measured on the same grid, has 223,000 km².
The sea is 43 metres below today’s at Dogger Bank, and rising.
What is mapped, not computed
The rivers were found with oil-industry echoes#
The pale blue shapes are not computed here. They are river channels, lakes and marshes as researchers have traced them in seismic surveys, most of them shot for oil and gas, in which buried valleys show as shapes beneath the sea bed. In the 2000s a team at the University of Birmingham mapped more than 23,000 km² of drowned landscape this way.
The University of Bradford’s 2025 data package includes 1,873 mapped landscape features, all drawn here, among them 1,552 channels and 23 lakes, alongside 471 peat records. One river, traced for tens of kilometres across Dogger Bank, was named after the geologist Fred Shotton.
South of the bank lies the Outer Silver Pit, a basin mapped over more than 1,700 km²: first a lake, later an arm of the sea.
September 1931
A trawler’s net brought up a spear point in a lump of peat#
The Colinda was fishing between the Leman and Ower banks, off Norfolk, in 19 to 20 fathoms. In the net came a block of what fishermen called moorlog, and in the block a barbed point carved from red deer antler, 14.6 cm long by the museum’s record. “I thought it was steel,” the skipper, Pilgrim Lockwood, said.
Radiocarbon dating of the point itself, published in 1991, gave 11,740 ± 150 radiocarbon years: a hunter’s tool from between about 13,900 and 13,250 years ago, found about 36 metres under the sea. It is in Norwich Castle Museum’s collection.
The idea was older. In 1913 the geologist Clement Reid had described the Dogger Bank as “the northern edge of a great alluvial plain” and drawn its coast. In 1998 the archaeologist Bryony Coles gave the land its name, “to emphasise its availability for settlement by prehistoric peoples”.
Who lived here
Most of what is known of the people washes up on Dutch beaches#
The Netherlands builds beaches and harbour land from sand sucked off the sea floor, and the finds come with it. Barbed points of bone and antler picked up on the Dutch coast “verge on 1,000”. Of ten that were analysed, six were red deer and two were made of human bone.
Fifty-six human bones from the North Sea have been radiocarbon dated; a later review counts 33 of them as Mesolithic, a few of those a little older. Their chemistry points to “a significant component of freshwater fish” in the diet.
Where Rotterdam’s harbour was extended, archaeologists excavated a site that people visited from about 8500 to 6500 BC, lying 22 to 17 metres below sea level. And from the Zeeland Ridges came a piece of a Neanderthal’s skull, found in 2001 among dredged shells: not dated directly, about 50,000 years old by the Leiden museum’s estimate, from an earlier Doggerland of an earlier cold age.
10,500 to 9,250 years ago
The sea rose about a metre a century#
Between 10,500 and 8,500 years ago the sea climbed 17 metres against the land at Dogger Bank: 0.9 m per century on average, about a centimetre a year.
On ground this flat, a centimetre is a long way. From 9,500 to 8,500 years ago the map loses about 58 km² every year. Over each 500 years the shore of the southern North Sea typically moves about 6 km, and in the flattest quarter of places more than 13: some hundreds of metres in a lifetime, enough to lose a familiar marsh or beach.
The rise was not smooth. At Rotterdam, sediments record a jump of about two metres within 200 years, starting some 8,450 years ago. Its authors link the timing to the draining, possibly in stages, of the great ice-dammed lakes of North America. North Sea peats record two such phases of faster rise, peaking around 10,300 and 8,300 years ago. This map’s sea level is too smooth to show either. Neither is the Storegga wave, which came soon after the second and passed in hours.
Britain becomes an island
The last dry crossing ran from Norfolk to Holland#
Two seas close in on it: the Channel coming north through the Dover Strait, and the North Sea coming south. On this map they meet between 9,250 and 9,000 years ago, and Britain is cut off.
Neither the date nor the place is settled. On this map the Dover Strait is already open water by then, and the last link is here, further north. A widely used reconstruction, by Sturt, Garrow and Bradley, has it the other way: “The Dover Straits are breached and Britain separates from the continent at some point between 8000 and 7500 BP.” Another review says about 8,000 years ago.
Three things move the answer: which sea-level model is used, how much the tides have since scoured the floor of this narrow sea, and how well the sea level is known at this very spot. A map built on today’s sea floor, like this one, will tend to break the bridge early. The last dry path, tested at every step, breaks about 9,200 years ago where the floor now lies 29 m down. Of the 8 sea-level measurements published in 2025 within 100 km of that spot, 7 have the sea lower than this map does, by up to 4.3 m. Each metre moves the break by about 110 years: with the sea as low as the lowest of those measurements, the path would hold until about 8,800 years ago. That is a what-if, not a date. And a path on a map is not a walk: tides, channels and marsh decide that.
9,750 to 8,250 years ago
The hills in the north became an island#
Dogger Bank is the highest ground of the plain; its layers record land, ice and sea in turn. By 9,500 years ago the map shows it surrounded by water: an island of about 17,600 km².
It shrinks as the clock runs: 12,300 km² at 9,000 years ago, 7,700 at 8,500, 4,500 at 8,250.
Walker and colleagues, who reconstructed the same sequence in 2020 from their own maps, also have Doggerland broken into islands “by 9000 cal BP”.
About 8,150 years ago, in late autumn
A wave came from the north. It did not end Doggerland#
Off Norway, the edge of the continental shelf gave way: the Storegga slide, which moved 2,400 to 3,200 km³ of sediment. Moss buried green in the wave’s deposits dates it to 8,120–8,175 years before 1950 and, by its growth, to late autumn.
The sea ran up more than 20 metres in Shetland, 10 to 12 on the Norwegian coast, 3 to 6 in north-east Scotland. In a core from a drowned river valley off Norfolk, a layer of broken shells and a sudden influx of tree DNA has been read as the same wave. Further east the wave may have left less than was thought: a 2026 simulation over the shallow sea of the time finds it “probably too small” to have laid down the deposits reported on the Danish and German coasts, and reads those layers as the work of the slowly rising sea.
On this map the island then measures between 3,700 and 4,500 km². Walker and colleagues conclude that the tsunami was “not a final flooding event”: the land that survived it was drowned afterwards, by the ordinary rise of the sea.
8,000 to 6,750 years ago
The last of it went under about 7,000 years ago#
700 km² at 7,500 years ago. 27 km² at 7,250. At 7,000, nothing: the top of the bank is under water, as it has been ever since.
The published estimates sit close by. Walker and colleagues put the loss of the island “around 7000 cal BP”; an earlier model, Shennan and colleagues’, has it an island at high tide by 7,500 radiocarbon years ago and wholly submerged by 6,000, which is roughly 8,350 and 6,800 calendar years.
What was left were shallows. Fishermen have worked them for centuries, and the bank gave the drowned land its name.
Where the map misleads
These islands off Norfolk may never have been islands#
The long parallel ridges are sandbanks, and sand moves. The Bradford data package labels one such bank “created by Holocene marine processes”: built by the sea after the land was drowned. A map made from today’s sea floor draws them as islands of 8,500 years ago all the same.
The reverse error is larger. The old land surface is often buried under metres of later sand and mud, or has been planed off by waves; the peat that fishermen dredge up is what remains of it. Where the gold lies on this map, treat the outline as right to within some kilometres, not to a beach.
The sea level itself is better pinned, and best for the later part. Tested against 776 dated shoreline measurements from Britain and the Netherlands, each predicted without its own neighbours, the field used here is typically off by about 0.8 m for the last 7,500 years, 1.2 m between 8,500 and 7,500 years ago, 2.0 m between 9,500 and 8,500, and 2.9 m before that, where measurements are few.
The last 6,500 years
The map is still being drawn, by people building wind farms#
The sea closes over the last shallows and the coasts take the shapes on the school atlas.
Of the 1,873 mapped features, 794 come from the first seismic project and 269 from the Bradford team’s later work. Most of the rest, 676 of them, were digitised from the sea-bed surveys that offshore wind farms must file before they build: Hollandse Kust, Hornsea, Dogger Bank, Norfolk Boreas.
In 2019 a survey ship working one of those buried valleys brought up worked flint: a small flake, possibly waste from tool-making, and a piece broken from a stone hammer. The team called them the first archaeological artefacts from the survey area: found by a survey that went looking, not by a trawler’s luck.
Your town and the old shore
Pick a town around the North Sea or the Channel. The map measures how far it stood from the sea 10,500 years ago, and you can draw a line to a town on the other side.
No town chosen yet. The clock and the map are yours: play the years or move around.
Draw a line to
Drag the map with a mouse, or use the buttons.
How the map is made, and how far to trust it
“Years ago” counts back from 1950, as radiocarbon dating does. The shore is computed, not drawn. For every cell of today’s sea floor (EMODnet Bathymetry, 30 arc-seconds, about 900 by 550 metres) the map asks whether it lay below the sea of the chosen moment, and whether that water was joined to the open sea. Hollows below sea level that the sea had not yet reached are drawn in green: in life they were lakes, marsh or dry ground.
The sea level
How high the sea stood against the land differs from place to place, because the crust is still rebounding from the weight of the ice. The map starts from ICE-6G_C, a global model of that rebound, in steps of 500 years, and corrects it with measurements: 1,536 dated sea-level index points from Britain, Ireland and the Netherlands (old salt-marsh and peat surfaces whose height against the tide of their day is known). Each correction is spread over about 120 km and 600 years.
The test: every group of index points was left out in turn and predicted from the others. For the 776 points between 11,000 and 5,500 years old, in 106 groups, the uncorrected model is typically 2.9 m off; the corrected field 1.1 m, and within 3.1 m nine times out of ten. Before 8,500 years ago there are few measurements (88 between 9,500 and 8,500 years old, typical miss 2.0 m; 83 older still, typical miss 2.9 m, and off by more than 11 m one time in ten), and that far back the field is mostly the model. At a metre a century, two metres is two centuries.
A second test came from outside. The field was then compared with 56 sea-level index points from drowned peats of the North Sea floor, published in 2025 by Hijma and colleagues, none of which it had used: places far offshore, between Dogger Bank and the German Bight, where the earlier databases have almost nothing. Against these the field is typically 1.3 m off (the median miss), more than 3.5 m one time in ten, and on the whole 0.8 m too low; for the 25 points between 10,500 and 9,500 years old the median miss is 1.3 m. That is wider than the measurements’ own stated uncertainty, and it is not even: off the Dutch coast the field runs about a metre high, in the German Bight one to three metres low. Of 72 further samples that only set a ceiling for the sea, the field breaks 5 by more than a metre. With the paper’s correction for the slow sinking of the basin applied to the measurements, the field’s median miss is 1.7 m; the 8 models of the paper itself, which were chosen with these measurements in view, miss by 1.5 to 2.2 m at the same points: the same order of size, not a like-for-like contest. The test makes a large overall error unlikely. It does not settle any one place.
A finer regional product, the published BRITICE-CHRONO palaeotopography grids, was also compared. Read as they are here, the grids differ substantially from the newer offshore measurements. The cause is unresolved, so they were not used for the shore shown on this page. They stand on the same present-day sea floor as this map: where the two differ, it is in relative sea level, the sea measured against land that itself rises and sinks, and not in the terrain.
What the numbers count
“Land now under the sea” is the area that is land at the chosen moment and open sea today, between 50.8° and 58.5° north and 3° west and 9.5° east. Areas come from the 30 arc-second grid and from depths charted against low tide, which favours land: Great Britain measures 223,000 km² on this grid. The clock moves in steps of 250 years, so “between 9,250 and 9,000” means the change falls between two steps. Under it the sea level changes smoothly: bursts of faster rise that lasted a few centuries are averaged out.
Limits
Today’s sea floor is not the land surface of 9,000 years ago. Sand has buried it in some places and tides have cut it down in others; the Norfolk Banks and the Brown Bank are ridges the sea built later. East of Jutland the map lies outside the measurements it was tested on, and the Baltic of that time was a lake with its own history. The mapped rivers and lakes are a composite of features of different ages, as their authors state, and cover only the areas that have been surveyed: empty sea floor on this map is often unmapped, not featureless.
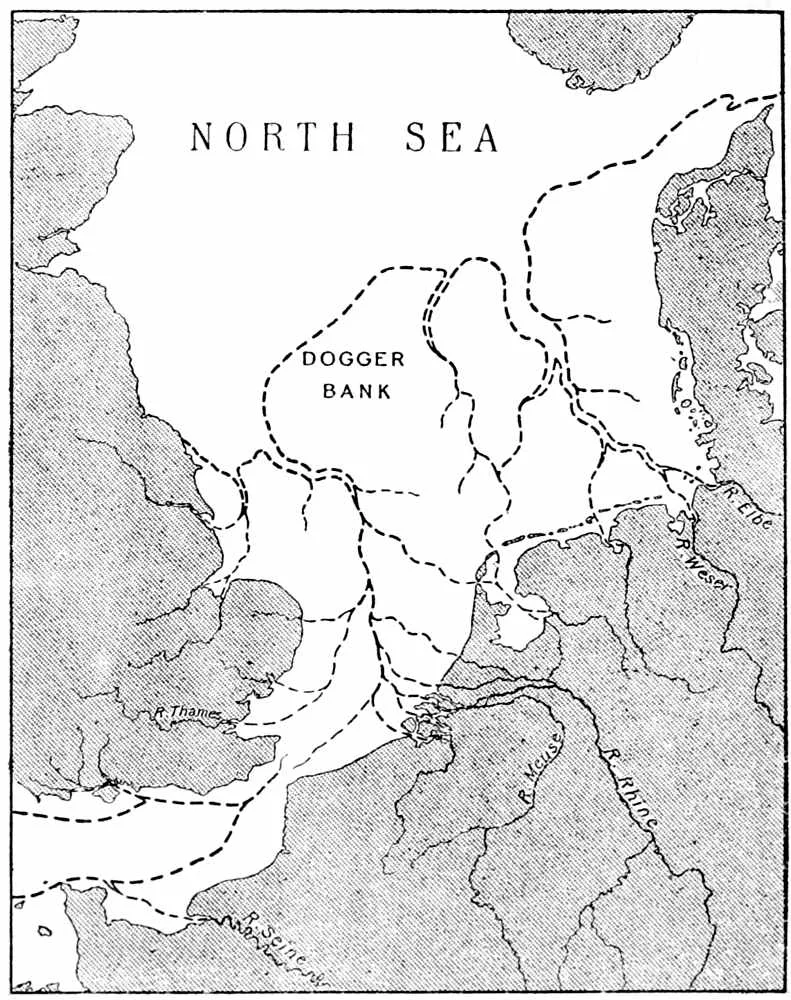
The first map of the drowned land, 1913
Clement Reid, a geologist of the Geological Survey, pieced this coast together from the stumps of drowned forests around Britain and from the peat that trawlers brought up on the Dogger Bank. “The Dogger Bank once formed the northern edge of a great alluvial plain, occupying what is now the southern half of the North Sea, and stretching across to Holland and Denmark,” he wrote. He had no way to date it, and no survey of the sea floor finer than a chart of soundings.
Doggerland by the half-millennium
Every number comes from the same grid and the same sea-level field as the map.
| Years ago | Land now under the sea, km² | Sea at Dogger Bank, m | Sea at Rotterdam, m | Britain joined to the continent | Dogger island, km² |
|---|---|---|---|---|---|
| 16,000 | 254,000 | −87 | −95 | yes | – |
| 15,500 | 256,000 | −86 | −92 | yes | – |
| 15,000 | 266,000 | −88 | −90 | yes | – |
| 14,500 | 268,000 | −87 | −88 | yes | – |
| 14,000 | 250,000 | −76 | −73 | yes | – |
| 13,500 | 246,000 | −71 | −67 | yes | – |
| 13,000 | 244,000 | −68 | −63 | yes | – |
| 12,500 | 238,000 | −64 | −58 | yes | – |
| 12,000 | 234,000 | −61 | −54 | yes | – |
| 11,500 | 229,000 | −56 | −49 | yes | – |
| 11,000 | 218,000 | −48 | −40 | yes | – |
| 10,500 | 201,000 | −43 | −35 | yes | – |
| 10,000 | 173,000 | −39 | −30 | yes | – |
| 9,500 | 133,000 | −34 | −26 | yes | 17,600 |
| 9,000 | 101,000 | −30 | −22 | no | 12,300 |
| 8,500 | 75,000 | −26 | −18 | no | 7,700 |
| 8,000 | 59,000 | −23 | −14 | no | 3,700 |
| 7,500 | 47,000 | −19 | −10 | no | 700 |
| 7,000 | 41,000 | −16 | −8 | no | – |
| 6,500 | 37,000 | −14 | −6 | no | – |
| 6,000 | 34,000 | −12 | −5 | no | – |
Questions people ask about Doggerland
When did Doggerland disappear?
In stages. On this map it is cut in two between 9,250 and 9,000 years ago, its northern hills are an island by 9,500 years ago, and the last of that island is gone by 7,000 years ago. Walker and colleagues (2020) give “around 7000 cal BP” for the island’s end.
Did a tsunami destroy Doggerland?
Not by itself. The Storegga tsunami of about 8,150 years ago struck coasts around the North Sea and would have been catastrophic for anyone in its path, but the study that examined the question concludes it was “not a final flooding event” for the land that was left. That went under because the sea kept rising.
When did Britain become an island?
Published estimates run from about 9,000 to 7,500 years ago. On this map the last land between Norfolk and Holland floods between 9,250 and 9,000 years ago; Sturt, Garrow and Bradley (2013) say between 8,000 and 7,500.
How big was Doggerland?
It had no fixed size. Counting the land that is now under the southern North Sea, this map gives 268,000 km² about 14,500 years ago, 201,000 km² at 10,500 and 101,000 km² at 9,000.
Where people lived when ice covered Europe shows the whole continent from 27,000 to 8,000 years ago.
Sources
- Sea floor and relief: EMODnet Bathymetry Digital Terrain Model, sampled at 30 arc-seconds.
- Sea level against the land: ICE-6G_C (VM5a), Peltier, Argus and Drummond 2015, adjusted to the index points of HOLSEA-NL (de Wit and Cohen) and of the Britain and Ireland database (Shennan, Bradley and Edwards 2018). Outside test: Hijma and colleagues 2025, North Sea peat database, CC BY 4.0.
- Channels, lakes, marsh and peat: University of Bradford 2025, Digital Data from the Land Beneath the Sea Palaeolandscapes Project (Unpath’d Waters), Archaeology Data Service, CC BY 4.0.
- Ice margins: DATED-1, Hughes and colleagues 2016, “most credible” lines, CC BY 3.0.
- A second set of grids, compared and not used: BRITICE-CHRONO palaeotopographies, Clark and colleagues 2022.
- The end of Doggerland and the tsunami: Walker and colleagues 2020, Antiquity; Bondevik and colleagues 2012; Bondevik and colleagues 2005; Haflidason and colleagues 2005; Rydgren and Bondevik 2015; Gaffney and colleagues 2020; Gibbons and colleagues 2026.
- Britain’s separation: Sturt, Garrow and Bradley 2013; Weninger and colleagues 2008; Shennan and colleagues 2000; Hijma and Cohen 2010. Dogger Bank’s geology: Cotterill and colleagues 2017.
- The discovery: Reid 1913, Submerged Forests; Norfolk Historic Environment Record 11171; Godwin and Godwin 1933; Coles 1998; Gaffney, Thomson and Fitch 2007, Mapping Doggerland; Gaffney, Fitch and Smith 2009, Europe’s Lost World.
- People and finds: van der Plicht and colleagues 2016; Dekker and colleagues 2021; Amkreutz and Spithoven 2019; Hublin and colleagues 2009; Rijksmuseum van Oudheden; Moree and Sier 2015; Missiaen and colleagues 2021; Allaby and colleagues 2026; Amkreutz and van der Vaart-Verschoof 2022.
- Towns: GeoNames, places of 5,000 people or more, CC BY 4.0.