Chapter 1 · Maps and coordinatesLesson 1.1
Maps, plans and globes: scale, map projections and conventional symbols
Two paths climb to the same mountain hut. Before you set off, how can a map tell you which is longer and which is steeper?
Before you read: what do you think?
On the classroom world map, Greenland and Africa look almost the same size. How many times larger is Africa in reality?
See the answer
14 times as large. 14 times. Many world maps use a projection that enlarges areas more and more towards the poles, and Greenland is much closer to the pole than Africa.
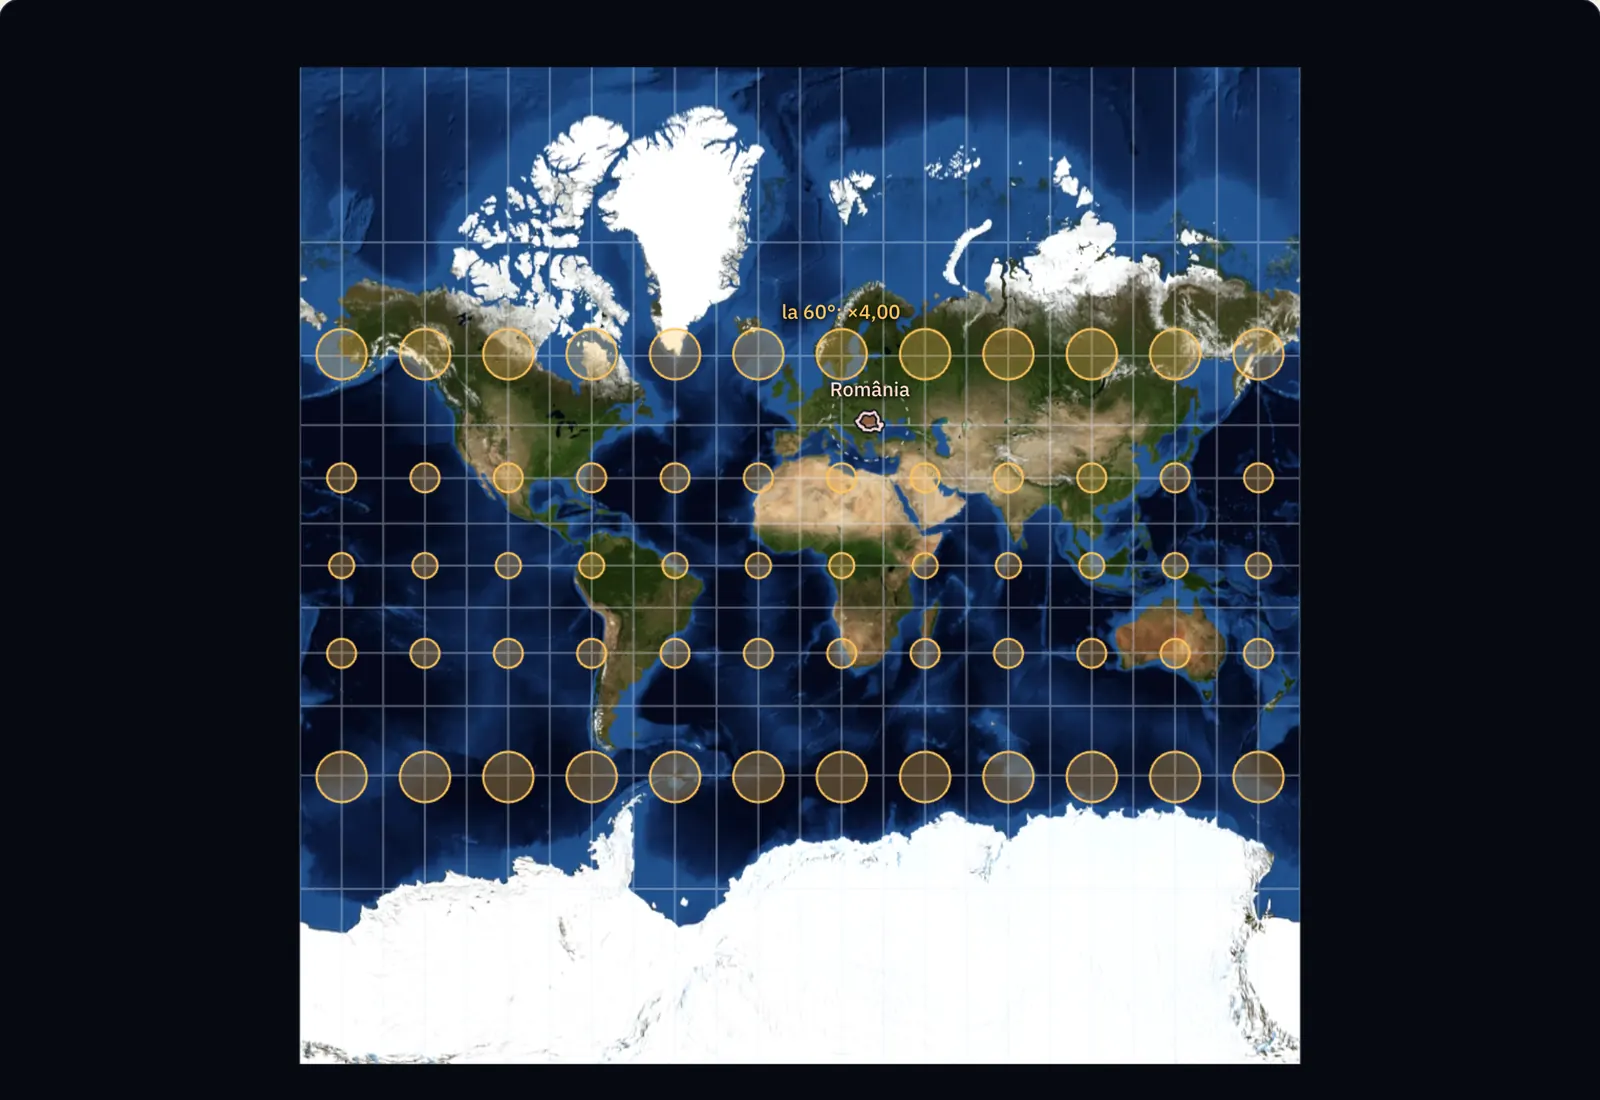
On many world maps, Greenland looks as large as Africa. In reality, Africa is 14 times larger. The difference comes from the way Earth’s curved surface has been transferred to paper, and every flat map has distortion of this kind.
A map answers questions before you set off
Spread a mountain walking map on the table. To find the length of each path, measure it with a ruler and multiply by the scale. The contour lines, the thin lines circling the mountain, show how steeply it climbs: a path that crosses them in quick succession is steep. Both readings depend on how a map is made.
A map is a reduced, conventional and generalised representation of Earth’s surface on a plane. Reduced means that distances on the ground have been made smaller by a factor shown by the scale. Conventional means that features are represented by symbols. Generalised means that the mapmaker has kept only what matters at that scale and left out the rest.
A globe retains the shape of Earth, and areas, shapes and distances remain in their true proportions on it. It is small, though, and cannot show details: a whole city fits into a dot. A plan represents a small area, such as a neighbourhood, a town or a building, in great detail. The area is so small that Earth’s curvature no longer matters.
Scale tells you how much the ground has been reduced
A numerical scale is a fraction. A scale of 1:25,000 means that one centimetre on the map represents 25,000 centimetres on the ground, or 250 m. A bar scale is a line divided into equal parts, marked with distances on the ground; you can read lengths directly from it with a ruler or a piece of paper. When a map is enlarged or reduced on screen, the bar scale changes size with it and remains correct.
The smaller the denominator of the fraction, the larger the scale. A scale of 1:25,000 is larger than 1:1,000,000 and shows more detail over a smaller area. Maps are classed by scale as large, medium or small scale; plans have still larger scales.
For the curious
The limits of the three groups: large-scale maps range from 1:20,000 to 1:200,000, medium-scale maps from 1:200,000 to 1:1,000,000, and small-scale maps have a denominator greater than 1,000,000. Plans have scales from 1:10,000 to 1:500.
| Latitude | Drawn area, simple cylindrical | Drawn area, Mercator | Drawn area, Equal Earth | Shape of a circle, Equal Earth |
|---|---|---|---|---|
| Equator, 0° | ×1.00 | ×1.00 | ×1.00 | 1.35 : 1 |
| 30° | ×1.15 | ×1.33 | ×1.00 | 1.17 : 1 |
| 45° | ×1.41 | ×2.00 | ×1.00 | 1.12 : 1 |
| 60° | ×2.00 | ×4.00 | ×1.00 | 1.70 : 1 |
| 70° | ×2.92 | ×8.55 | ×1.00 | 2.93 : 1 |
| 80° | ×5.76 | ×33.16 | ×1.00 | 9.38 : 1 |
The drawn area is compared with the area of the same circle at the Equator. In the Mercator projection, a small circle stays a circle at any latitude, and the map is cut at 85° north and south. Romania has 238,397 km² wherever it is moved; at 70° north latitude, Mercator draws it 8.72 times larger. Bucharest–New York: 7,650 km on the shortest route and 8,204 km on the straight line of the Mercator map.
Photograph and calculation. The surface is the NASA Blue Marble mosaic of June. The outlines of Romania, Greenland and Africa come from Natural Earth and are generalised. The place of each point on the map is calculated with the formulas of the projections, for a spherical Earth of radius 6,371 km; the real areas are the official ones.
A map projection transfers a curved surface onto paper
An orange peel cannot be spread flat on a table without tearing or wrinkling it. In the same way, Earth’s surface cannot be drawn on a plane without distortion. A map projection is the mathematical method used to transfer the grid of parallels and meridians from a globe onto a plane.
By the surface used for the transfer, projections are cylindrical, conic or azimuthal (on a plane). By what they preserve, they are conformal (preserving angles and, over small areas, shapes), equal-area (preserving areas) or equidistant (preserving distances in certain directions). No projection preserves all of them.
The Mercator projection, presented by Gerardus Mercator in 1569, is cylindrical and conformal and was designed for navigators. Its drawback is that areas grow larger and larger towards the poles, making Greenland look as large as Africa.
For the curious
Navigators favoured the Mercator projection because a route with a constant direction appears as a straight line on it.
Conventional symbols and the legend
Conventional symbols are the signs a map uses for features on the ground: dots for cities and peaks, lines for rivers, roads and borders, and coloured areas for forests and lakes. The legend explains each symbol. Start reading a map with its title, scale and legend.
Landforms are shown most precisely by contour lines, lines joining points at the same altitude. The difference in altitude between two neighbouring contours is called the contour interval and is the same across the whole map sheet. Where contours are close together, the slope is steep; where they are far apart, it is gentle.
By content, maps are general, showing landforms, water, settlements and roads together, or thematic, focusing on a single subject: climate, soils, population density or walking routes.
For the curious
Small-scale maps show landforms in colours: green for plains, yellow for hills and plateaus, and brown for mountains.
Worked example
Two paths on a 1:25,000 map
In an exercise, two paths leave the same village and reach the same mountain hut on a map at 1:25,000 with a contour interval of 5 m. Path A measures 6 cm on the map, and path B measures 10 cm. Each crosses 40 intervals between contour lines.
Length: one centimetre means 250 m, so path A is 6 × 250 = 1,500 m long and path B is 10 × 250 = 2,500 m. The change in altitude is the same: 40 × 5 = 200 m.
Slope: on path A you climb 200 m over 1,500 m, an average of 13 m for every 100 m of the route. On path B you climb 200 m over 2,500 m, or 8 m for every 100 m. Path A is shorter and steeper, and the contour lines are closer together along it on the map. The calculated lengths are horizontal distances; the distance walked is a little longer.
In Romania
The 1:25,000 topographic map and the Stereographic 1970 projection
Romanian topographic maps have fixed scales: 1:25,000, 1:50,000, 1:100,000, 1:200,000, 1:500,000 and 1:1,000,000. Each sheet has a name made up of letters and numbers, such as L-35-74-B-c for a sheet at 1:25,000. At this scale, four centimetres on the map mean one kilometre on the ground.
Romania’s official projection is called Stereographic 1970, or Stereo 70 for short. It is an azimuthal projection: the whole country is transferred onto a single plane that cuts through Earth’s surface. The centre of the projection is at 46° north latitude and 25° east longitude, north of the town of Făgăraș. On a circle with a radius of 201.7 km around this point, distances are not distorted at all. Cadastral plans, which record land and buildings throughout the country, are drawn up in this projection.
In brief
- A map is a reduced, conventional and generalised representation of Earth’s surface on a plane; a plan represents a small area at a large scale, with plenty of detail; a globe retains Earth’s shape.
- A numerical scale is a fraction (1:25,000 means 1 cm on the map for 250 m on the ground), while a bar scale is a line divided into equal parts and marked with distances on the ground.
- The smaller the denominator, the larger the scale: 1:25,000 is a larger scale than 1:1,000,000.
- A map projection transfers the grid of parallels and meridians from a globe onto a plane; projections are cylindrical, conic or azimuthal and preserve either angles (conformal), areas (equal-area) or certain distances (equidistant).
- Conventional symbols are explained in the legend; contour lines join points at the same altitude, and closely spaced contours show a steep slope.
- By scale, maps are large, medium or small scale; by content, they are general or thematic. Romania’s official projection is the Stereographic 1970 projection.
Common mistakes
WrongA scale of 1:1,000,000 is larger than 1:25,000 because a million is more than 25,000.
RightScale is a fraction, and 1/25,000 is larger than 1/1,000,000. A 1:25,000 map reduces the ground less and shows more detail.
WrongGreenland is as large as Africa: that is how it looks on the world map.
RightAfrica is 14 times larger. The Mercator projection enlarges areas more and more towards the poles; use a globe or an equal-area projection to compare areas.
WrongWhere contour lines are close together, the mountain is high.
RightClose contours show a steep slope, whatever the altitude. Read altitude from the values written on contours and from spot heights.
Test yourself
Six questions. For the first five you see the explanation at once, with the paragraph of the lesson that supports it; for the ones with a written answer you compare with a good answer.
On a map at 1:25,000, what distance on the ground corresponds to one centimetre?
Answer
b) 250 m. 1 cm × 25,000 = 25,000 cm = 250 m. Convert to metres after multiplying.
Which of these maps has the largest scale?
Answer
d) 1:25,000. Of four fractions with a numerator of 1, the one with the smallest denominator is largest.
On a 1:25,000 map, the distance between two springs is 4.8 cm. How many kilometres apart are they on the ground?
kmAnswer
1.2 km. 4.8 × 250 m = 1,200 m = 1.2 km.
On a hillside, contour lines are very close together. What does this show?
Answer
a) The slope is steep. The contour interval is the same across the sheet, so close contours mean the same change in altitude over a shorter horizontal distance.
Why does Greenland look as large as Africa on a Mercator projection map?
Answer
c) Because the projection enlarges areas more and more towards the poles. The Mercator projection preserves angles, but stretches areas more and more as latitude increases.
You photograph a walking map marked “1:50,000” with your phone, then enlarge the photo on screen. Can you still use the numerical scale to measure a route? What do you use instead, and why?
A good answer
The numerical scale is no longer valid because the enlarged image has different dimensions from the printed map: one centimetre on the screen no longer represents 500 m. The bar scale remains correct because its line has enlarged with the map. Measure the route by comparing it with that line.
A complete answer says that the fraction was valid only at the printed size and that the bar scale enlarges with the image.
Terms
- map
- A reduced, conventional and generalised representation of Earth’s surface or part of it on a plane.
- plan
- A large-scale representation of a small area (a town, neighbourhood or building), with plenty of detail.
- scale
- The ratio between a distance on a map and the corresponding distance on the ground; it can be numerical (a fraction) or a bar scale (a graduated line).
- map projection
- A mathematical method for transferring the grid of parallels and meridians from a globe onto a plane.
- conventional symbols
- The symbols a map uses for features on the ground; they are explained in the legend.
- contour line
- A line on a map joining points at the same altitude.
- contour interval
- The difference in altitude between two neighbouring contour lines, the same across the whole map sheet.
Sources and link to the programme
- Wikipedia (ro) – Hartă – classification of maps by scale (large, medium, small) and content (general, thematic)
- Wikipedia (ro) – Hartă topografică – basic scales of Romanian topographic maps, sheet naming (L-35-74-B-c), scales of topographic plans (1:500–1:10,000)
- Wikipedia (ro) – Proiecția Stereografică 1970 – Romania’s official projection, single intersecting plane, centre at 46° N and 25° E north of Făgăraș, circle of zero distortion with a radius of 201.7 km, use in cadastral mapping
- EPSG.io – EPSG:3844, Pulkovo 1942(58) / Stereo70 – Stereo 70 as a coordinate system for Romania
- Wikipedia (en) – Mercator projection – Mercator 1569, conformal cylindrical projection, straight lines of constant direction, Africa 14 times larger than Greenland
- USGS – Map Projections: A Working Manual (Snyder, 1987) – conformal projections preserve angles and shapes only locally; scale varies across the map
From the programme: “Representation of geographical space. Using maps and other cartographic representations” (common core). Programme competences covered: 1.1, 2.4, 4.5.