
Loading the sheet…
Map: Source gallica.bnf.fr / BnF
Principatus Moldaviae · engraved in Holland, 1737
How well did a prince in exile know his country?
Dimitrie Cantemir, prince of Moldavia (a principality whose land is now in Romania, the Republic of Moldova and Ukraine), drew a map of his country in Russia after he had lost his throne. It names 785 towns, monasteries and villages. 269 have been identified and set here beside their true places: how far off each one is, which way, and what the too-wide shape of the country can and cannot be put down to.
July 1711
The map marks the place where he lost his throne#
Near the town of Huși, on the bank of the river Prut, the engraver put a cross-shaped fort and one line of text: Hic Russi pugnarunt cum Turcis A° 1711, “here the Russians fought the Turks in the year 1711”.
Dimitrie Cantemir was then prince of Moldavia, a principality between the Carpathians and the river Dniester that paid tribute to the Ottoman sultan; today its land is shared by Romania, the Republic of Moldova and Ukraine. He had sided with Peter, the tsar of Russia. After their defeat at Stănilești he left with the Russian army and never came back. He drew the map in Russia in the years that followed, with the book in which he describes his country, Descriptio Moldaviae, requested by the Berlin Academy. Cantemir the man has a page of his own.
What is on the sheet
785 named places, from the capital to the last village#
785towns, monasteries and villages read off the sheet, plus 99 river namesA small circle is a village. A tower is a market town. A building with a cross is a monastery. Around Iași, the capital, the sheet names Galata, Cetățuia, Bârnova, Socola, Copou, in Latin letters spelled the Polish way, with cz for “ch” and sz for “sh”: Czetezuia, Husz, Suczava.
Every name was read from the scan of the Bibliothèque nationale de France, with the position of its sign measured in pixels.
What Europe had before
On a French academician’s map, Moldavia was almost empty#
Guillaume de l’Isle, geographer of the Academy of Sciences in Paris, printed a map of Hungary and its neighbours in 1703. His Moldavia has a few dozen names, Iași sits beside the Prut, and the word Deserts is written twice across the country.
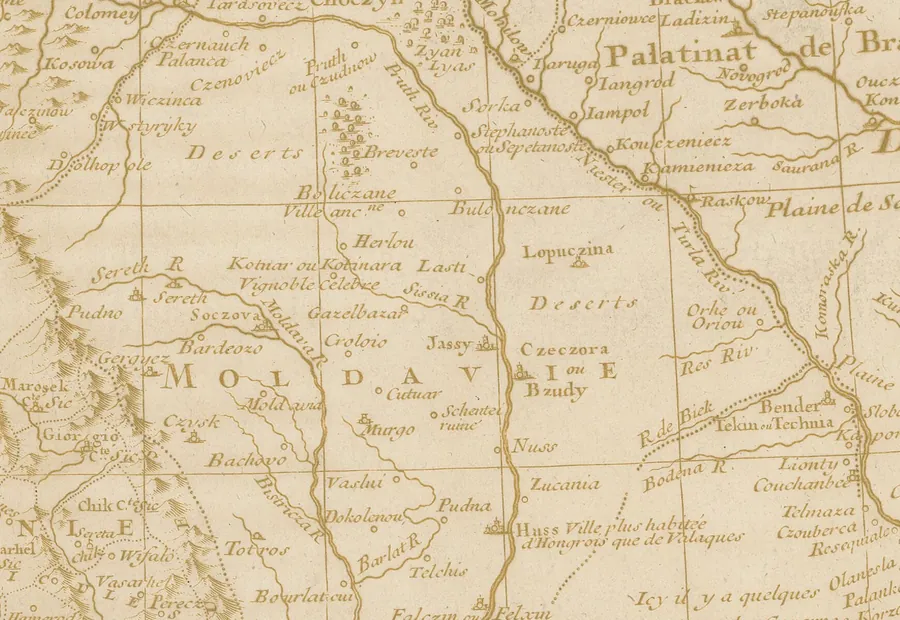
Guillaume de l’Isle, Carte de la Hongrie, Paris, 1703 (detail). Source gallica.bnf.fr / BnF. De l’Isle’s sheet is drawn at about half Cantemir’s scale and covers Hungary and its neighbours, so a few dozen names is not a verdict on him. Cantemir put 785 places on the same region. The question is how accurately he placed them.
The test
The sheet laid on the ground without stretching it#
In blue are today’s waters: the rivers Siret, Prut, Dniester and Danube, and the Black Sea shore. The sheet has been turned, scaled and shifted until the 72 towns and monasteries that can be recognised by name and by the kind of sign came as close as possible to their real places. The sheet was neither stretched nor bent.
The sheet’s north is turned 8 degrees from true north. And the engraved rivers do not lie on the real ones: Cantemir’s Prut runs almost due south, the real Prut bears south-east.
How far off
Half the towns and monasteries fall within 21.5 km of their place#
21.5 kmhalf of the 72 towns and monasteries are closer than this, sheet unstretchedEach red dot is the true place of a town or monastery. The line ties it to its engraved sign. 41 of the 72 are within 25 km; 15 are more than 50 km off.
The lines do not point at random. In the north most point west; in the south, south and south-east; in the mountains, east. An error with a direction belongs to the shape of the whole country, not to each place.
What he actually knew
Against its neighbours, a town is displaced by about 8 km#
7.8 kmhalf the towns are displaced against their neighbours by less than thisThe lines are short in the middle of the sheet and long at its edges. That says little about Cantemir: any map drawn too wide looks like this once its centre is set in place. Roman is 4.4 km out, Iași 7.9 km, and Hotin, a fortress on the Dniester in the far north, 70 km.
A better measure: each town is left out in turn and its place predicted from the towns that remain. Counted so, the displacement is 7.4 km in the middle of the country, 6.1 km in the mountains and 9.9 km in the districts between the Prut and the Dniester. In the north, where only three places are certain, it is 18.3 km; for Hotin itself, 12.5 km.
The shape of the country
His Moldavia is one and a half times as wide as it should be for its length#
×1.58how much too wide the country is for its length, measured on 72 towns and monasteriesScroll and the sheet stretches like cloth until the recognised places come close to their red dots. It lengthens from north-west to south-east and hardly moves across. The stretch on screen corrects each region separately. Separately, a single stretch of the whole sheet, the same everywhere, gives the ratio ×1.58. It summarises the whole sheet and is not the same in every region: refitting with one region left out at a time gives between ×1.46 and ×1.92.
George Vâlsan, the Romanian geographer who found the map, wrote in 1926 that “the shape of the country is exaggeratedly wide”. Measured: for equal distances on the ground, the sheet shows 1.58 times as much across Moldavia as along it (between 1.42 and 1.85, depending on which towns are used).
Where the width comes from
Part of it belongs to the frame of degrees, not to the drawing#
×1.22the ratio the sheet’s frame of degrees gives by itselfDegrees are engraved on the sheet’s border. A degree of longitude is drawn 0.78 times the length of a degree of latitude at the top and 0.90 times at the bottom. At Moldavia’s latitude it should be 0.68. The degrees of longitude are drawn too long, then: a true grid of points put through the sheet’s frame comes out too wide by a ratio of about 1.22.
There is something in the drawing too. Read by the degrees on the border, the 72 places are still spread too wide, by a ratio of 1.30 (between 1.19 and 1.45): the north of the country is pushed east. These ratios come from separate measurements; their product need not equal the overall ratio. The direction along which the country is shortened lies 150°–164° from north. That is close to the sheet’s own vertical (164°), and also to the course of the Prut (162°) and the Siret (153°); the measurement cannot tell these apart.
The test that spoils the story
A French map of 1703 is as wide on the same towns#
×1.32the width ratio of de l’Isle’s map on the 23 towns it shares with Cantemir’s sheet; on Cantemir’s sheet, the same towns: ×1.34It is easy to believe the width is Cantemir’s own: a country remembered wider than it was by a man who had left it. That can be tested. On de l’Isle’s map 23 towns in and around Moldavia can be recognised that are also on Cantemir’s sheet. Fitted the same way, with one even stretch and no town counted for less, the French map draws Moldavia 1.32 times as wide as it should be for its length (between 1.10 and 1.82), and Cantemir’s sheet 1.34 times (between 1.13 and 1.62). The idea that the width is Cantemir’s alone does not survive: a Moldavia drawn too wide was on paper before him.
Three limits. First, the test does not show that he copied the French map, or that the two share a cause; only that the same widening is on the earlier sheet. Second, on Cantemir’s own sheet these 23 towns give a lower ratio than the rest: the other 49 certain places give ×1.58, these 23 give ×1.34, and a random set of 23 of the 72 would give as low a ratio in only 6% of draws. The test is therefore gentler than the whole sheet. Third, a ratio taken from 23 towns is pushed up by scatter alone: in a simulation with independent random scatter of the size seen here, towns drawn with no widening at all would give a median of ×1.08 on Cantemir’s sheet and ×1.13 on the French one. The direction of the stretch is only loosely given by 23 towns: about 168° on Cantemir’s sheet (between 155° and 2°, through north) and 155° on de l’Isle’s (between 120° and 4°), against 157° for the whole sheet.
Read by each sheet’s own printed degrees, the same towns give ×1.10 on Cantemir’s sheet (between 1.02 and 1.34) and ×1.37 on de l’Isle’s (between 1.14 and 1.88). The ranges overlap; the estimate for Cantemir is the lower. On de l’Isle’s sheet the degrees are drawn close to the ratio expected at Moldavia’s latitude (0.66 against 0.68), so the widening is in the towns. On Cantemir’s it is largely in the frame.
What he brought
On the towns both maps show, Cantemir’s sit twice as near in kilometres, and about as near on paper#
16 kmmedian error of Cantemir’s towns on the 23 shared towns, each left out in turn and predicted from the others; de l’Isle’s, on the same towns: 34 kmThe same 23 towns, the same plain fit with one even stretch, each town left out in turn and predicted from the others. The median error is 16 km on Cantemir’s sheet and 34 km on de l’Isle’s. Fitted on all 23 at once, it is 13 km against 31 km. Cantemir’s sign is nearer the true place for 19 of the 23 towns. The two medians differ by 18 km. Resampling the towns’ errors gives a 95% range of 7 to 31 km; refitting on each resample and predicting the towns left out widens it to 2 to 38 km, and resampling four regions as blocks gives 7 to 26 km. Read by each sheet’s own degrees, the conclusion is the same.
Scale changes what this means. The sheets are drawn at different scales: about 1:1,300,000 for Cantemir (BnF record; 8.4 cm to a degree of latitude on the sheet) and about 1:2,550,000 for de l’Isle, whose map covers Hungary and its neighbours. In millimetres on the printed sheets the median errors are 12.2 mm and 13.3 mm; the difference is 1.1 mm, with a 95% range from -7.2 to 6.4 mm, and Cantemir’s sign is the nearer on paper for 11 of the 23 towns. So the gain in kilometres goes with the larger scale. It shows that his towns sit nearer their true places in kilometres, not that his geographical knowledge was twice as exact; the sheets also differ in what they were made to show and in the sources open to each. De l’Isle’s scale is taken from the bar on his sheet and is only roughly known.
How far this can be trusted. Dropping the three towns where the gap is widest and fitting again on the remaining 20 gives medians of 16 km against 23 km: the gap narrows, it does not close. Holding out one region at a time and predicting it from the rest (the regions overlap), Cantemir’s towns are nearer in 4 of 5 regions with a plain turn and scale, and in 4 of 5 with one even stretch. The south, towards the Danube, depends on the fit: level with one even stretch (33 km against 33 km), nearer for Cantemir with a plain turn and scale (34 km against 47 km). And the pairing of the 23 towns rests on one reading of six pieces of the French sheet. The result is clearest for the middle and the north of the country.
Three things are therefore kept apart. Measured: the sheet is ×1.58 too wide, as drawn. What belongs to the sheet: fitted separately, its frame of degrees alone gives ×1.22 and the 72 places read through those degrees give ×1.30; these are not an exact split of ×1.58. On the 23 shared towns the estimate by printed degrees is higher for de l’Isle’s sheet (×1.37) than for Cantemir’s (×1.10), with overlapping ranges. Distinctive of Cantemir: the 269 places set around the towns, at twice the scale of the French sheet. His towns sit nearer in kilometres than de l’Isle’s, but about as near on paper; the width is not his alone.
The degrees on the border
The latitudes are good. The longitudes are those of his time#
20 kmroot-mean-square error of the latitude read from the sheet’s border, after the common shift is removedThe dotted lines are the true parallels. Cantemir’s latitudes are, at the median, 0.29 of a degree too far south. Once that shift is removed, an error of about 20 km remains, varying from place to place.
The longitudes are counted from Ferro in the Canary Islands, the usual zero for longitude at the time. They put Moldavia 4.6 degrees farther east than it is; Vâlsan had written “more than four degrees”. Longitude was the weak side of maps made before precise clocks.
The villages
A village is harder to recognise than a town#
269 of 785places identified; 96 possible; 420 without a matchMany village names repeat: Moldavia has several villages called Popești and several called Bălțați. A name on the map was accepted in two cases only: when a single place in all of historical Moldavia bears that name today (63 villages), or when a place of the same name lies within 12 km of the point where the places already identified around it say the sign should be (134 villages).
The second rule was put to a test: with the expected point of every sign moved 80 km in a random direction it still finds 9 matches instead of 134, about 7% as many. Some of these identifications may therefore be mere coincidences of name. None of them enters the numbers on the shape of the country. And of the 86 villages with a unique name, 43 fall within 15 km of the spot predicted from the towns alone; 28 are more than 50 km away. Of the 86, 23 were set aside as probable namesakes.
Where the map is weakest
The mouths of the Danube and of the Dniester: displaced even against their neighbours#
Chilia, a port on the northern arm of the Danube delta, is 99 km from its place on the unstretched sheet and still 46 km out when measured against its neighbours. Cetatea Albă, the fortress at the mouth of the Dniester: 75 km and 32 km. Among the certain places inside Moldavia, no other is displaced by more than 30 km against its neighbours.
The south between the Prut and the Dniester had not been Moldavian for a long time: the forts were Turkish and the plain, the Bugeac, was held by Tatars. The sheet has few villages here and much empty paper.
The engraver
The hand-drawn copy has the same shape#
1.2 kmmedian difference between the printed sheet and the hand-drawn copy, on 100 placesCantemir’s manuscript has not been found. There is, however, a hand-drawn copy, larger than the printed sheet, made by the geographer Jean-Baptiste d’Anville, who wrote in 1759 that Cantemir’s son Antioh, while Russian ambassador in Paris (1738–1744), had allowed him “to copy in full” the map his father had drawn.
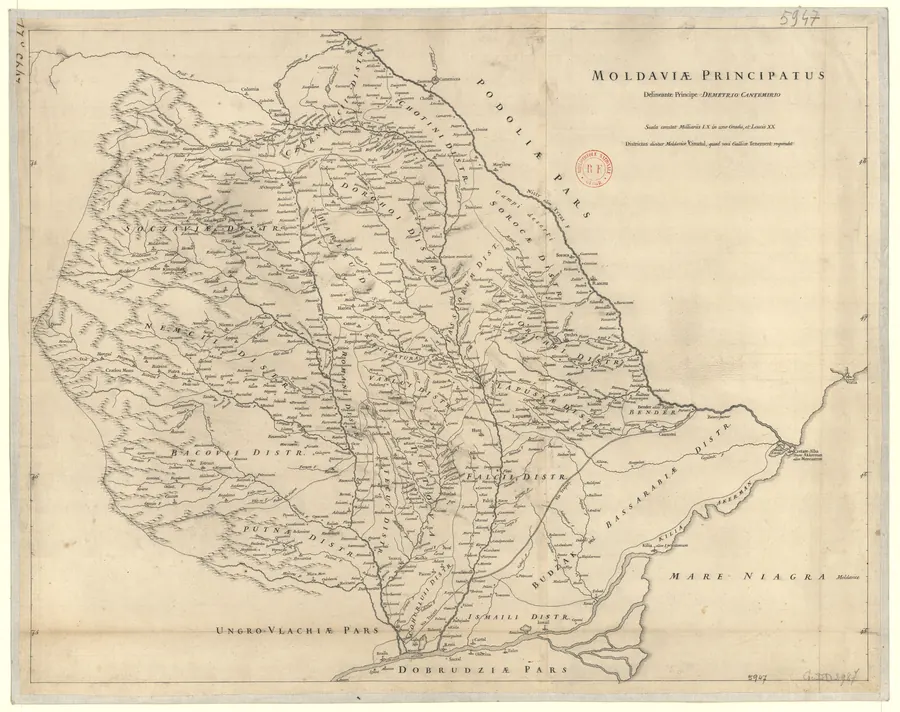
D’Anville’s hand-drawn copy. Source gallica.bnf.fr / BnF. On 100 towns and monasteries read separately on the two sheets, a plain enlargement lays one over the other: for half the places the two signs come within 1.2 km of each other, and the ratio of length to width differs by 1.8%. The too-wide shape is in both.
What that settles is limited. If d’Anville copied the manuscript, the width was already there before the engraver. But he is the only witness to what he copied, and Alexandrescu (2011) keeps the view that he worked from the manuscript while calling the proof thin; if he copied the print, the agreement is expected and says nothing about the engraver. The copy shows that the two sheets share a model, not which model.
A second control concerns the paper and the scan, not the engraving: the BnF holds two impressions of the same plate. Laid directly over each other by image matching (75 points, spread over about two thirds of the sheet’s width and three quarters of its height; no model read anything), they differ by 0.6 km at the median after a turn and a scale, and the ratio between their axes is 1.00. Matches were accepted within 1.8 km of the best turn and scale; allowing up to 14 km adds only five more points, which gives no sign of a larger deformation among the points added. A deformation shared by both impressions would not show. Paper or scan differences between these two impressions cannot explain errors of 20–30 km, or a ratio of ×1.5.
Where the picture can mislead
What this measurement cannot say#
A village of today does not have to stand where it stood in 1716: many moved, and the coordinate used is the centre of the present settlement. Reading the names has an error too: in a second, independent reading of part of the sheet, 82% of the names came out the same letter for letter, and for 3.1% the sign was placed more than 4 km from its position in the first reading.
The red line of any one village therefore says “about this far, about that way”. The shape of the whole country is computed on 72 towns and monasteries recognised by name and by the kind of sign.
Is your place on Cantemir’s map?
Type today’s name of a town or village of historical Moldavia: in Romania, the Republic of Moldova or Ukraine (northern Bukovina, the Hotin area and the Bugeac plain).
The list contains 6,816 present-day settlements. Those recognised on the map come first.
Drag the map with the mouse or move it with the buttons.
How it was measured
The sheet measured is BnF GE AF PF-41 (134), from the royal collections: a note on the back says Count de Thoms gave it to the King’s Library in 1744, “qui l’a fait graver en Hollande” (“who had it engraved in Holland”). The BnF record gives “[En Hollande], [1737]”, and Alexandrescu (2011) notes a pencil grid of 0.5 cm squares on the sheet. The map survives in at least seven printed impressions of one plate: London (British Library), Dublin, Berlin, Harvard, Vincennes and two at the BnF.
The other BnF sheet, GE KLAPROTH-953 (BnF record), is the one Vâlsan found in 1923; its place and year were scraped off. Vâlsan took it to be Joseph-Nicolas Delisle’s own copy. Alexandrescu (2011) and Cristina Ion (2023) show there is no evidence of that: it came into the BnF with the Klaproth collection in 1831–1832. Ion also found an impression at Vincennes, which bears “Amsterdam, chez François Changuion, 1737”. The measured sheet and the Klaproth impression are from the same plate; the Vincennes one is not part of the measurement. Amsterdam and Changuion are therefore not in the record of the measured sheet: they come from the other impressions.
Reading
The scan is 11,255 pixels wide; at the scale of the sheet laid on the ground, one pixel is about 71.9 m. The sheet was cut into 63 pieces with a ruled grid, and every name was transcribed letter by letter with the position of its sign. The reading was done by an artificial-intelligence model (Claude) and spot-checked. Eight of the 63 pieces were read a second time, separately: of 423 signs found by both readings, 82% have the same name letter for letter, and for 3.1% the sign was placed more than 60 pixels (about 4 km) from its position in the first reading. That measures how repeatable the reading is, not how correct it is: names that differ were not checked against the sheet, and eight pieces are too few to state an accuracy for the whole. The pieces not read twice, the densest and the least legible above all, have not been checked this way. A wrong letter does not move a sign, but it can leave a village without a match; a name that is not found does not show that the place is missing from the sheet.
Identification
Today’s places come from GeoNames. There are four grades, kept apart throughout. Certain: 72 towns, forts and monasteries recognised one by one, by name and by the kind of sign; the numbers on the shape of the country rest on these alone. By name: 63 villages whose name, reduced to a common spelling (cz = c, sz = sh, w = v, y = i), occurs once in historical Moldavia. Another 23 unique names were rejected because today’s village of that name lies tens of kilometres from anywhere the sheet could put it: probably vanished namesakes. By name and neighbourhood: 134 villages, accepted when the places already identified around them (the towns and the unique-name villages) put the sign within 12 km of a village of the same name. They are chosen with a prediction made from those places and do not enter it, so they do not validate themselves; but they say nothing about how good the prediction is. Possible: 96 matches lying 12–50 km from the expected spot; they are not drawn.
Three measures of error
Sheet unstretched: a turn, a scale and a shift, fitted on the 72 certain places; this error grows with distance from the centre of the sheet, because the map is too wide. With one even stretch: the sheet may also be stretched the same everywhere, along one direction. Against neighbours: each town is left out in turn and predicted from the others with a smooth surface; what remains is the error after allowing for the distortion of its region. The range of the width-to-length ratio comes from 1,000 repeats of the calculation, each on towns drawn at random from the 72.
The tests
Villages with a unique name were not used in the fit. For all 86 of them, positions predicted from the towns alone have a median error of 15.9 km; 43 are within 15 km of today’s village and 28 are more than 50 km away. The “name and neighbourhood” rule was run again with the expected point of every sign moved 80 km in a random direction: it still found 9 matches against 134. D’Anville’s copy and de l’Isle’s map were read the same way, separately. At every release the numbers are recomputed from the files the map is drawn from. The checks of 11 October 2026, made after a review, are in the sections that follow.
| What | How much |
|---|---|
| Named places read on the sheet | 785 |
| River names | 99 |
| Towns, forts and monasteries identified with certainty | 72 |
| Villages identified by a unique name | 63 |
| Villages identified by name and neighbourhood | 134 |
| Matches that are only possible | 96 |
| Names left without a match | 420 |
| Median error (half the places have a smaller error), sheet unstretched | 21.5 km |
| Median error after one even stretch of the sheet | 14.7 km |
| Median error against neighbours (each town predicted from the others) | 7.8 km |
| Villages with a unique name, predicted from the towns alone (all, median) | 15.9 km |
| Ratio given by the frame of degrees alone | ×1.22 |
| Ratio of the 72 places read by the sheet’s own degrees | ×1.30 (1.19–1.45) |
| How much too wide the country is for its length | ×1.58 (1.42–1.85) |
| Direction along which the country is shortened, from north | 157° (150°–164°) |
| Turn of the sheet from true north | 8° |
| One pixel of the scan, on the ground | 71.9 m |
The best and the worst placed towns
With the sheet unstretched, among the 72 certain places.
| On the map | Today | Error |
|---|---|---|
| “Roman” | Roman | 4.4 km |
| “Solca” | Solca | 4.6 km |
| “Suczava” | Suceava | 6.5 km |
| “IASSI” | Iași | 7.9 km |
| “Dragomirna” | Mitocu Dragomirnei | 9.3 km |
| “Orchei” | Orhei | 11.2 km |
| “Mira mon.” | Mera | 11.4 km |
| “Slatina” | Slatina | 11.6 km |
| “Kilia olim Lycostomon” | Chilia (Kiliia) | 98.6 km |
| “Vozia” | Ochakiv | 97.2 km |
| “Czetate Alba nunc Akkerman olim Moncastron” | Cetatea Albă (Bilhorod-Dnistrovskyi) | 75.0 km |
| “Chotin” | Hotin (Khotyn) | 69.9 km |
| “Cernaucii” | Cernăuți (Chernivtsi) | 68.4 km |
| “Caszin” | Cașin | 67.0 km |
| “Colomia” | Kolomyia | 66.9 km |
| “Zuaneze” | Zhvanets | 65.3 km |
Checks on the findings
After a review, the comparison with de l’Isle’s map was redone with the same plain fits, with no down-weighting, on the same 23 towns for both maps. “Pixels” means positions on the sheet; “printed degrees” means each place read through its own sheet’s degrees (for Cantemir the border scales; for de l’Isle his four meridians and four parallels, spacing taken as one degree). A ratio here is the largest scale of the fitted stretch over the smallest: it says how unequal the two perpendicular directions are, and the direction, when it can be given, says which is the longer. A ratio taken from a small sample is pushed up by scatter; the last rows give the median ratio that a simulation with no widening, but with scatter of the size seen, would show.
| What | How | Ratio |
|---|---|---|
| Whole sheet, 72 places | positions in sheet pixels; the fit counts far-off places for less | ×1.58 (1.42–1.85) |
| Whole sheet, 72 places | same, every place counted equally | ×1.51 (1.37–1.72) |
| The frame alone | a true grid of points put through the printed border scales; no places | ×1.22 |
| Whole sheet, 72 places | each place read through the printed degrees | ×1.30 (1.19–1.45) |
| The 49 places not on de l’Isle’s map | pixels / printed degrees, plain fits | ×1.58 / ×1.40 |
| The 23 shared towns, Cantemir | pixels | ×1.34 (1.13–1.62) |
| The 23 shared towns, Cantemir | printed degrees | ×1.10 (1.02–1.34) |
| The 23 shared towns, de l’Isle | pixels | ×1.32 (1.10–1.82) |
| The 23 shared towns, de l’Isle | printed degrees | ×1.37 (1.14–1.88) |
| No widening, same scatter as the 23 towns | simulated, pixels: Cantemir / de l’Isle | ×1.08 / ×1.13 |
| No widening, same scatter as the 72 places | simulated, pixels / printed degrees | ×1.06 / ×1.05 |
Longitude is measured with a free shift, so the choice of zero meridian (Ferro, 17°39′46″ west of Greenwich according to DVW, 17°40′ in the Library of Congress guide) cannot move any ratio or error; it enters only the figure of 4.6 degrees. Ground distances use the true cosine of latitude, through a transverse Mercator projection.
The 23 shared towns, error by error
Median error in km, on the same towns and with the same fit for both maps. The last column leaves each town out in turn and predicts it from the others.
| Sheet and reading | Turn and scale | One even stretch | Stretch, town left out |
|---|---|---|---|
| Cantemir, pixels | 19 km | 13 km | 16 km |
| Cantemir, printed degrees | 14 km | 13 km | 16 km |
| de l’Isle, pixels | 29 km | 31 km | 34 km |
| de l’Isle, printed degrees | 29 km | 31 km | 34 km |
| Gap (de l’Isle − Cantemir), pixels | 10 km | 18 km | 18 km |
| Gap, 95% range, towns’ errors resampled | 5–21 km | 7–24 km | 7–31 km |
The gap does not depend on how the sheets are read. It stays, and narrows, when the towns with the widest gap are dropped in turn (see the chapter). The French sheet’s towns come from a single pass over six pieces.
Regions held out in turn
Each region is predicted from the rest of the shared towns. The regions overlap in part (north–middle–south and west–east are two divisions).
| Region held out | Towns | Cantemir, turn and scale | de l’Isle, turn and scale | Cantemir, one stretch | de l’Isle, one stretch |
|---|---|---|---|---|---|
| North (above 47.5° N) | 6 | 37 km | 60 km | 29 km | 56 km |
| Middle (46.5°–47.5° N) | 8 | 12 km | 25 km | 11 km | 23 km |
| South (below 46.5° N) | 9 | 34 km | 47 km | 33 km | 33 km |
| West (below 27.4° E) | 10 | 31 km | 27 km | 19 km | 55 km |
| East (from 27.4° E) | 13 | 30 km | 35 km | 36 km | 62 km |
Estimates for regions outside the area used in the fit are less certain, so the small regions (the north holds 6 towns) must be read with care.
What was known and what the measurement adds
The Romanian geographer George Vâlsan found the map in Paris in 1923 and described it in 1926 (paper read to the Romanian Academy, 1924). He counted “nearly 800 names”, noted that the map puts Moldavia “more than four degrees” too far east, and wrote that “the shape of the country is exaggeratedly wide, above all between the Siret and the Transylvanian border”. He also wrote that such a map “cannot be made from a distance and from mere memories”: Cantemir must have gathered material before 1711. In 1928 P. P. Panaitescu compared the printed sheet with d’Anville’s copy; according to Alexandrescu’s summary (Panaitescu’s article could not be seen in the original), every name on the Amsterdam sheet is found on the copy. In 2011 Vlad Alexandrescu rebuilt the history of the surviving impressions, and in 2023 Cristina Ion traced the origin of Vâlsan’s confusion about the Klaproth impression and described a new one, at Vincennes.
In the works named here the places on the map are not set one by one beside their coordinates; this page does that for 269 places. The literature on the map is wider than what was read here (Romanian, French, Russian), and the page does not claim that nobody has made a comparable measurement. What it adds: the error of each place, the size and direction of the widening Vâlsan had seen by eye, the fact that it is in the hand-drawn copy too, how much of it belongs to the frame of degrees, the fact that de l’Isle’s map of 1703 is as wide on the same towns, and the fact that Cantemir’s towns sit nearer in kilometres on them (and about as near on paper, at twice the scale). Panaitescu suspected that, besides his own notes, Cantemir worked with older maps; the measurement does not prove that, nor does it contradict it.
At one point the measurement and the literature can be set side by side: Vâlsan held that Cantemir’s Moldavia is longer in latitude than the real one, by about 20 km to the north and 40 km to the south. Worked out on the towns, latitude on the map rises 1.05 times as fast as true latitude: the same direction, a small difference. The frame of degrees, not the drawing, was measured by Alexandrescu at 8.3 cm for a degree of latitude and 7.5 cm for one of longitude.
Sources
- Dimitrie Cantemir, Principatus Moldaviae nova & accurata descriptio, [Amsterdam, 1737]. Bibliothèque nationale de France, GE AF PF-41 (134). Source gallica.bnf.fr / BnF. A work in the public domain; non-commercial reuse is free with the source credit, under Gallica’s terms. Scan taken through Wikimedia Commons. Every detail on the page and in the pictures to send comes from this scan.
- Jean-Baptiste Bourguignon d’Anville’s hand-drawn copy, Moldaviae principatus delineante principe Demetrio Cantemirio. BnF, GE DD-2987 (5947 B). Source gallica.bnf.fr / BnF; catalogue record.
- Guillaume de l’Isle, Carte de la Hongrie et des pays qui en dépendoient autrefois, Paris, 1703. Source gallica.bnf.fr / BnF.
- George Vâlsan, “Harta Moldovei de Dimitrie Cantemir”, Romanian Academy, Memoriile Secțiunii Istorice, series III, 1926 (in Romanian). Scanned offprint, Culturalia/Europeana. Quotations checked against the scanned pages (pp. 198–204).
- P. P. Panaitescu, “Contribuții la opera geografică a lui D. Cantemir”, Romanian Academy, Memoriile Secțiunii Istorice, series III, vol. VIII, 1928, pp. 175–188 (in Romanian); cited through Alexandrescu’s summary, as no original scan could be found.
- Vlad Alexandrescu, “Autour de la carte de la Moldavie par Démètre Cantemir”, Revue des Études Sud-Est Européennes, XLIX, 2011, pp. 139–188 (in French). Text.
- Cristina Ion, “Harta Moldovei de Dimitrie Cantemir: un exemplar inedit”, Observator cultural, no. 1187, 8 December 2023 (in Romanian). Text.
- BnF, conditions for AI processing of documents and data: BnF page (read 11 October 2026).
- Ioana Feodorov, “Dimitrie Cantemir”, Encyclopaedia of Islam, THREE, 2012 (biographical dates). Preprint.
- Today’s coordinates: GeoNames (CC BY 4.0), RO, MD and UA dumps downloaded 10 October 2026; filtered to populated places plus monasteries, churches, ruins and forts inside 44.8–49.3° N, 24.3–32.2° E; names reduced to a common spelling for matching; coordinates unchanged. Rivers and coast: Natural Earth 1:10m (public domain), downloaded 10 October 2026.
- The Ferro meridian, 17°39′46″ west of Greenwich: DVW Hessen, 2018.