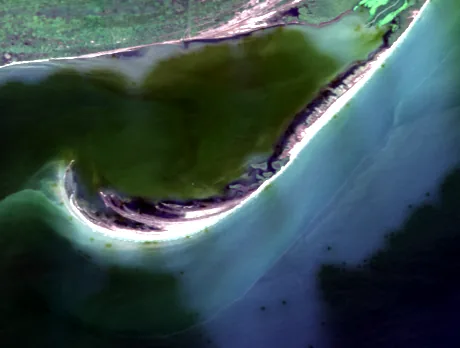
Lagoon on the left, sea on the right. White line: the water of the chosen summer. Gold: the welding. White: the tip.
Sfântu Gheorghe mouth · Danube Delta
Sacalin Island between river and sea: what 41 summers of satellite images show
From summer 1984 to summer 2025 the island's tip (the pixel selected as such in the Landsat frames) moved from 6.99 to 10.74 km away from a fixed point. The tip pixels of the two summers are 4.37 km apart, mostly westward. Each value is one day's waterline, not the island's annual path.
Measure two yearsor scroll the summers, from 1984 to 20252025
Three numbers, 41 summers
Sacalin Island lies at the mouth of the Sfântu Gheorghe arm, between the lagoon and the Black Sea. The series tracks three values in summer frames: land detected inside a fixed window, the distance from a fixed point to the pixel selected as the tip, and that pixel's coordinates.
The frame above shows the summer of 2025. Its white outline is the waterline extracted from that image; markers show the fixed origin and selected tip pixel. One frame captures one summer day. Water level, wind and pixel resolution can affect the outline read from it.
With the origin held fixed, the distance to the selected tip pixel increases from 6.99 km in 1984 to 10.74 km in 2025. The pixels selected in those two summers are 4.37 km apart. Area calculated inside the same window is 337 ha in 1984 and 516 ha in 2025. The table shows every intervening value.
The series uses 41 summer Landsat frames from 1984 to 2025; 2012 is missing (Landsat 5 had stopped routine imaging and Landsat 7 is excluded). These calculated values are separate from published historical measurements, which use different methods and extents.
1984
How it formed
Gâștescu (2021) dates Sacalin Island's formation to 1897, after a flood on the Sfântu Gheorghe arm. That date does not mean the island already had its present shape. Giosan and colleagues (2005), citing Antipa (1915), report that the bar had emerged as a barrier island by 1909.
Giosan and colleagues describe sediment moving south-west along the shore. Their study gives more than 200 m/year for the subaqueous lobe after the island appeared and less than 100 m/year before; these figures describe underwater landforms, not the island. The same study cites island lengthening of more than 100 m/year, attributed to Giosan (1998) and Vespremeanu et al. (2004). It does not specify the exact protocol or period for that estimate.
Giosan and colleagues write that the barrier had doubled in length by 1935. Gâștescu gives a length of 17 km for 1995; an encyclopedia consulted later lists 19 km without a year or method. There is no shared protocol here that makes those values directly comparable. The satellite series measures something else: the straight-line distance from the fixed origin to the selected tip pixel, 8.42 km in 1995; it does not estimate the shoreline's curved length.
1990
Joining the mainland
Giosan and colleagues (2005) place the joining of the northern end to the mainland in three ways: in the 1970s, in the late 1970s and in the early 1980s. The source does not settle on one year, so the interval remains uncertain.
The origin used in this calculation is a point fixed for this analysis; it does not prove that the whole northern end stayed still. For each year, the algorithm selects the land pixel farthest from that point. The chord is the distance between the two points; it does not measure movement along every part of the shore.
Giosan and colleagues connect changes at the Sfântu Gheorghe mouth with reduced sediment supply associated with dams on the lower Danube. Their explanation concerns the river mouth as a whole; this series cannot determine the dams' effect on Sacalin's area or tip by itself.
2000
How the frames are read
The measurement uses 41 Landsat frames from June to September between 1984 and 2025; 2012 is missing. Each pixel is 30 m. The alignment check flagged no frame above its threshold (0 of 41), but automatic estimates proposed one-pixel adjustments for six frames: 2003, 2006 and 2008-2011. A 2010 scene shifted by more than 5 km was rejected and replaced before the final check.
The outline is not a shoreline surveyed on the ground. It is the waterline extracted from a summer frame using the MNDWI index and a zero threshold. Water level, wind, remaining clouds and 30 m pixels can affect the reading. The selected tip returns north-east in 1988, 1990 and 1991; the series does not show why those readings occurred. The table keeps the annual variation without smoothing it.
A fixed window follows a line through the lagoon; south of it, the calculation selects the largest connected area of land. Area is the selected pixel count multiplied by 0.09 ha. The tip is the selected pixel farthest from the fixed origin. Satellite values generated for the page are checked against the computed series at build; historical figures are attributed separately to published sources.
2010
What changes between years
The chord calculated from the fixed origin increases from 6.99 km in 1984 to 10.74 km in 2025. The pixels selected as the tip in those frames are 4.37 km apart, mainly westward; their north-south difference is about 43 m, close to one pixel. Dividing the distance between these two readings by 41 years gives 106.6 m/year. This is an average between two endpoints, not an annual migration rate. Intermediate readings can move in the opposite direction.
Giosan and colleagues cite historical island lengthening of more than 100 m/year, drawing on Giosan (1998) and Vespremeanu et al. (2004). The 2005 source does not specify the protocol or years measured. The satellite value above is the straight-line distance between two selected pixels divided by 41 years. The definitions and periods differ, so the values do not confirm one another.
Change the year or start playback to see each summer's outline. The selected tip marker is recalculated for every frame; the origin stays fixed. Returns in the series remain visible.
2000
Why the area figures differ
Gâștescu (2021) describes deposition as dominant until 1990, erosion from 1990 to 2006 and deposition returning after 2006. The study reports 670 ha in 1990, 620 ha in 1996 and 450 ha in 2000; it also reports 350 m of shoreline retreat between 1990 and 2000 in the most active sector. These are the author's values and interpretation, not results from this satellite series.
In the satellite series, the fixed window gives 204 ha in 1990 and 333 ha in 2000; it gives 516 ha in 2025. Gâștescu reports 670 ha and 450 ha for the first two years. The methods and measured extents are not documented in a common enough way to explain the difference. Both series are shown with their own sources.
The chord compares a fixed origin with an extreme pixel; the area counts land detected inside the selected window. Neither describes the entire shoreline or the volume of sediment transported.
2025
Compare with your year
Enter a year to see its area, chord and selected tip pixel alongside the 2025 values. The distance between the two pixels compares two waterlines; it does not show the route between them. The field starts empty. There is no frame for 2012.
Choose two years to compare the selected tip pixels, change in chord and change in area. For intervals of at least ten years, the tool also shows the distance between readings divided by the number of years; this is not an annual shoreline-migration rate. Shorter intervals have no annualized value.
Reset returns to the 2025 frame and clears the year and comparison. Your choices stay on this device; the shared link opens the initial view.
2025
Method, limits and sources
Method. Landsat Collection 2, level 2 frames from June to September, 1984-2025; 2012 is missing. Landsat 7 is excluded after its 2003 failure. The waterline is extracted with MNDWI < 0, with clouds excluded by the quality mask. The window uses the same line through the lagoon each year. Area counts connected land pixels inside the window at 0.09 ha per pixel. The tip is the selected pixel farthest from the fixed origin (29.578° E, 44.818° N); the chord is the straight-line distance between them. Alignment compares every frame with 2025; none exceeds the threshold, and six have a one-pixel estimated adjustment.
Limits. The line represents water on one day, not a surveyed shore. Water level, wind, remaining clouds and 30 m pixels affect the reading. Area is land detected inside the analysis window, not the peninsula's cadastral area. The tip pixel is an extreme sensitive to one reading; short intervals can amplify differences between two days. The chord is not shoreline length. The historical estimate of more than 200 m/year cited by Giosan and colleagues refers to the underwater lobe, not the land measurement shown here.
Sources. Gâștescu (2021) supplies the 1897 date, the published 17 km length for 1995, historical areas and rates, and 350 m of retreat. Giosan and colleagues (2005) supply emergence by 1909, doubling by 1935, alongshore transport, historical lengthening and subaqueous-lobe estimates, and three wordings for the island's joining to the mainland. The estimate above 100 m/year is cited from Giosan (1998) and Vespremeanu et al. (2004); the 2005 study does not specify its protocol. An encyclopedia consulted later lists 19 km without a year or method. The table gives the satellite series calculated here and does not reconcile the historical measurements.
The measured series, year by year. Summer waterline. 2012 is missing.
Year Area (ha) Chord (km) Tip (°E) 1984 336.6 6.99 29.509 1985 248.9 7.05 29.510 1986 272.1 7.53 29.501 1987 177.1 7.51 29.502 1988 116.8 5.55 29.528 1989 239.0 7.61 29.502 1990 204.1 5.58 29.530 1991 156.3 5.55 29.528 1992 324.1 8.52 29.485 1993 329.0 8.48 29.485 1994 310.0 8.42 29.487 1995 332.6 8.42 29.487 1996 385.3 8.68 29.484 1997 298.4 8.43 29.487 1998 322.3 8.59 29.486 1999 310.4 8.56 29.487 2000 332.6 8.59 29.486 2001 332.9 9.11 29.480 2002 328.1 8.76 29.486 2003 355.0 9.50 29.471 2004 315.7 9.14 29.480 2005 338.6 9.50 29.470 2006 372.4 9.56 29.470 2007 408.1 9.56 29.472 2008 389.0 9.73 29.469 2009 401.9 9.73 29.469 2010 341.7 9.86 29.466 2011 396.6 9.89 29.463 2013 360.2 9.98 29.464 2014 248.8 9.87 29.465 2015 305.2 9.90 29.464 2016 351.7 9.86 29.464 2017 407.1 10.31 29.462 2018 366.8 10.14 29.467 2019 467.3 10.15 29.467 2020 545.4 10.45 29.460 2021 456.8 10.48 29.459 2022 536.0 10.46 29.460 2023 348.3 10.66 29.455 2024 517.3 10.77 29.453 2025 515.6 10.74 29.454 2025
How to use the series
The series can be extended when a new frame is available, using the same window, origin and classification rule. Use the table to compare years across longer intervals, and remember that each outline comes from one summer day.
This page measures satellite outlines; it does not provide current access information or visiting rules. Check current guidance from the Danube Delta Biosphere Reserve Administration before planning a visit.