Chapter 4 · Boundaries, exchange and new cells
Why does salad go limp in salt, and how does one cell become two?
- Size
- from 10 nm to 100 µm
- Level
- membrane and cell
- Time
- minutes and hours
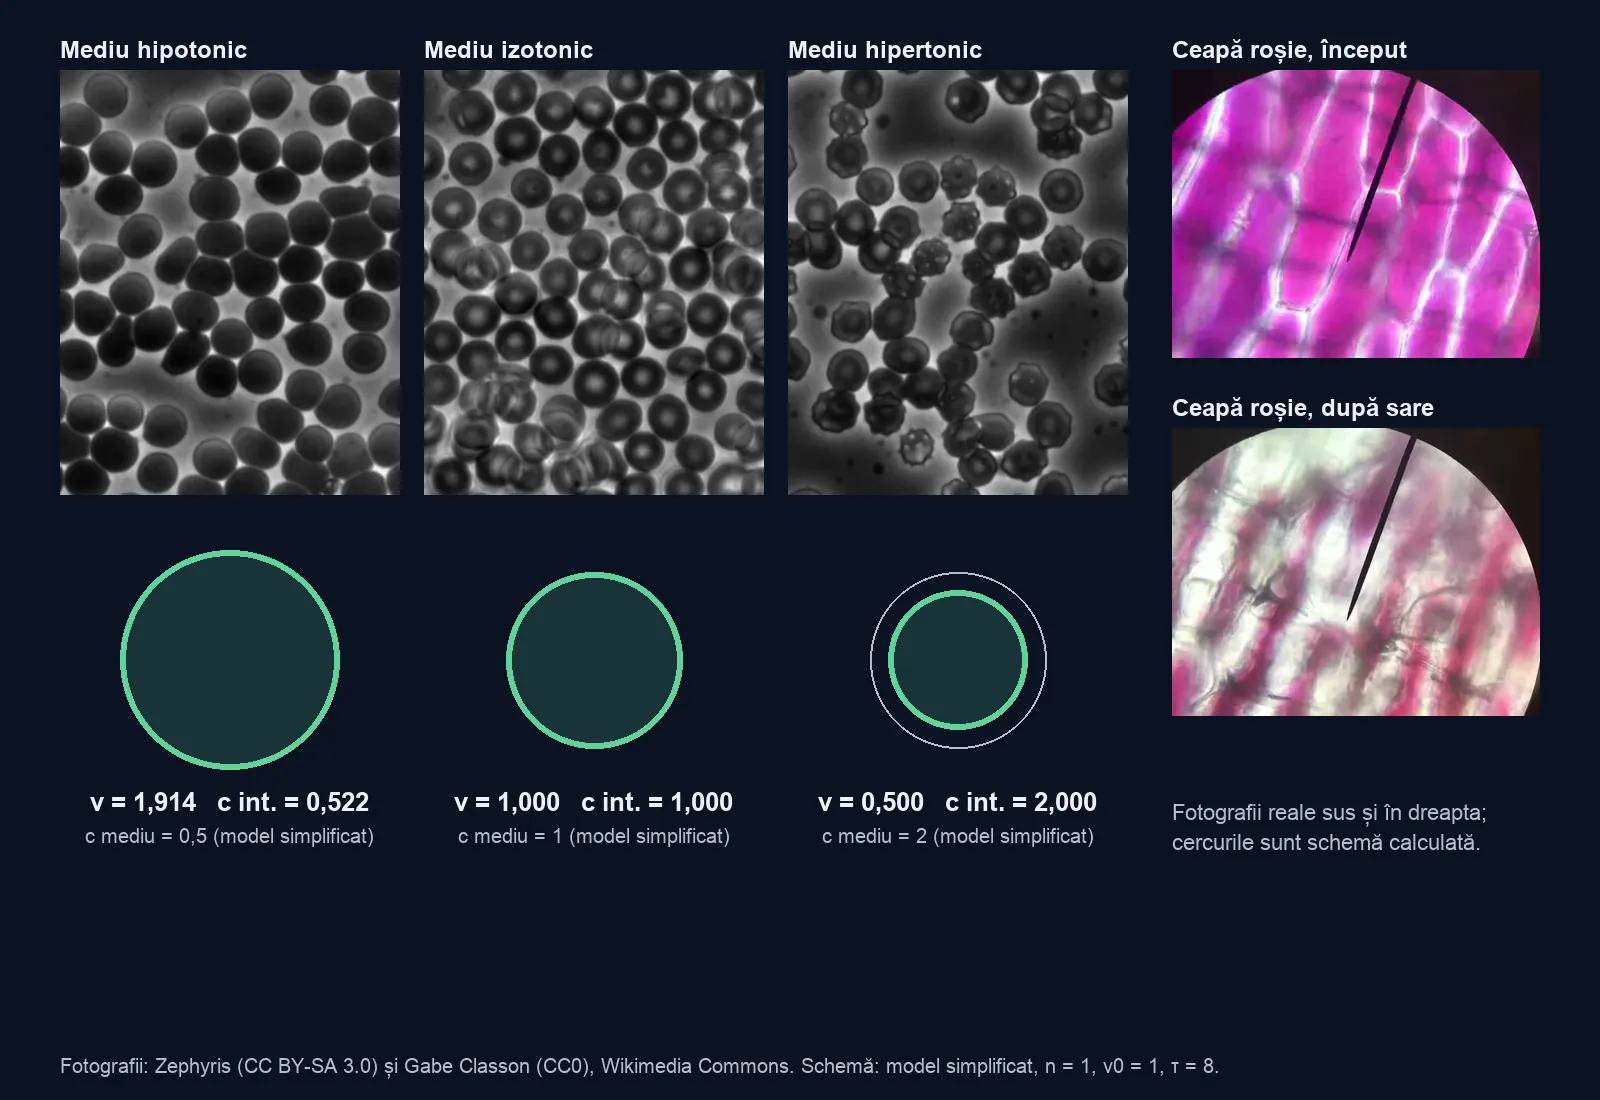
A salted cucumber leaves water on the plate, and a wilted flower revives in a vase of water. The photographs are real; beside them, a drawn cell shows the same thing, with numbers from a simplified model. Change the medium and watch what happens to the volume.
A red blood cell changes shape when its medium changes
In the photograph, human red blood cells sit in an isotonic medium: their volume does not change, because the dissolved substances that cannot cross the membrane have the same concentration in the medium as inside the cell. In hospitals, saline (0.9% sodium chloride) is such a medium for blood.
What happens to these cells if they end up in a glass of distilled water, with no salt at all?
The volume stays the same, yet water still crosses the membrane
In saline, red blood cells keep their disc shape. Water crosses the membrane in both directions, in equal amounts, so the net flow is zero: in the simplified model, 0.000. Zero does not mean the water molecules have stopped.
Water crosses the membrane; in the simplified model, the dissolved substance does not, and stays in the cell: its amount is 1 and does not change. Real membranes let some dissolved substances through as well; tonicity depends on those that cannot cross. Choose what you want to find out.
In a more dilute medium, water enters and the cell swells
The hypotonic photograph shows rounder cells than the isotonic one: they have taken in water but are still whole. In distilled water the membrane can give way and the cell bursts: this is haemolysis. The passage of water through a membrane towards the more concentrated solution is called osmosis.
The button below puts a dilute medium into the model, with concentration 0.500. Distilled water would have concentration 0, and in the simplified model a cell without a wall would then have no equilibrium volume: water would enter without stopping. The model does not draw this case. In reality the cell bursts, which is haemolysis.
In the simplified model, the medium has concentration 0.500, half that of the cell. At τ = 3 the volume has reached 1.660 and the concentration inside the cell has fallen to 0.602: the same amount of dissolved substance, n = 1, now sits in a larger volume. The model does not calculate the volume at which a cell bursts.
Change the medium (starts again from v = 1):
At τ = 8 the volume is 1.914, still below the equilibrium of 2.000
The chart shows two different things. It stops before the volume reaches its final value: the last point is at τ = 8, model time, not seconds. The dotted line shows the final value, calculated separately: 2.000.
At τ = 8 there is still a small net flow inward, 0.022, and a difference of 0.086 remains between the curve and the line.
Is it correct to write v = 2 for the last point of the chart?
In a more concentrated medium, water leaves and the cell shrivels
The hypertonic photograph shows shrunken cells with jagged edges. In the simplified model, the medium has concentration 2.000, and the net flow from the start is −1.000: outward.
The volume falls towards 0.500. The concentration in the cell reaches 2.000 without anything having entered it: the same amount of dissolved substance, in a volume half the size.
Change the medium (starts again from v = 1):
The wall stops the swelling before the two concentrations are equal
Onion cells have a cell wall outside the membrane. The photograph is the first frame of the recording: full cells, before the salt. The source does not say which liquid they were in, so this is not a photograph of a verified hypotonic medium. The model case has no photograph of its own.
In a medium of concentration 0.500, a cell without a wall would tend towards v = 2.000 (the dashed curve on the chart). With a wall drawn as an elastic casing (k = 4), the equilibrium is at v = 1.102: the concentration in the cell remains 0.908, that of the medium is 0.500, and the difference of 0.408 is cancelled by the pressure of the wall. The net flow is zero, even though the two concentrations are not equal. The state of a full cell, whose contents press on the cell wall, is called turgor (the cell is turgid); the equilibrium with k = 4 is how the drawing shows it.
Compare the same start:
In plasmolysis the contents pull back and the wall stays
In the red onion photographs, salt has reached the area around the cells: the violet colour draws together and white space appears between it and the edge. The recording is real and sped up eight times; at the stated speed, the five frames cover about 70 seconds.
The diagram has two outlines. The wall stays at the reference radius 1.000, and the contents pull back to radius 0.794, because the volume falls to 0.500. This is called plasmolysis. If the cell ends up in clean water, the contents press against the wall again: deplasmolysis. The two clocks, the model’s τ and the time of the recording, are not linked.
A new case: explain why the equilibrium volume is 1.250
A compartment without a wall starts with a volume of 1 and an amount of dissolved substance of 1. The medium has concentration 0.800. This is a worked example, with no photograph: the chart shows the result of the model, with a net flow from the start of 0.200, inward, and an equilibrium volume of 1.250.
Write three sentences: what you changed, what changed and why. Add one limit of the model. What should the explanation include if there were an elastic wall?
