Chapter 1 · Method and the microscopeLesson 1.3
An investigation’s data: measurement, table, graph and conclusion
How do you turn a few numbers written in your notebook into a result that anyone can check?
- Size
- from 1 mm to 1 nm
- Level
- cell and cell structures
- Time
- one lesson in the lab
Before you read: what do you think?
In a census of white storks in Romania, carried out with the help of volunteers, the number of nests recorded rose from 1,901 in 2019 to 3,575 in 2020. What can you conclude?
See the answer
Far more sightings were sent in during 2020, and 1,403 nests were reported for the first time: the search had grown. To find out whether there are more storks, you have to compare the same areas, counted the same way, in different years.
Two teams write “the root is 12” in their notebooks. The first measured in millimetres, the second in centimetres, so one of the roots is ten times longer than the other. A number with no unit and no method cannot be compared with anything.
A measurement has a value, a unit and a method
A measurement says which property was measured, the value, the unit of measurement and how it was measured: “the length of the root, from the seed to the tip, measured with a ruler, is 12 mm”. Biology uses the units of the International System of Units (SI) and their multiples: the millimetre and centimetre for length, the gram for mass, the millilitre for volume, the second and the day for time, the degree Celsius for temperature.
The value cannot be more precise than the instrument. A ruler marked in millimetres allows a result of 12 mm, not 12.00001 mm. Every sample gets a code, such as “container A1, day 5”, so that any value can be traced.
The same quantity is measured on several individuals, because organisms differ from one another, and sometimes several times, because no reading is perfectly exact. This uncertainty is part of the result and is reported along with it.
The table and the mean
The data go into a table with a title. The first column holds the independent variable, the next ones hold the measurements of the dependent variable for each replicate, and the last one the mean. The unit is written once, in the column heading, for example “root length (mm)”.
The arithmetic mean is the sum of the values divided by how many there are. The mean of the values 8, 10, 12 and 14 mm is (8 + 10 + 12 + 14) ÷ 4 = 11 mm. But the mean hides the differences between individuals, so the range of values is given as well, here 8–14 mm.
A missing value is marked “missing”, with the reason, and is not entered as zero. Zero means something was measured and the result was zero, and a false zero would drag the mean down.
The graph: what goes on each axis
On a graph, the independent variable goes on the horizontal axis and the dependent variable on the vertical axis. Each axis carries the name of the quantity and its unit, and the graph has a title. Read a graph by its axes first: what quantity it shows, in what unit and from what value the scale starts.
The kind of graph depends on the independent variable. When it has continuous numerical values, such as time or temperature, you use a line graph: the points are joined, and the shape of the line shows the trend. When it has separate categories, such as species, varieties or counties, you use a bar chart, and the vertical axis starts at zero, so that the heights of the bars can be compared fairly.
The conclusion, sources of error and communication
The conclusion answers the question from the start and says whether the data support or disprove the hypothesis, and only for the conditions tested. It does not stretch to what was not measured.
Every measurement has sources of error: the instrument (a ruler worn at the end), the method (a curved root measured as a straight line), the observer (two pupils reading the same mark differently) and a small number of samples. They are noted next to the results.
The results are communicated in a report with the question, the hypothesis, the method, the table, the graph and the conclusion, so that someone else can repeat the investigation. In science, a paper is read before publication by other specialists in the field, who can ask for corrections or reject it.
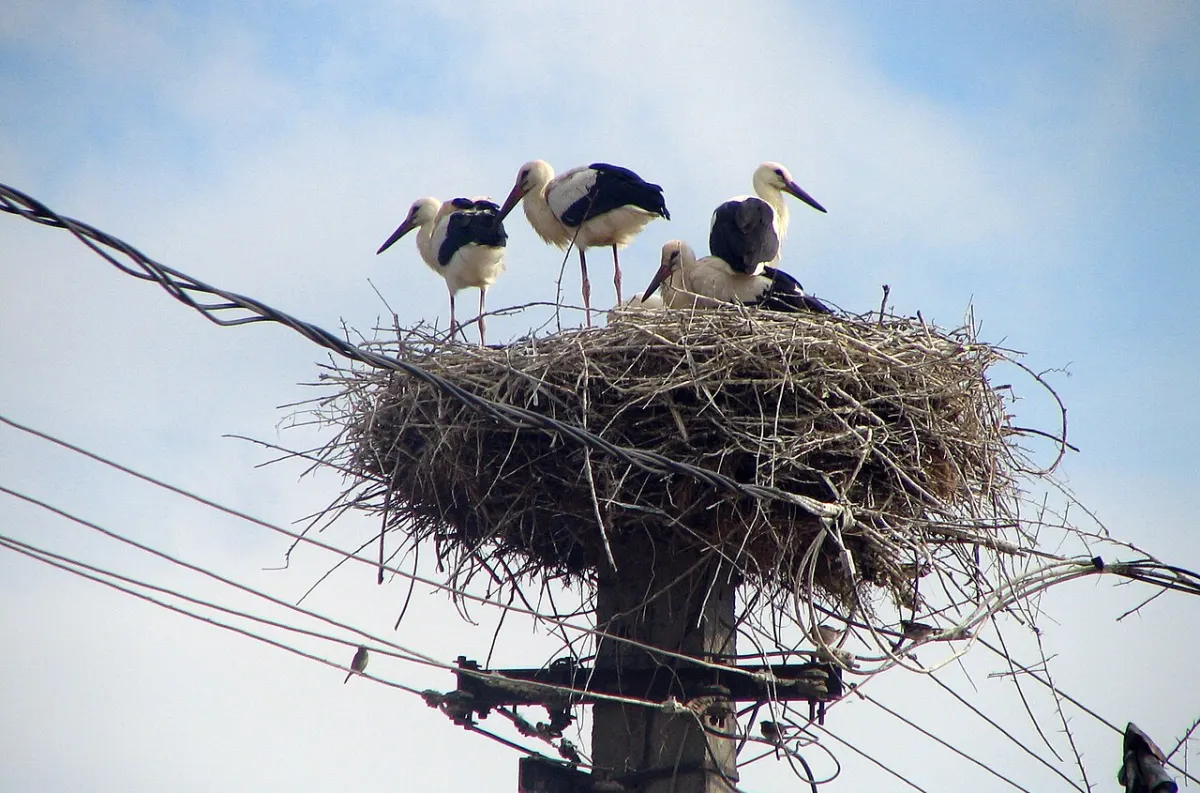
Photo: Bogdan Giuşcă, CC BY 2.5, source. Cropped and resized.

Worked example
From measurements to a mean and a graph
In a sample calculation, beans germinated for five days at 10, 20 and 30 °C, three beans at each temperature. Root length: at 10 °C, 4, 6 and 5 mm; at 20 °C, 18, 22 and 20 mm; at 30 °C, 25 and 29 mm, while the third bean went mouldy and is entered as “missing”.
The means: (4 + 6 + 5) ÷ 3 = 5 mm; (18 + 22 + 20) ÷ 3 = 20 mm; (25 + 29) ÷ 2 = 27 mm. If the mouldy bean had been entered as 0 mm, the mean at 30 °C would have come out as (25 + 29 + 0) ÷ 3 = 18 mm and would have looked, falsely, smaller than at 20 °C.
The graph: on the horizontal axis, temperature (°C); on the vertical axis, mean root length (mm). Temperature has continuous values, so you draw a line graph. The conclusion: between 10 and 30 °C, the roots grew more at higher temperatures. The data say nothing about 40 °C, which was not tested.
In Romania
Stork nests counted by volunteers
Every summer the Romanian Ornithological Society counts white stork nests with the help of people who photograph them and send them in through a phone app, “Uite barza!” (“Look, a stork!”). Specialists check every sighting and remove repeat reports of the same nest.
The data for 2019 and 2020 look like this. In 2019, 3,206 sightings were sent in, 2,788 were validated, and after duplicates were removed 1,901 different nests remained; 13% of the sightings were wrong. In 2020, 4,938 sightings were sent in, 4,824 were validated and 3,575 different nests remained; wrong sightings fell to 2.3%. Most nests in 2020 were found in the counties of Tulcea (299) and Dolj (241).
The conclusion the data support: in 2020 more sightings were sent in, and 1,403 nests were reported for the first time, so more nests were found and the sightings were more accurate. The number of storks cannot be compared from these data, because the number of nests being looked for also rose.
In short
- A measurement has the property measured, the value, the unit of measurement and the method; it cannot be more precise than the instrument.
- In a table, the independent variable sits in the first column, the replicates in the following columns, and the unit in the column heading.
- The arithmetic mean is the sum of the values divided by how many there are; a missing value is marked “missing”, not zero.
- On a graph, the independent variable goes on the horizontal axis and the dependent variable on the vertical axis; a line graph is used for continuous values, a bar chart for categories.
- The conclusion answers the question only for the conditions tested, and the sources of error are noted next to the results.
- Results are communicated so that someone else can repeat the investigation.
Common mistakes
WrongIf a sample got lost, I enter it in the table as 0.
RightA lost sample is marked “missing” and the reason is explained. Zero is a measured value and would change the mean.
WrongI put the measured result on the horizontal axis, because it matters most.
RightThe horizontal axis carries the independent variable, the factor that was changed. The measured result, the dependent variable, goes on the vertical axis.
WrongThe mean shows how much each plant has.
RightThe mean sums up the group and hides the differences between individuals. All the values, or their range, are given alongside it.
Check yourself
Seven questions. For the first six you see the explanation at once, with the paragraph of the lesson that supports it; for the written ones you compare with a good answer.
In an experiment, root length is measured at three temperatures. What goes on the vertical axis of the graph?
Answer
b) Root length (mm). Root length is the dependent variable, the measured result, and goes on the vertical axis. Temperature, the independent variable, goes on the horizontal axis.
What kind of graph do you choose for the number of stork nests in five counties?
Answer
b) A bar chart, with the vertical axis starting at zero. Counties are separate categories, with no values in between, so there is nothing for the points to join. Bars starting at zero allow a fair comparison.
Which option is a measurement written out in full?
Answer
c) The length of the root, from the seed to the tip, measured with a ruler, is 12 mm. The correct option gives the property, the value, the unit and the method.
In 2019, 1,901 stork nests were found; in 2020, 3,575 were found. What conclusion do the data support?
Answer
b) More nests were found in 2020, but the number of storks cannot be compared from these data. More sightings were sent in during 2020, and many nests were reported for the first time. Comparing the number of storks needs the same method, in the same areas.
At 30 °C, the roots of two beans are 25 mm and 29 mm long, and the third bean went mouldy, so its root could not be measured. What is the correct mean, in millimetres?
mmAnswer
27 mm. Take the mean of the measured values: (25 + 29) ÷ 2 = 27 mm. The mouldy bean is “missing”; if it were entered as 0, the mean would come out wrongly as 18 mm.
Put in order the steps by which measurements become a communicated result.
Answer
The correct order:
- Measure and record each value, with its unit and the sample code
- Enter the values in a table
- Work out the mean for each condition
- Draw the graph
- Write the conclusion and the sources of error
- Present the report
The raw data come first; the table organises them; the mean sums them up; the graph shows the trend; the conclusion interprets them; the report makes them checkable.
A pupil measures the height of three wheat plants kept in the light and three kept in the dark, after ten days. Describe the table and the graph the pupil should make and what should be written next to the conclusion.
A good answer
The table has the condition (light or dark) in the first column, then three columns with the plant heights, with the unit in the column heading (“height (mm)”), and a column with the mean. The condition is a category, so the graph is a bar chart: the condition on the horizontal axis, the mean height in millimetres on the vertical axis, starting at zero. Next to the conclusion go the sources of error, such as the small number of plants and the way the stems were measured.
A complete answer places the variables correctly in the table and on the axes, adds the units, chooses a bar chart for categories and names at least one source of error.
Terms
- measurement
- The value of a property, with its unit of measurement, obtained with an instrument by a stated method.
- unit of measurement
- The reference quantity in which a measurement is expressed, for example the millimetre or the gram.
- table
- An arrangement of data in rows and columns, with a title, variables and units.
- arithmetic mean
- The sum of the values divided by how many there are.
- graph
- A drawn representation of data, with the independent variable on the horizontal axis and the dependent variable on the vertical axis.
- source of error
- A cause that can make a measured value differ from the true value: the instrument, the method, the observer or a small number of samples.
Sources and link to the programme
- Spotmedia (25 August 2020) – Record pentru aplicația „Uite barza!”, prin care se face recensământul berzelor – 2019: 3,206 sightings, 2,788 validated, 1,901 unique nests, 13% errors; 2020: 4,938 sightings, 4,824 validated, 3,575 unique nests, of which 1,403 reported for the first time, 2.3% errors; removal of multiple reports; Tulcea 299, Dolj 241
- Societatea Ornitologică Română – Berzele României (observation database) – nest sightings sent in by volunteers, with nest type and number of chicks
- NIST – Measurement Uncertainty – every measurement has an uncertainty that is part of the result
- OpenStax – Biology 2e, 1.1 The Science of Biology – analysing results, reporting and checking by other specialists (peer review) before publication
From the programme: “The scientific method. Research ethics. Observation and experiment in biology: formulating the hypothesis, defining the variables, choosing the methods, collecting and analysing the data, formulating conclusions, communicating the results” (common core). Specific competences addressed: 1.1, 2.1, 2.2, 4.1.