Energy · a map from orbit
Romania's solar parks from orbit: the first wave, the quiet years and the second wave
By mid-2018 Romania had about 3,043 hectares of ground-mounted solar panels. By the end of 2021 only 67 more hectares had been added. Since 2022 at least 2,548 more have appeared, and each new hectare holds more than twice the megawatts of an old one.
The megawatts tell the same story. The first wave added up to 1,374 MW at the end of 2017, according to Transelectrica. In 2024 and 2025 alone, by the industry's estimate (RPIA), new solar parks added about 1.8 GW. The map below shows where. Tap it or search for a commune: the parks within 10 km appear, drawn to scale.
- first wave, to mid-2018
- quiet years, 2018–2021
- second wave from orbit, 2022–2024
- second wave on OpenStreetMap, 2023–2026
#The first wave and the quiet years
The first-wave parks grew on green certificates, the support scheme launched in 2011 and closed to new plants at the end of 2016. Transelectrica, the transmission grid operator, counted 1,223 MW of photovoltaic capacity at the end of 2014, nearly nine tenths of what the whole first wave would be. Another 70.4 MW followed in 2015, 78.2 MW in 2016 and 3 MW in 2017, reaching 1,374 MW.
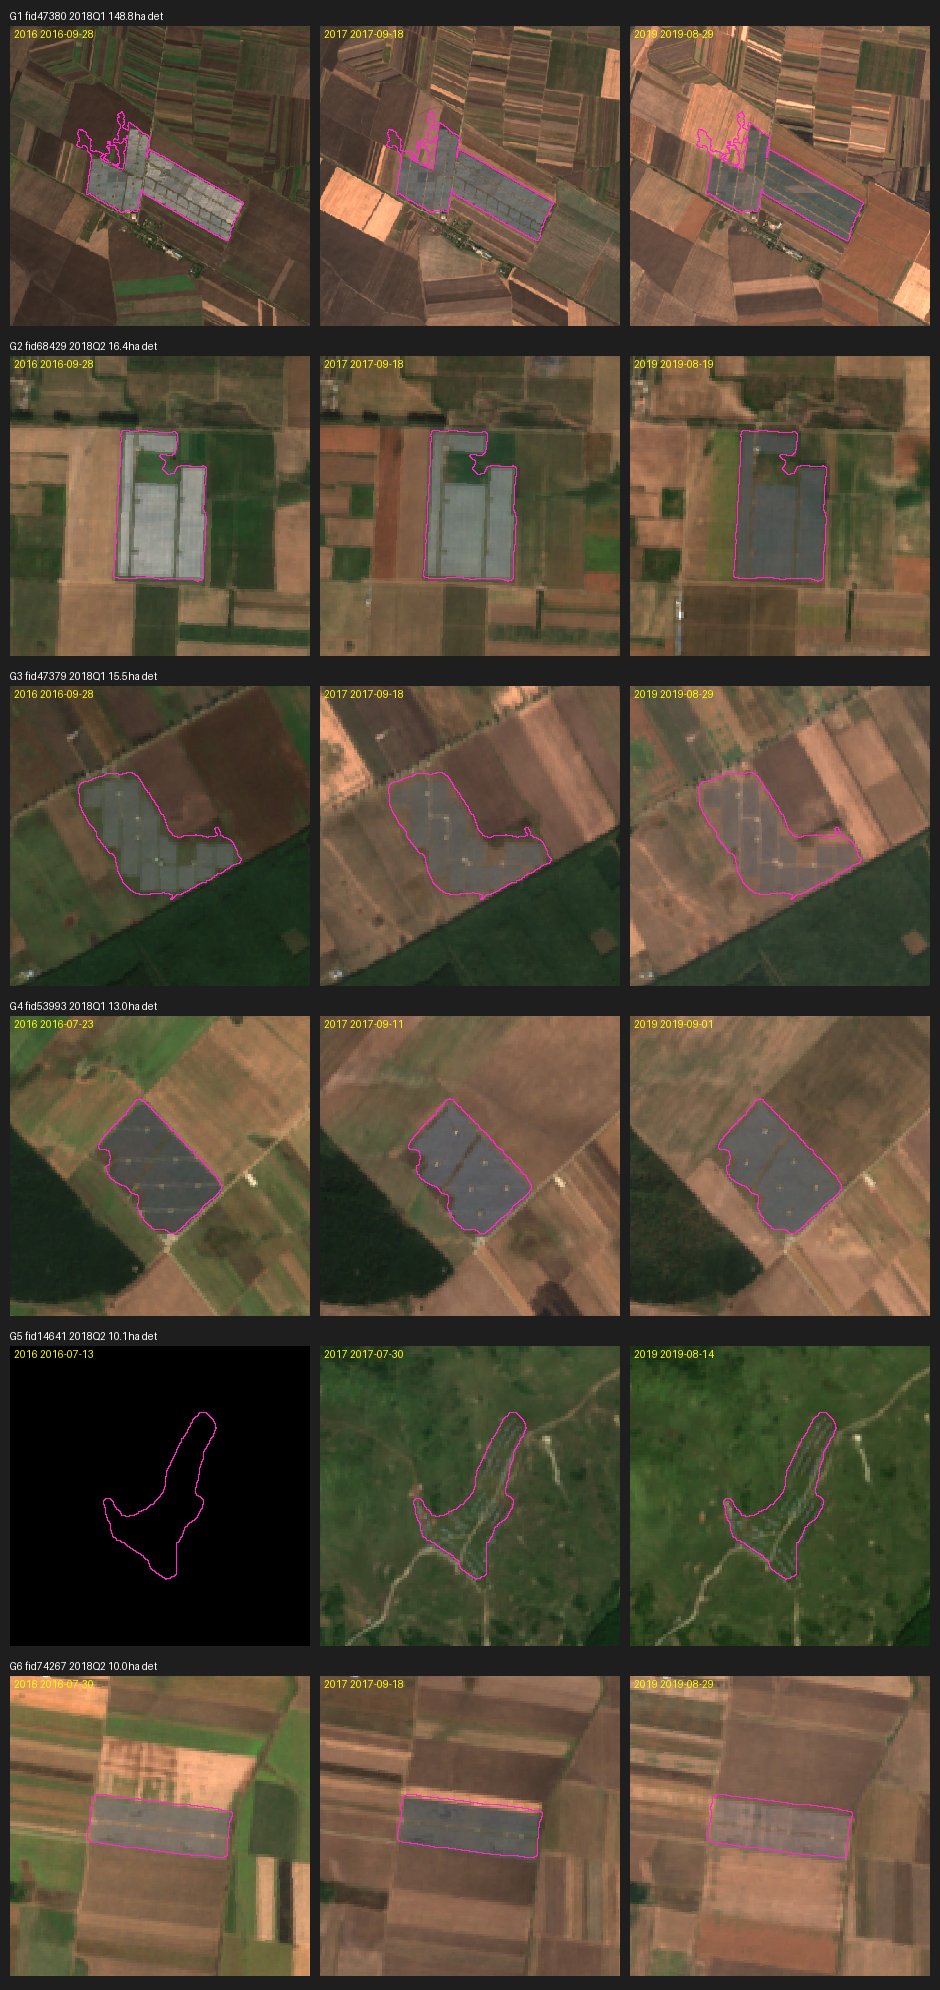
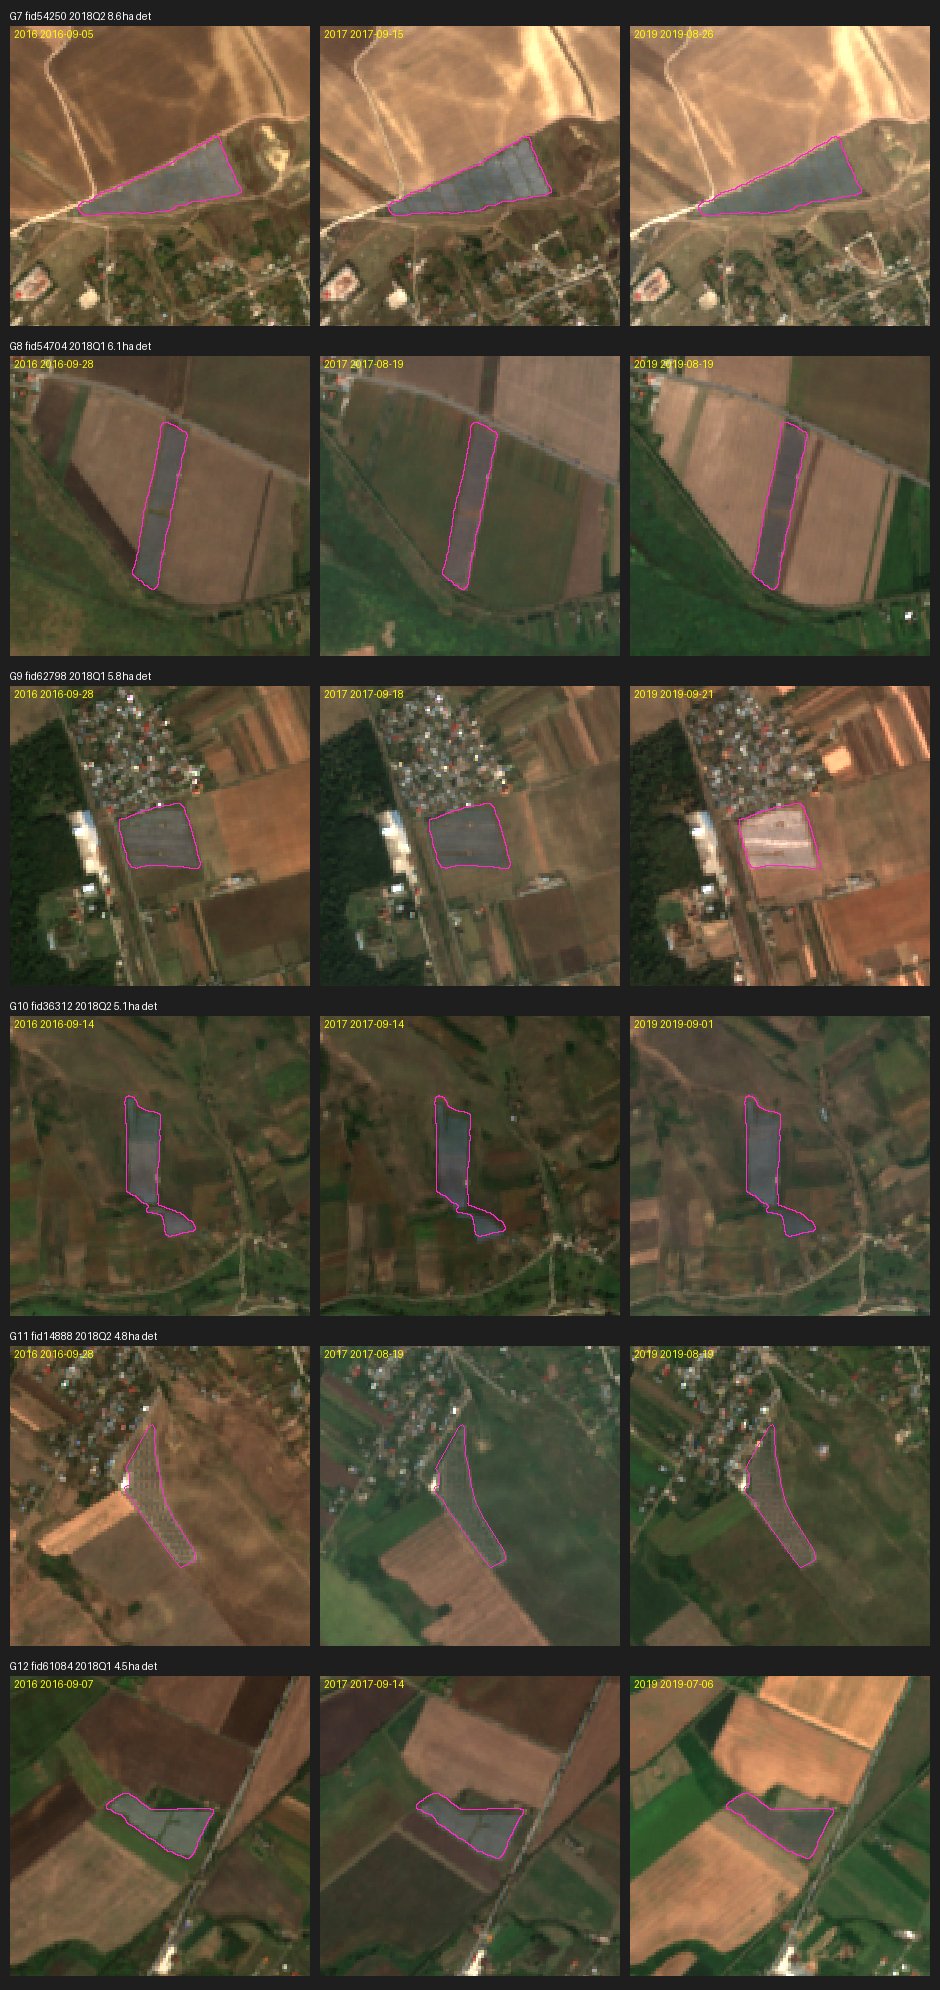
The satellite images show the same. The Global Renewables Watch inventory, made by Microsoft, The Nature Conservancy and Planet from PlanetScope images every three months, finds 341 parks and 3,003 hectares already on the ground by mid-2018. Another 14 parks, about 40 hectares, slip past it but appear on OpenStreetMap and overlap a second inventory from 2018, so they too belong to the first wave. The inventory's first date is really the date of its first image: all 12 of the largest parks it dates to the first half of 2018 already show on Sentinel-2 images from the summers of 2016 or 2017.
From summer 2018 to the end of 2021, the same inventory finds only 15 new parks, 67 hectares in all (leaving out those the 2018 inventory had already seen): about half the largest first-wave park (149 hectares, at Izvoarele in Giurgiu county).
#The second wave
From 2022 to mid-2024 the satellite inventory adds 44 parks and 588 hectares. Then it stops: its last image dates from the second quarter of 2024. What came next shows on OpenStreetMap, the open map of the world, where volunteers draw the outline of each park. On 6 November 2026 the map held 152 parks of at least one hectare that the 2024 inventory covers less than half of: about 1,960 new hectares of panels (2,199 hectares inside the fences).
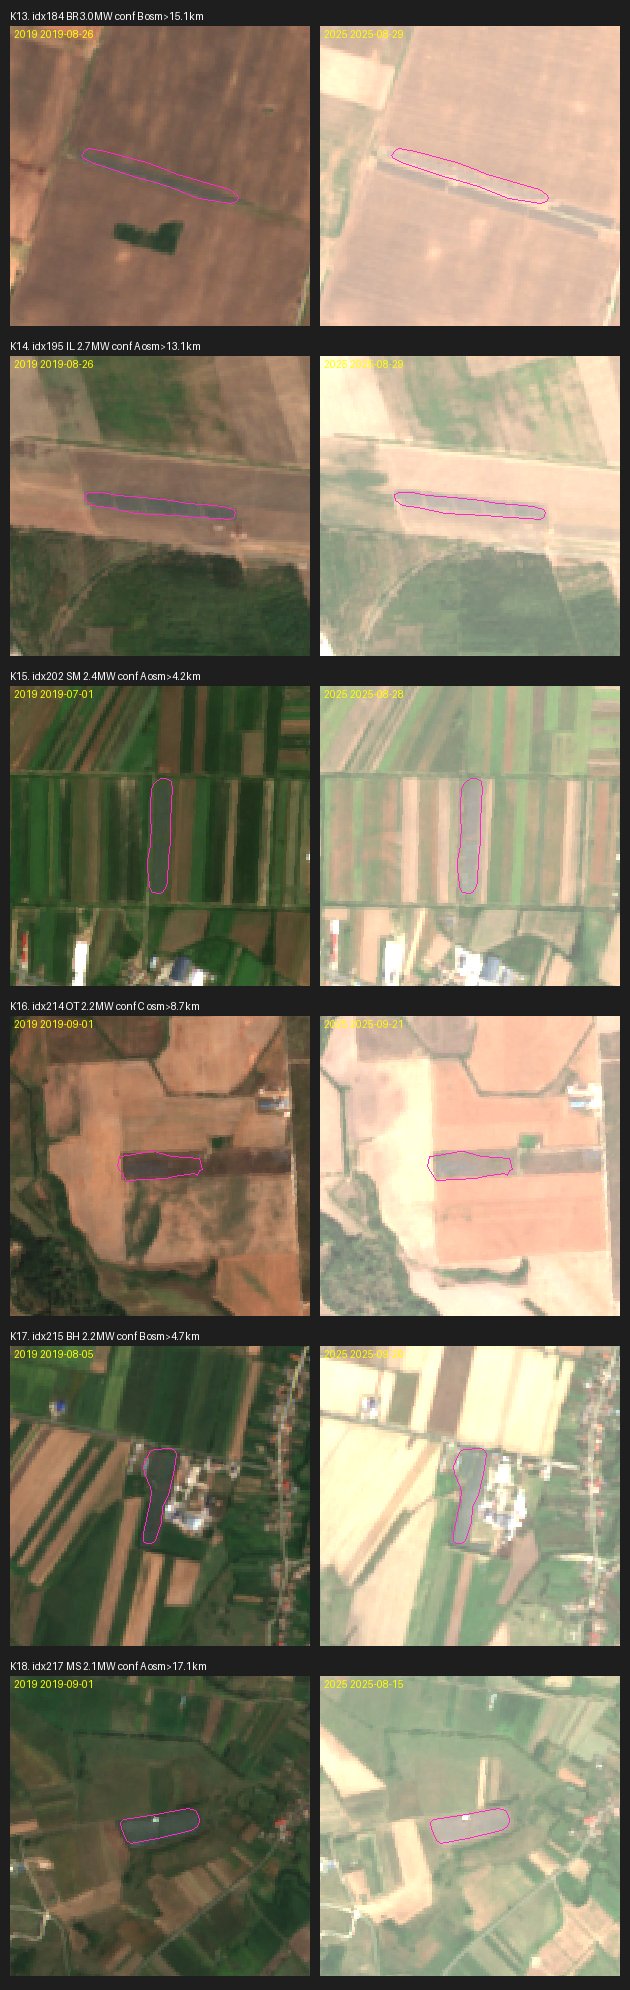
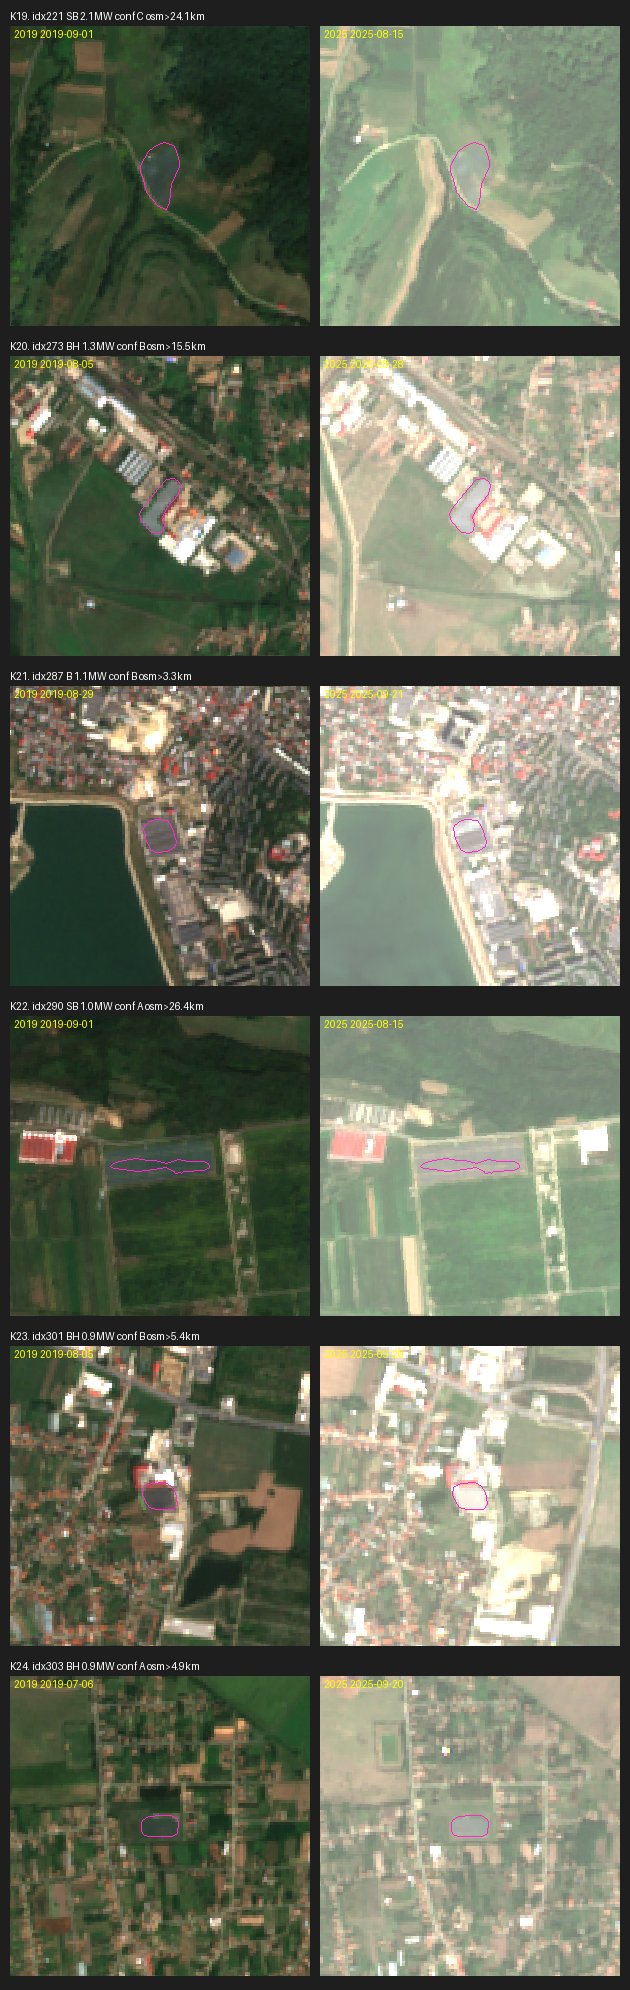
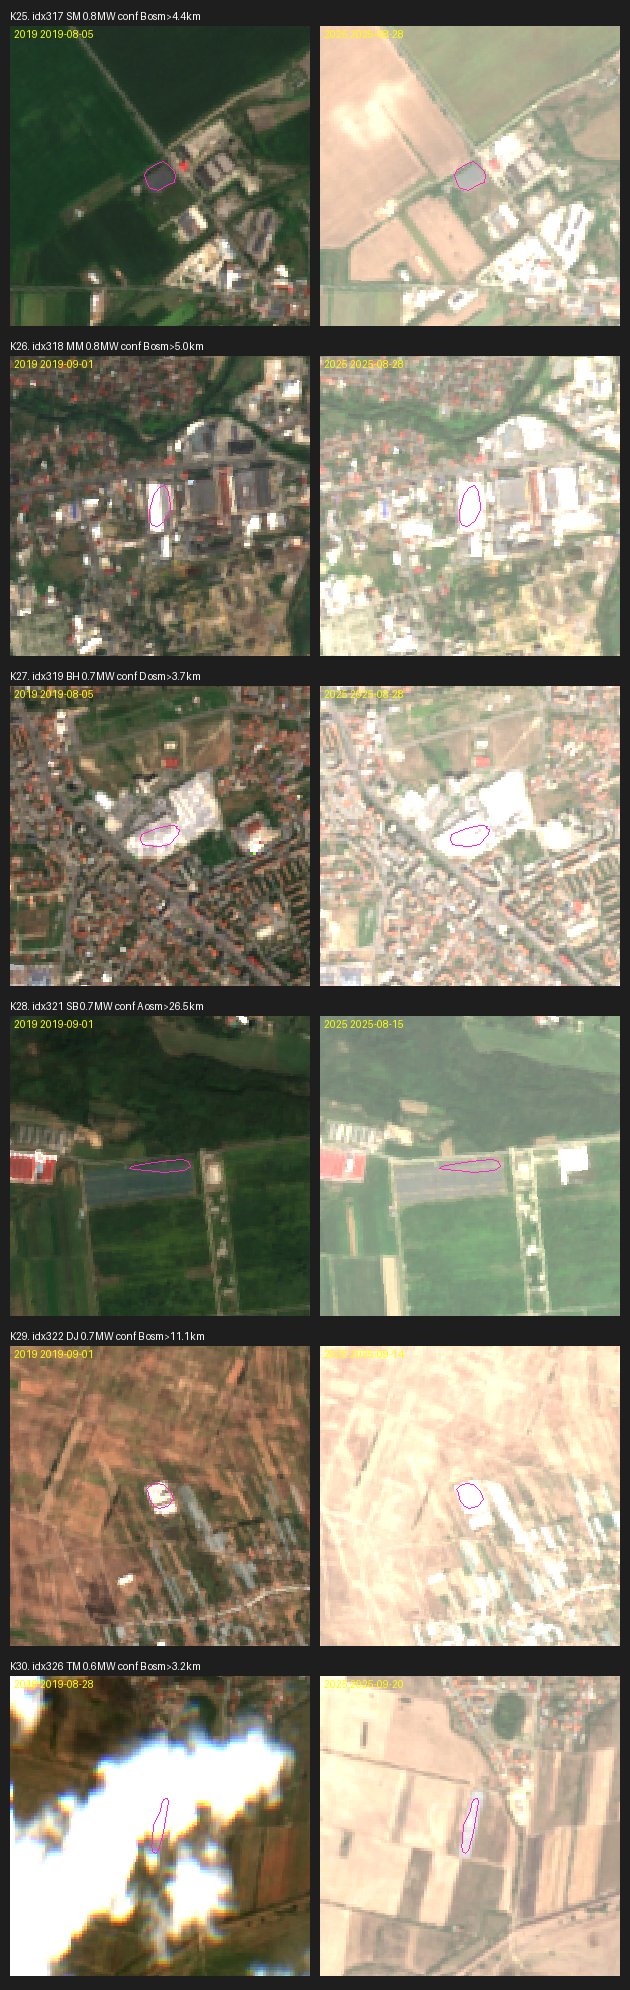
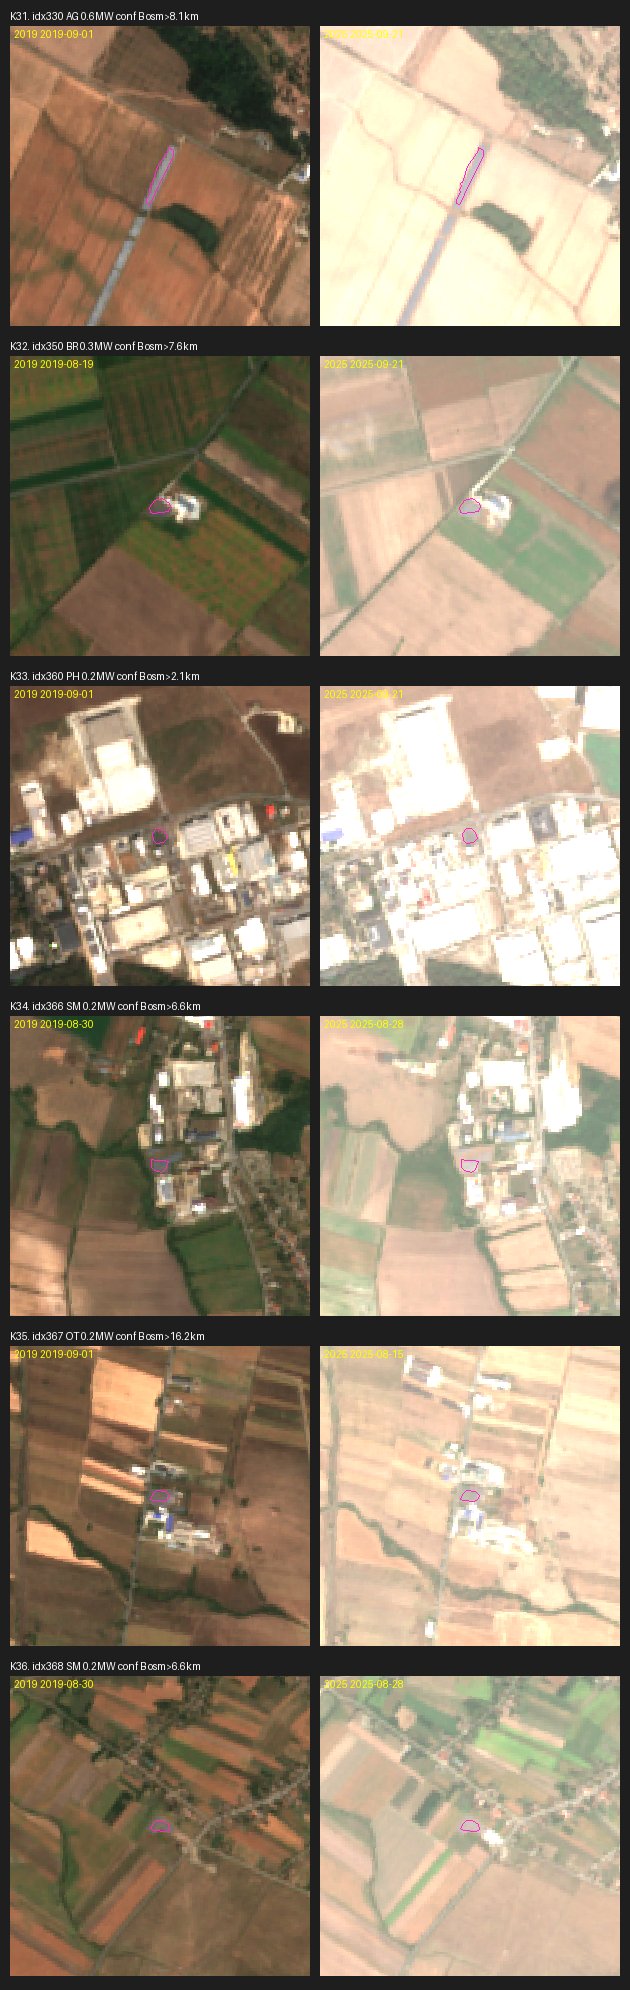
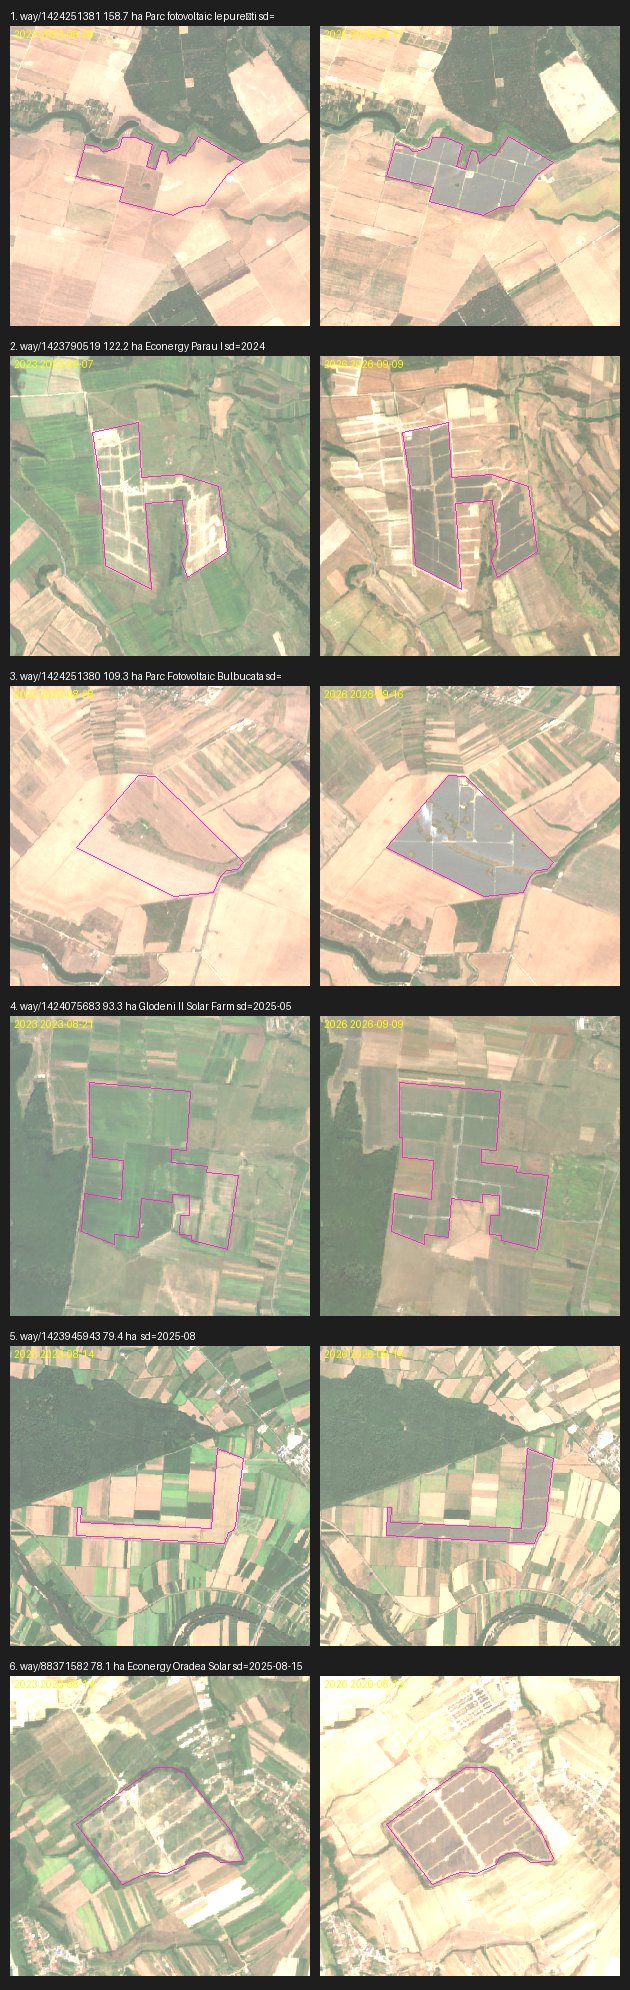
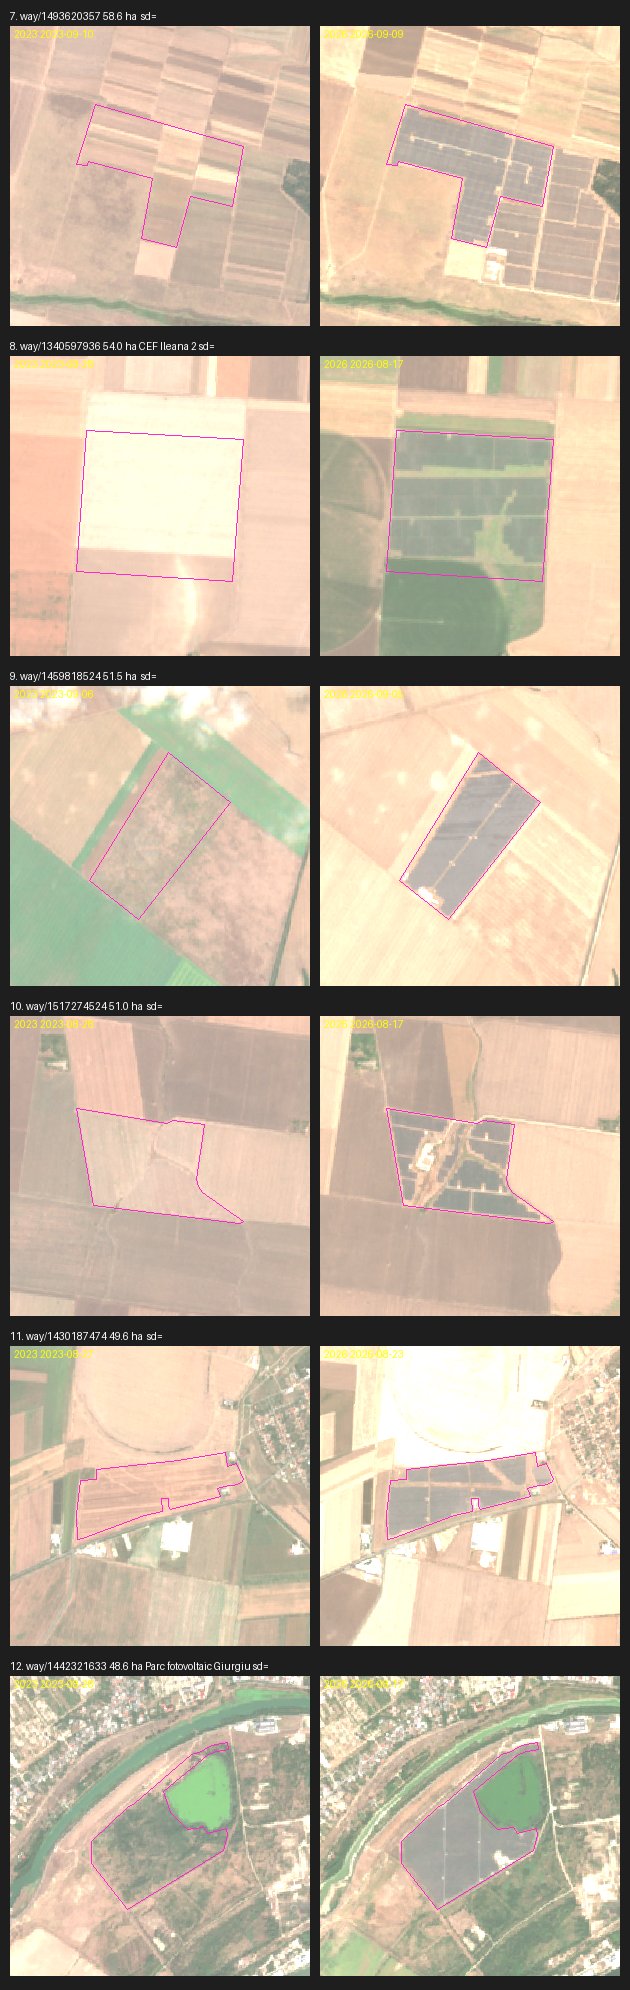
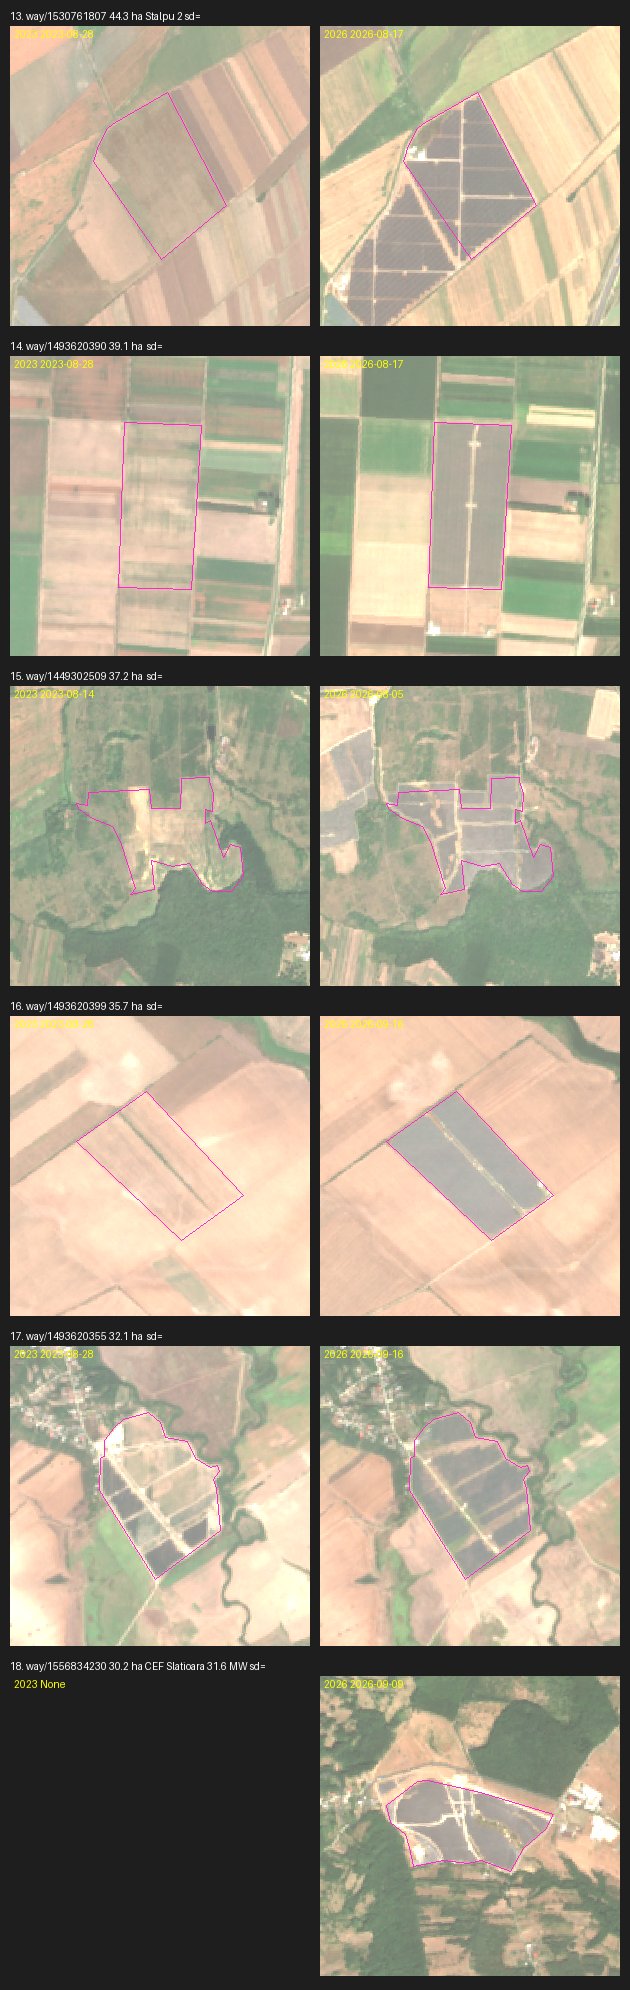
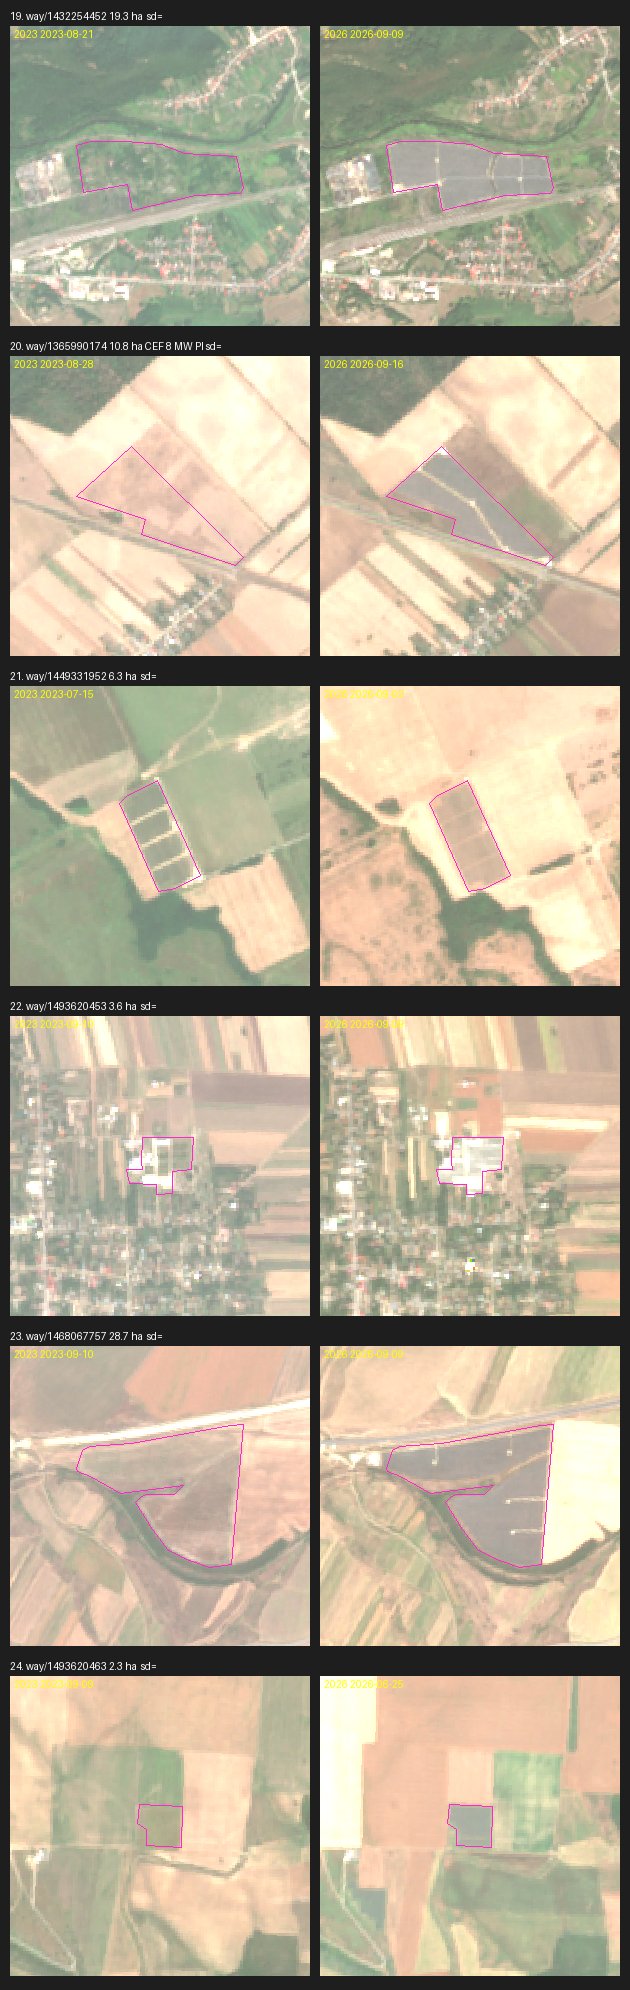
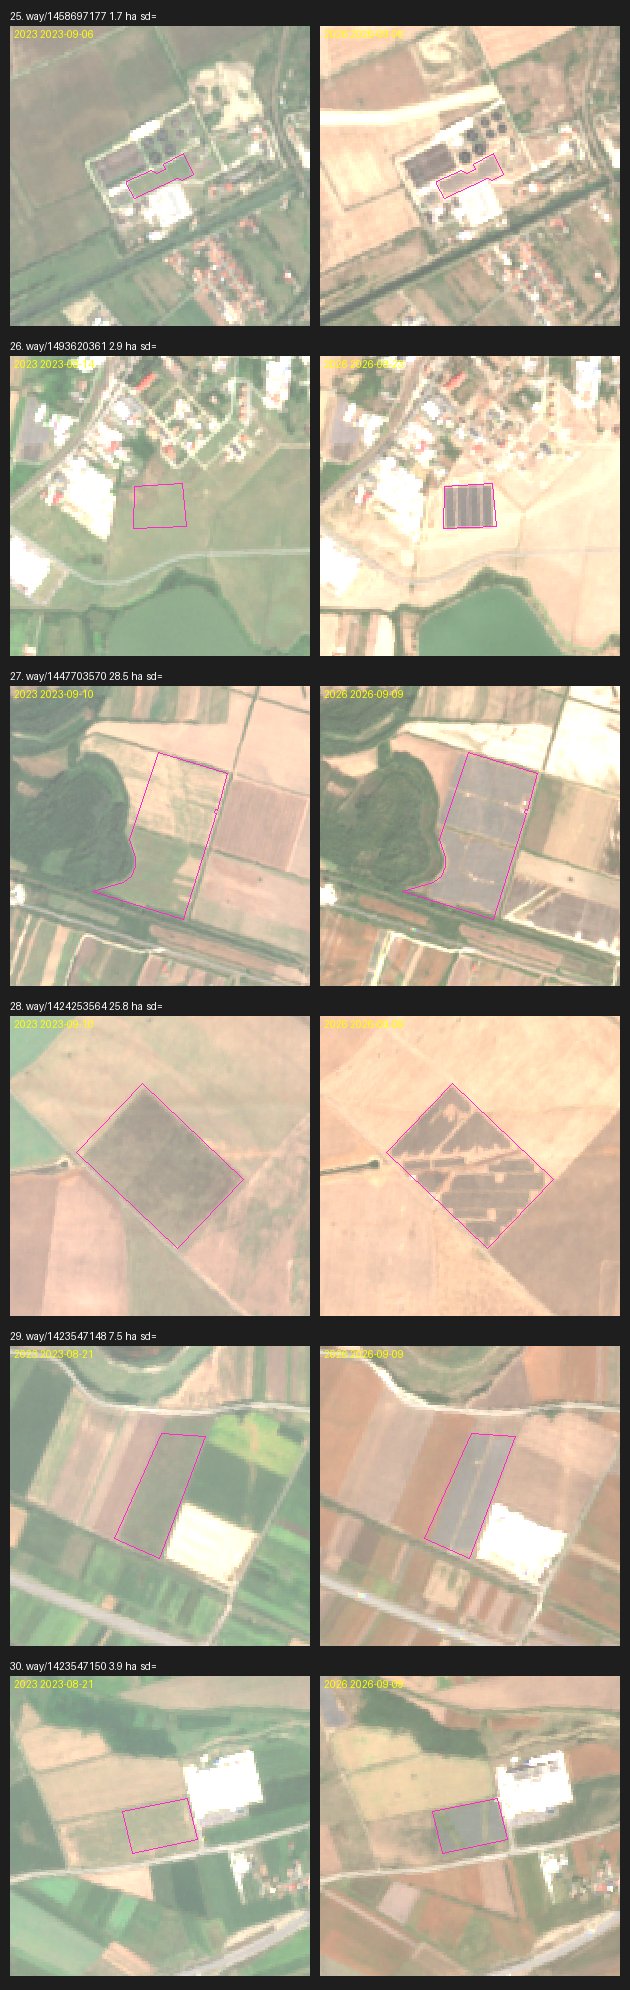
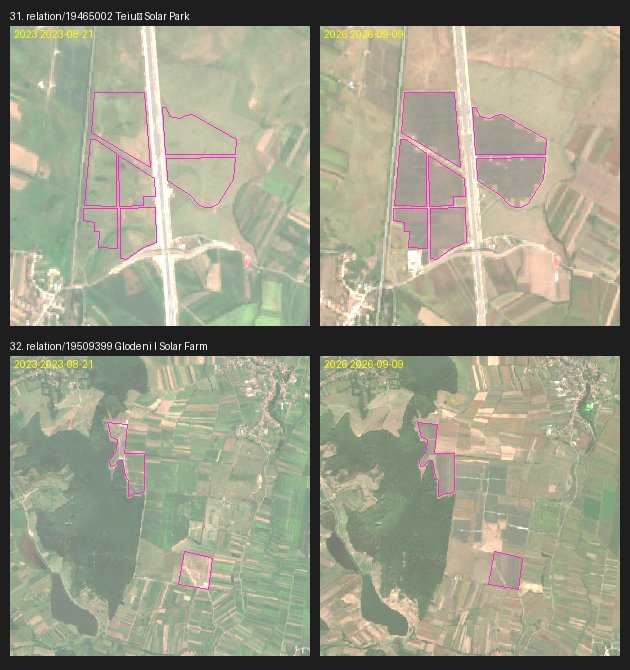
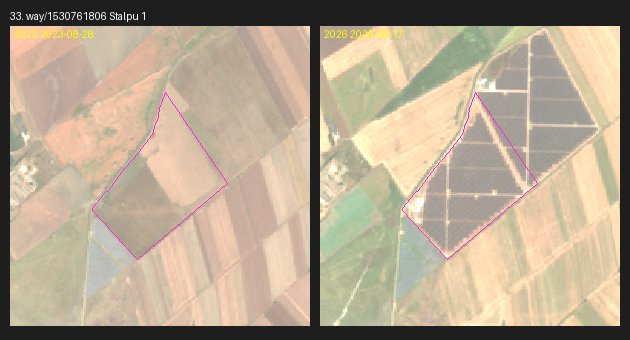
Of these, 33 were inspected on Sentinel-2 images from summer 2023 and summer 2026: all 18 of the largest, 3 more large ones and 12 drawn at random. In summer 2023, 27 had no panels yet (on some, the site tracks were already visible) and 2 already had them; 3 cannot be read at 10 metres a pixel, and for one there is no cloud-free image from 2023. The open-map part of the second wave, then, is almost all from after summer 2023.
The largest solar park in the country by area now belongs to the second wave: Centrala Fotovoltaică Rătești (Rătești, Argeș: 155 ha, 155 MW stated), bigger than any first-wave park. Next come Parc fotovoltaic Iepurești (Iepurești, Giurgiu: 141 ha, 169 MW stated); Econergy Parau I (Părău, Brașov: 109 ha, 92 MW stated); a park with no name on OpenStreetMap (Călugăreni, Giurgiu: 104 ha).
A new hectare holds more megawatts. The first wave put 1,374 MW on about 3,043 hectares of panels, or 0.45 MW a hectare; the 25 old parks above 5 hectares whose capacity is given on OpenStreetMap have a similar median, 0.47 MW a hectare. The 17 new parks of the same kind have a median of 1.04 MW per hectare of panels, 2.2 times as much. That is why 2,548 new hectares hold more megawatts than the roughly 3,043 old ones.
Rooftop panels are not on this map: at the resolution of these images they cannot be seen. They too grew fast: ANRE, Romania's energy regulator, counted about 267,000 prosumers (households and firms that make their own power) with 3,128 MW installed in September 2025. The industry association RPIA put total solar at over 7 GW at the end of 2025, about 3.5 GW of it in parks. Transelectrica's presentation for 2025, which gives no exact date, lists 2,779 MW of solar power, 1,405 MW more than in 2017: again about as much as the whole first wave.
The largest parks of the second wave
| Park | Commune | County | Source | ha of panels | MW stated |
|---|---|---|---|---|---|
| Centrala Fotovoltaică Rătești | Rătești | Argeș | orbit, Q2 2022 | 155 | 155 |
| Parc fotovoltaic Iepurești | Iepurești | Giurgiu | OpenStreetMap, 2026 | 141 | 169 |
| Econergy Parau I | Părău | Brașov | OpenStreetMap, 2026 | 109 | 92 |
| no name on OpenStreetMap | Călugăreni | Giurgiu | orbit, Q4 2022 | 104 | – |
| Parc Fotovoltaic Bulbucata | Ghimpați | Giurgiu | OpenStreetMap, 2026 | 97 | – |
| Glodeni II Solar Farm | Glodeni | Mureș | OpenStreetMap, 2026 | 83 | 60 |
| no name on OpenStreetMap | Satu Mare | Satu Mare | OpenStreetMap, 2026 | 71 | 71 |
| Econergy Oradea Solar | Sânmartin | Bihor | OpenStreetMap, 2026 | 70 | 87 |
| no name on OpenStreetMap | Șotânga | Dâmbovița | orbit, Q2 2023 | 58 | – |
| Teiuș Solar Park | Teiuș | Alba | OpenStreetMap, 2026 | 54 | 60 |
| no name on OpenStreetMap | Studina | Olt | OpenStreetMap, 2026 | 52 | – |
| CEF Ileana 2 | Ileana | Călărași | OpenStreetMap, 2026 | 48 | 40 |
#The parks near you
Pick a place on the map or search for your commune. The parks within 10 km appear drawn to scale, coloured by the wave they belong to, with their area in football pitches and, roughly, how many homes they would supply in a year.
No place chosen yet. Tap the map or search for a commune.
#Where they appeared
Giurgiu, on the Danube south of Bucharest, has the most hectares in the country, 994, and has added more since 2018 than it had before (522 against 472). Prahova, second in the first wave, has barely grown (38 new hectares). Mureș in Transylvania, with 200 new hectares, has added more than twice what it had before 2018. The table has every county with ground-mounted parks (Vaslui has none in these sources); all figures are hectares of panels, so they add up.
| County | Parks | First wave, ha | Quiet years, ha | Second wave, orbit, ha | Second wave, OpenStreetMap, ha | Total, ha |
|---|---|---|---|---|---|---|
| Giurgiu | 33 | 472 | 0 | 136 | 386 | 994 |
| Brașov | 24 | 214 | 0 | 5 | 137 | 355 |
| Prahova | 34 | 294 | 2 | 11 | 25 | 332 |
| Dolj | 34 | 190 | 9 | 16 | 107 | 322 |
| Călărași | 21 | 108 | 13 | 63 | 124 | 308 |
| Olt | 25 | 156 | 0 | 8 | 110 | 274 |
| Argeș | 17 | 79 | 11 | 161 | 12 | 263 |
| Mureș | 29 | 63 | 6 | 0 | 194 | 263 |
| Satu Mare | 20 | 147 | 0 | 0 | 96 | 243 |
| Dâmbovița | 29 | 137 | 9 | 77 | 12 | 235 |
| Timiș | 48 | 105 | 2 | 13 | 109 | 229 |
| Bihor | 28 | 141 | 3 | 0 | 77 | 220 |
| Teleorman | 24 | 65 | 3 | 27 | 103 | 197 |
| Cluj | 24 | 130 | 0 | 6 | 49 | 185 |
| Arad | 21 | 70 | 0 | 14 | 74 | 158 |
| Sibiu | 15 | 106 | 0 | 0 | 19 | 124 |
| Buzău | 9 | 20 | 0 | 0 | 85 | 104 |
| Alba | 11 | 11 | 0 | 17 | 64 | 93 |
| Mehedinți | 6 | 82 | 0 | 0 | 7 | 89 |
| Brăila | 15 | 73 | 0 | 4 | 2 | 79 |
| Gorj | 7 | 59 | 0 | 2 | 16 | 77 |
| Vâlcea | 10 | 13 | 0 | 10 | 38 | 61 |
| Ialomița | 7 | 36 | 3 | 6 | 0 | 45 |
| Bistrița-Năsăud | 5 | 40 | 0 | 0 | 4 | 44 |
| Bacău | 3 | 42 | 0 | 1 | 0 | 43 |
| Sălaj | 2 | 7 | 0 | 0 | 33 | 41 |
| Tulcea | 8 | 28 | 2 | 0 | 7 | 37 |
| Ilfov | 10 | 10 | 0 | 4 | 22 | 36 |
| Harghita | 5 | 18 | 0 | 0 | 9 | 27 |
| Maramureș | 4 | 21 | 5 | 0 | 0 | 26 |
| Vrancea | 6 | 19 | 0 | 0 | 6 | 25 |
| Hunedoara | 2 | 25 | 0 | 0 | 0 | 25 |
| Constanța | 6 | 7 | 0 | 4 | 13 | 24 |
| Iași | 6 | 13 | 0 | 0 | 7 | 20 |
| Covasna | 4 | 15 | 0 | 0 | 0 | 15 |
| București | 4 | 13 | 0 | 1 | 1 | 15 |
| Botoșani | 1 | 8 | 0 | 0 | 0 | 8 |
| Caraș-Severin | 3 | 1 | 0 | 0 | 6 | 7 |
| Galați | 2 | 0 | 0 | 2 | 5 | 6 |
| Suceava | 2 | 2 | 0 | 0 | 2 | 4 |
| Neamț | 2 | 0 | 0 | 2 | 2 | 4 |
#And how much has been promised
On paper, the queue is of another order. On 1 March 2026 ANRE counted 1,431 renewable projects of at least 1 MW holding a valid technical grid-connection approval (an ATR, which reserves grid capacity), totalling 81,322 MW approved for export to the grid. Of these, 46,136 MW had a connection contract and 8,944 MW also held a building permit and an ANRE establishment authorisation. The total covers wind and other sources as well as solar, and an approval is not a plant.
Set beside the solar parks built (about 3.5 GW at the end of 2025 according to RPIA; 2,779 MW in Transelectrica's presentation for 2025, which gives no exact date), the approvals total is 23 to 29 times larger. The squares below are drawn to scale: area is proportional to megawatts. The connection queue has its own story, told in The megawatt cemetery.
- Valid connection approvals, all sources, 1 March 2026: 81,322 MW
- With a connection contract: 46,136 MW
- Also with permits: 8,944 MW
- Solar parks built, end of 2025: about 3,500 MW
#What another satellite count found in 2018
A second inventory, published by Kruitwagen and colleagues in Nature (2021), describes the position at the end of 2018. It finds 398 parks in Romania, 2,365 hectares and 1,904 MW of capacity calculated from area, about 3,312 football pitches (one pitch = 0.714 ha). Its largest park reaches 100.2 calculated MW and its median park 2.6 MW.
The number of parks is close to Global Renewables Watch; the megawatts are not. Transelectrica counted 1,374 MW at the end of 2017, and in 2018 the satellites see only a few new hectares, so the 1,904 MW calculated from area sit about 39% above the official figure. That is why this page counts hectares from orbit and takes megawatts from the registers and industry estimates.
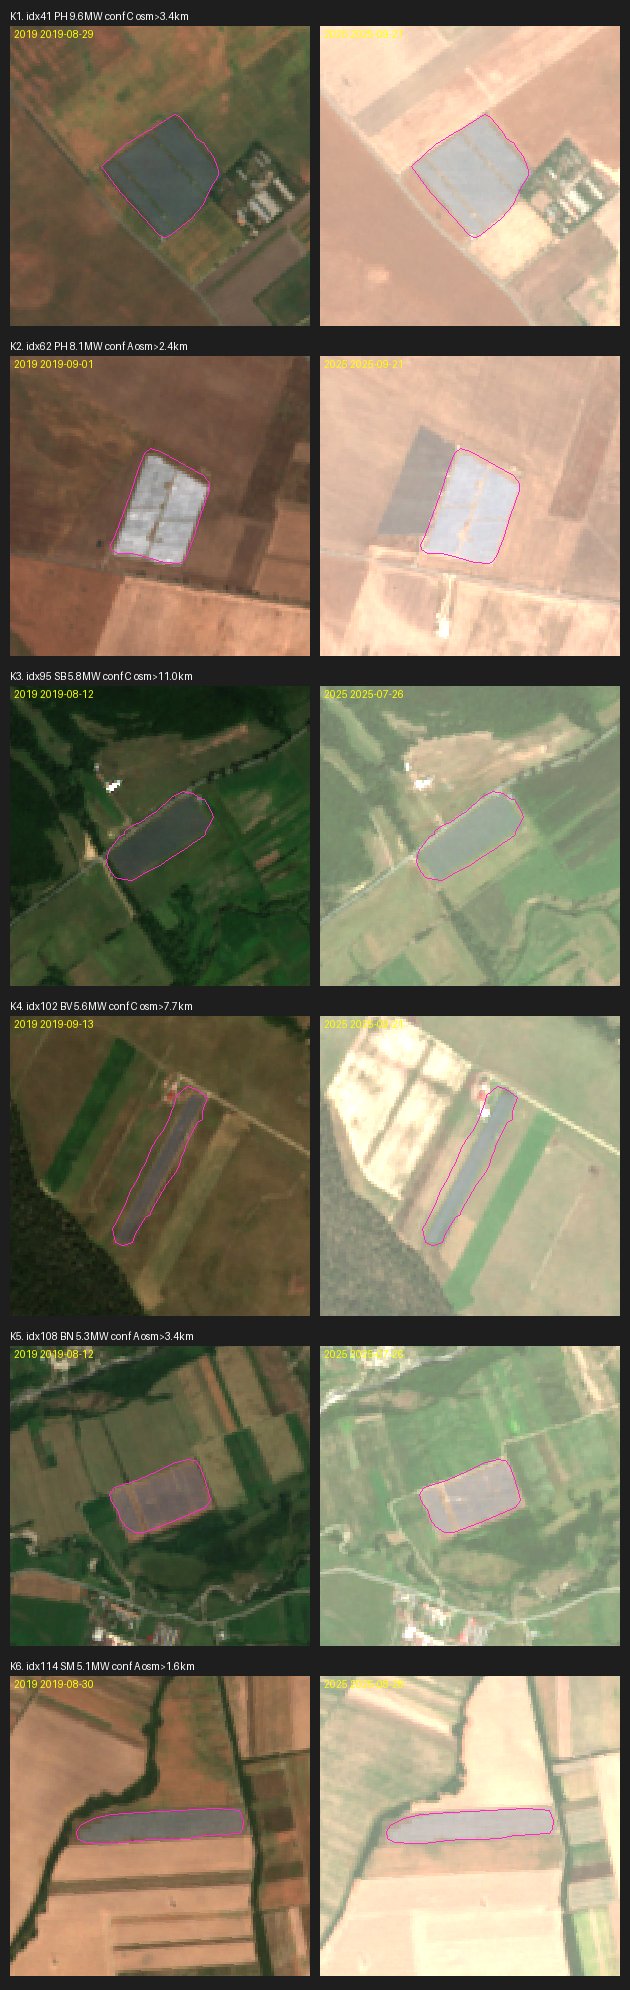
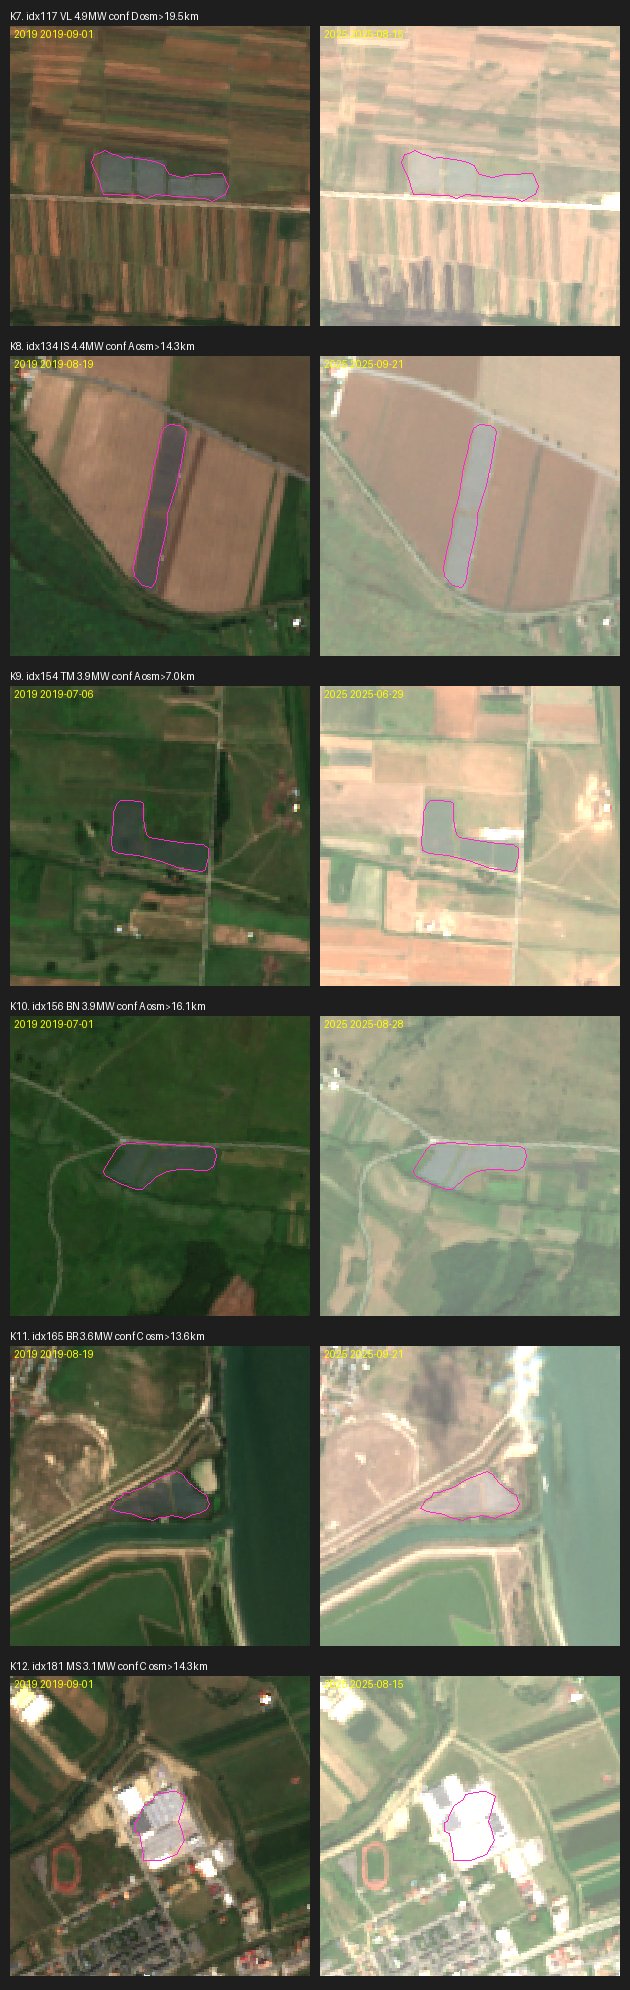
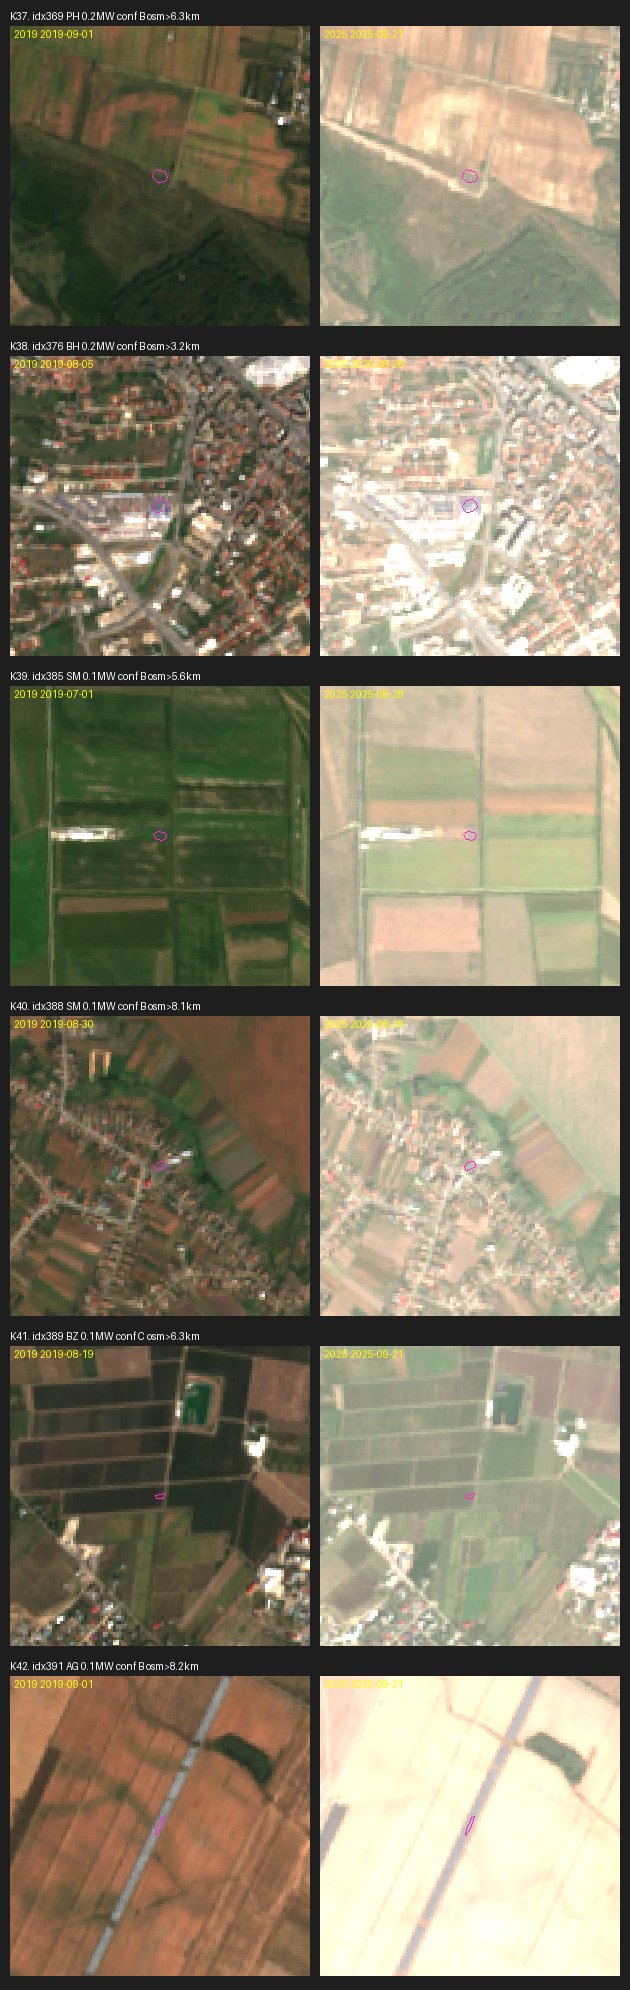
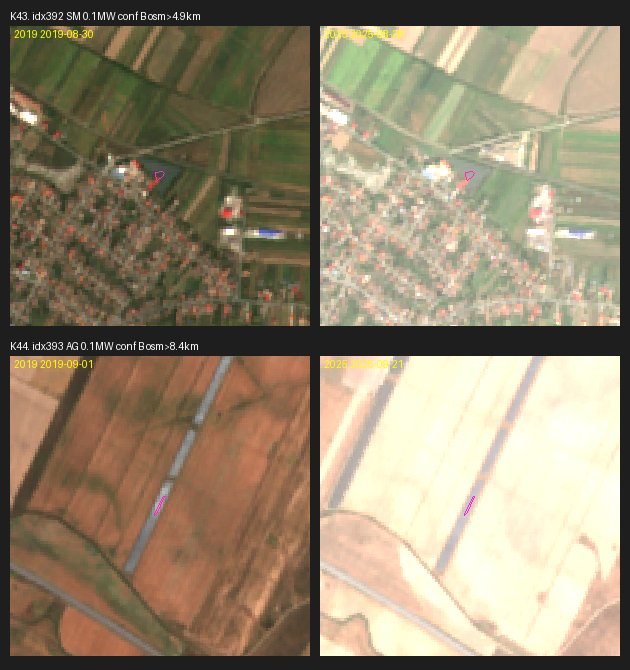
Of this inventory's detections, 354 have a solar feature on OpenStreetMap (a park or a row of panels) within 1.5 km. The other 44 were all inspected on Sentinel-2 images from summer 2019 and summer 2025: 17 are parks with panels, 4 are dark rectangles that could be panels or ponds, 14 are roofs or buildings, 3 fall on an irrigation canal, and 6 are too small for 10 metres a pixel. The certain misdetections, 17 of 398, add up to only 10.7 MW of 1,904.
The 2018 inventory tables
The largest parks in the 2018 inventory
| County | Calculated MW | ha | Coordinates |
|---|---|---|---|
| Giurgiu | 100.2 | 132 | 43.986; 25.768 |
| Satu Mare | 80.0 | 106 | 47.867; 23.055 |
| Prahova | 38.0 | 50 | 44.944; 25.878 |
| Prahova | 37.9 | 50 | 44.935; 26.092 |
| Mehedinți | 34.2 | 44 | 44.225; 22.894 |
| Sibiu | 32.1 | 42 | 45.897; 23.742 |
| Arad | 31.4 | 41 | 46.427; 22.106 |
| Giurgiu | 31.3 | 41 | 44.361; 25.620 |
| Giurgiu | 30.2 | 39 | 43.876; 25.888 |
| Argeș | 24.4 | 32 | 44.569; 25.201 |
The 2018 inventory by county
| County | Parks | Calculated MW | ha | Share of MW |
|---|---|---|---|---|
| Giurgiu | 27 | 301 | 385 | 15.8% |
| Prahova | 28 | 205 | 263 | 10.8% |
| Satu Mare | 21 | 126 | 162 | 6.6% |
| Olt | 20 | 112 | 139 | 5.9% |
| Dolj | 20 | 104 | 129 | 5.4% |
| Brașov | 27 | 94 | 114 | 4.9% |
| Cluj | 15 | 84 | 106 | 4.4% |
| Bihor | 33 | 79 | 94 | 4.2% |
| Dâmbovița | 20 | 72 | 87 | 3.8% |
| Teleorman | 18 | 63 | 78 | 3.3% |
| Timiș | 24 | 63 | 74 | 3.3% |
| Călărași | 7 | 61 | 76 | 3.2% |
| Mehedinți | 6 | 60 | 75 | 3.1% |
| Brăila | 15 | 58 | 69 | 3.1% |
| Arad | 12 | 56 | 69 | 2.9% |
| Sibiu | 10 | 53 | 66 | 2.8% |
| Argeș | 14 | 51 | 62 | 2.7% |
| Mureș | 14 | 40 | 47 | 2.1% |
| Gorj | 6 | 32 | 37 | 1.7% |
| Bistrița-Năsăud | 5 | 31 | 40 | 1.7% |
| Tulcea | 4 | 17 | 22 | 0.9% |
| Bacău | 3 | 16 | 20 | 0.8% |
| Ialomița | 9 | 16 | 20 | 0.8% |
| Covasna | 6 | 15 | 17 | 0.8% |
| Vrancea | 3 | 14 | 18 | 0.7% |
| Maramureș | 3 | 13 | 15 | 0.7% |
| Buzău | 5 | 12 | 14 | 0.6% |
| Vâlcea | 3 | 11 | 13 | 0.6% |
| Harghita | 2 | 9 | 11 | 0.5% |
| Ilfov | 7 | 9 | 10 | 0.5% |
| Botoșani | 1 | 8 | 9 | 0.4% |
| Constanța | 2 | 7 | 8 | 0.4% |
| Iași | 2 | 6 | 7 | 0.3% |
| Alba | 3 | 6 | 7 | 0.3% |
| București | 2 | 1 | 2 | 0.1% |
| Sălaj | 1 | 0 | 0 | 0.0% |
#How the count was made and where it stops
Parks up to mid-2024 come from Global Renewables Watch (Robinson and colleagues, 2025), 400 polygons in Romania, each with the quarter in which it first appears. Each polygon's area is measured on the ellipsoid. 9 of the polygons were taken by the authors from OpenStreetMap rather than detected; they stay on the map with the inventory's date.
The OpenStreetMap part of the second wave covers power=plant, plant:source=solar outlines of at least one hectare that the satellite polygons (with a 25 m tolerance) cover less than half of. A map outline includes the fence, the tracks and the gaps between rows. On the 255 parks the satellite covers at least half of, the satellite polygon fills 89% of the outline; that ratio scales the new hectares to panel area, minus whatever the satellite already counts. The part of an outline that overlaps a detection in the 2018 inventory is old: if it is at least half, the park moves to the first wave, otherwise it is subtracted; likewise, satellite polygons dated after 2018 that half-overlap a 2018 detection move to the first wave. The open map is incomplete, so the second wave is a lower bound.
The Sentinel-2 tests use the least cloudy image (under 3%) covering the whole site, in natural colour, with the park outline drawn on top; each cut-out was read by eye. The sheets with every cut-out: 1 · 2 · 3 · 4 · 5 · 6 · 7 · 8 · 9 · 10 · 11 · 12 · 13 · 14 · 15 · 16 · 17.
Megawatts come from Transelectrica for the first wave and for 2025, from RPIA (the Romanian Photovoltaic Industry Association) estimates for 2024 and 2025, and from ANRE for prosumers and approvals. The result card estimates a park's megawatts from its panel area: 0.45 MW a hectare for the first wave and quiet years, 1.04 MW a hectare for new parks, or the capacity given on OpenStreetMap where there is one and it is plausible. Homes assume 1,250 kWh produced a year by each kW and 2,500 kWh used by a home in a year. The result gives a scale, not a measurement.
Communes and counties come from the 2025 boundaries of Romania's administrative units. Rounding: hectares to whole numbers, percentages to one decimal, megawatts to whole numbers.
Sources
- Robinson, C. et al. (2025), Global Renewables Watch: A Temporal Dataset of Solar and Wind Energy Derived from Satellite Imagery, arXiv:2503.14860; dataset solar_all_2024q2_v1 (GitHub microsoft/global-renewables-watch, MIT).
- Kruitwagen, L. et al. (2021), A global inventory of photovoltaic solar energy generating units, Nature 598; Zenodo 10.5281/zenodo.5005868.
- OpenStreetMap contributors, ODbL; Overpass and the OSM API, 6 Nov 2026 (power=plant, plant:source=solar).
- Copernicus Sentinel-2 L2A (2016–2026), via Microsoft Planetary Computer. Contains modified Copernicus Sentinel data 2016–2026.
- pv magazine, 16 Feb 2015 and 13 Apr 2018 (Transelectrica figures); 14 Jan 2026 (RPIA).
- Transelectrica, national power system presentation for CIGRE, 2026 ("Solar power: 2779,18 MW").
- ANRE, briefing on renewable projects of at least 1 MW, 1 March 2026; prosumers in September 2025, according to ANRE vice-president Gabriel Andronache (stiripesurse.ro, 10 Nov 2025).
- Administrative-unit boundaries 2025 (ANCPI, via geo-spatial.org).