Chapter 10 · Humans and the biosphereLesson 10.2
Climate change and global warming: causes and effects on living things
Why does a freezing winter not disprove global warming, and what does a warmer climate change in the lives of plants and animals?
- Size
- from 6 km to 12,742 km
- Level
- biosphere
- Time
- from 1958 to today
Before you read: what do you think?
At the Mauna Loa observatory in Hawaii, the annual average of carbon dioxide in the air was 315.98 ppm in 1959. What was it in 2025?
See the answer
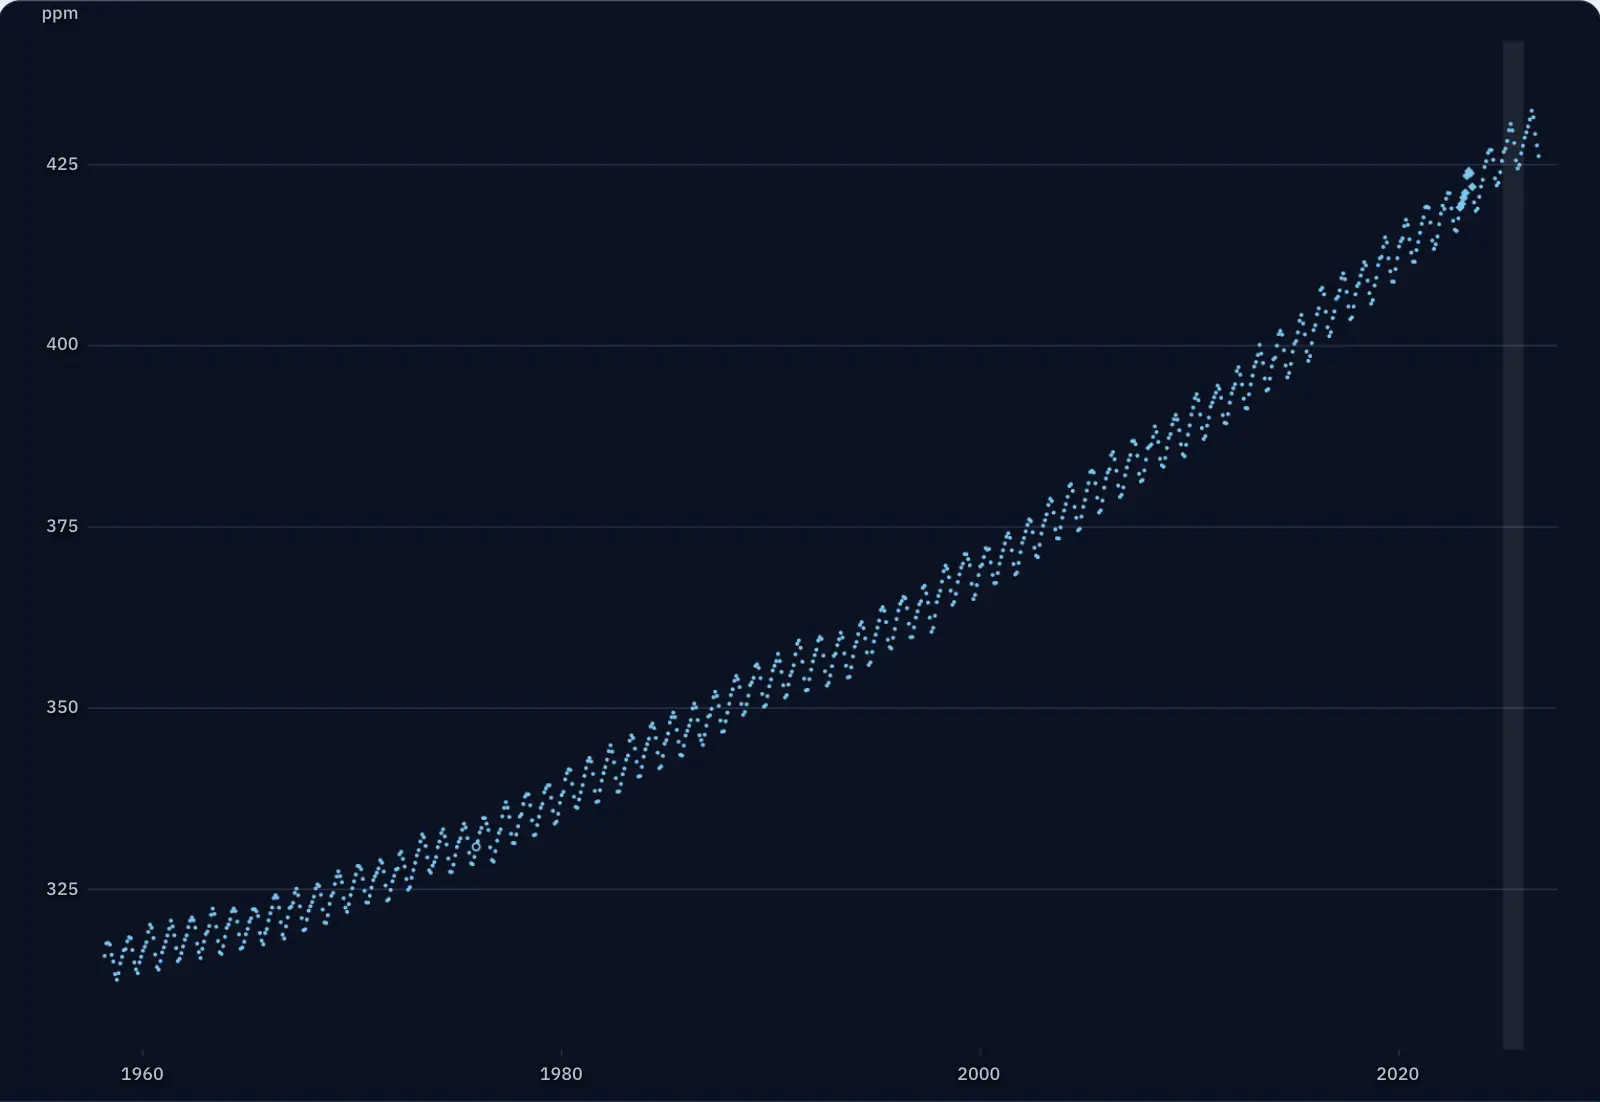
The 2025 average was 427.35 ppm, about 35% higher than in 1959. The rise was not equally fast in every decade: in the 1960s the concentration climbed by less than 1 ppm a year, and in the last decade by more than 2.5 ppm a year.
Since March 1958, on the Mauna Loa volcano in Hawaii, the amount of carbon dioxide in the air has been measured almost without a break. The average for 1959 was 315.98 ppm, and the average for 2025, 427.35 ppm. Over the same period the planet’s average temperature has risen, and plants, animals and corals have begun to respond to the change.
Weather changes from day to day, climate is measured in decades
Weather is the state of the atmosphere at one place and one moment: today’s temperature, rain and wind. Climate is the usual weather of a place, worked out from many years of observations. For its reference climate values, the World Meteorological Organization uses 30-year averages.
That is why a freezing day or winter does not disprove global warming, just as a single very hot summer does not prove it. Global warming is the rise in the average temperature of the Earth’s surface over long periods, and climate change also covers the other consequences: different rainfall patterns, more heatwaves, melting glaciers, rising sea level.
Some gases keep heat close to the Earth’s surface
The surface warmed by the Sun gives off infrared radiation, that is, thermal radiation. Some gases in the atmosphere absorb part of this radiation and emit it again, including back towards the ground. This is called the greenhouse effect, and the gases that cause it are greenhouse gases: carbon dioxide (CO2), methane (CH4), nitrous oxide (N2O) and water vapour. The natural greenhouse effect keeps the Earth’s average temperature at around 15 °C.
The amount of water vapour depends on temperature: warmer air holds more vapour, which amplifies the warming started by the other gases. It is the concentrations of CO2, CH4 and N2O that have risen because of human activities. Compared with 1750, CO2 has risen by 47%, methane by 156% and nitrous oxide by 23%. The main sources are burning coal, oil and natural gas, deforestation and agriculture.
The concentration of CO2 is given in ppm (parts per million): 427 ppm means that out of every million molecules of dry air, 427 are carbon dioxide. The value is a concentration. It is not a temperature, nor the amount emitted in a year.
| Year | Annual mean | Rise per year | Mean yearly swing |
|---|---|---|---|
| 1959 | 315.98 | 1959–1969: 0.86 | 1959–1968: 5.93 |
| 1969 | 324.62 | 1969–1979: 1.22 | 1969–1978: 6.14 |
| 1979 | 336.84 | 1979–1989: 1.64 | 1979–1988: 6.39 |
| 1989 | 353.20 | 1989–1999: 1.53 | 1989–1998: 6.45 |
| 1999 | 368.54 | 1999–2009: 1.91 | 1999–2008: 6.36 |
| 2009 | 387.64 | 2009–2019: 2.40 | 2009–2018: 6.81 |
| 2019 | 411.65 | 2019–2025: 2.62 | 2019–2025: 6.74 |
| 2025 | 427.35 | – | – |
First monthly mean: 315.71 ppm (March 1958); last: 426.07 ppm (September 2026). In 61 of the 67 full years (1959–2025), the highest monthly mean was in May; in the others, in April (four years) or June (two years); the lowest, in September (40 years) or in October (27 years). Mean swing over 2016–2025, calculated against the straight line of each year: 5.06 ppm at Mauna Loa, 0.95 ppm at the South Pole.
Measurements and calculation. Each dot is a monthly mean calculated from measurements; a few missing months are filled in by NOAA by interpolation; the annual means are those published by NOAA. The yearly swing (the month’s mean minus the seasonally corrected value calculated by NOAA, the largest minus the smallest within a year), the rates per decade and the differences are calculated from them. Data: NOAA Global Monitoring Laboratory (Xin Lan) and Scripps Institution of Oceanography (Ralph Keeling), the Mauna Loa monthly file of 9 October 2026; the measurements from March 1958 to April 1974 are by C. David Keeling (Scripps). Because of the Mauna Loa eruption, the months December 2022 to July 2023 were measured at Maunakea, about 34 km to the north (diamonds; until 4 July 2023). Empty circles are months filled in by NOAA by interpolation (only one after 1974, December 1975); for 1958–1974 the file does not say which months were filled in. South Pole: NOAA GML, continuous in situ measurements (Pétron et al., 2026, doi:10.15138/yaf1-bk21). NOAA data are freely available to the public (South Pole series: CC0 1.0, waiver of rights); the Scripps data (1958–1974) are licensed CC BY 4.0, with credit to the Scripps Institution of Oceanography, UC San Diego.
How much the planet has warmed, and why
In its 2021 report, the Intergovernmental Panel on Climate Change (IPCC) showed that the average temperature at the Earth’s surface in 2011–2020 was 1.09 °C higher than in 1850–1900, the period used as the reference for pre-industrial times. Land has warmed more (1.59 °C) than the ocean (0.88 °C).
The IPCC concludes that it is unequivocal that human influence has warmed the atmosphere, ocean and land. The best estimate of the warming caused by humans between 1850–1900 and 2010–2019 is 1.07 °C. Between 1901 and 2018 the average sea level rose by 0.20 m.
What changes in the lives of organisms
Phenology is the calendar of recurring events in the lives of organisms: leaves opening, flowering, insects emerging, birds migrating. In the northern hemisphere outside the tropics, the growing season has lengthened on average by up to two days per decade since the 1950s. If a plant flowers earlier but the insect that pollinates it still emerges on the old date, the two species can miss each other.
Ranges are moving. The IPCC reports that about half of the species assessed worldwide have shifted their range towards the poles or, on land, also to higher altitudes. Some mountain and polar ecosystems, as well as some coral reefs, have already reached their natural limits of adaptation.
In the sea, water that is too warm makes corals expel the microscopic algae that live in their tissues and give them food and colour. This is called coral bleaching; if it lasts, the corals die. On 15 April 2024 NOAA confirmed the fourth global bleaching event, and between 1 January 2023 and 30 September 2025 the heat stress that causes bleaching reached about 84.4% of the area of the world’s coral reefs.
The ocean dissolves part of the CO2 emitted, and the water becomes more acidic. This ocean acidification makes it harder to build shells and skeletons of calcium carbonate. According to the IPCC, human CO2 emissions are virtually certain to be the main cause of the current acidification of the open ocean.
For the curious
The IPCC also reports that hundreds of local losses of species have been caused by increasingly severe heatwaves, and that the first extinctions of species caused by climate change have already happened (medium confidence).
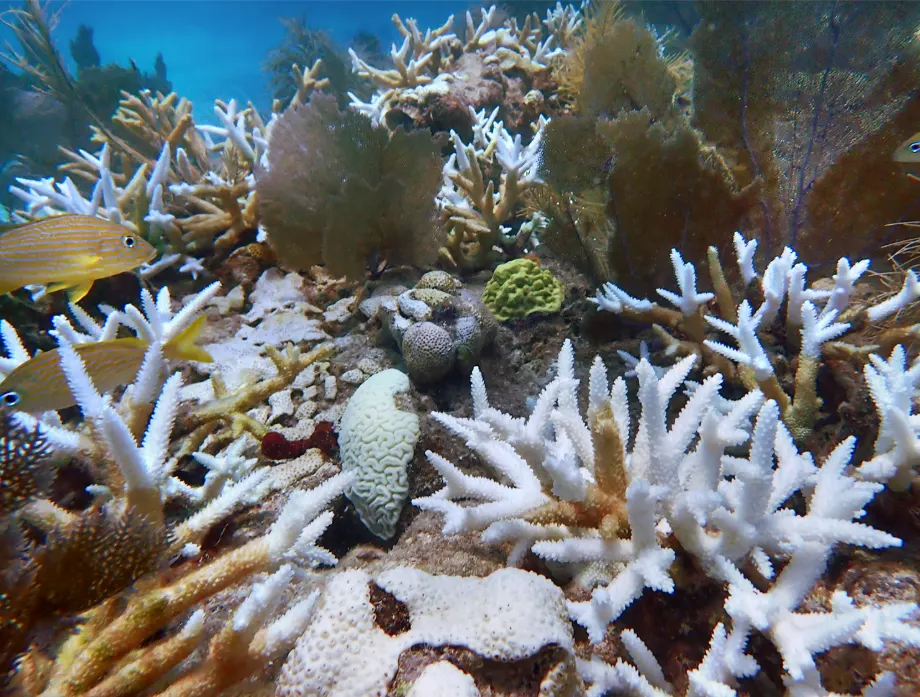
Photo: Ananda Ellis/NOAA, Public domain, source. Unchanged.

Two responses: mitigation and adaptation
Mitigation means cutting greenhouse gas emissions or increasing the amount of carbon held by forests, soils and other reservoirs. Adaptation means preparing people and ecosystems for the climate that has already changed and for the climate still to come: trees that shade the streets, water stored for dry spells, crops suited to hotter summers, corridors through which species can reach cooler places.
The two complement each other. Adaptation reduces the damage now, and mitigation decides how large a change your generation will have to adapt to.
Worked example
Reading the Mauna Loa curve
The NOAA annual averages are: 315.98 ppm in 1959, 324.62 ppm in 1969, 401.01 ppm in 2015 and 427.35 ppm in 2025.
Over the whole period the rise is 427.35 − 315.98 = 111.37 ppm in 66 years, an average of 1.69 ppm a year. Between 1959 and 1969 the concentration rose by 8.64 ppm, so 0.86 ppm a year. Between 2015 and 2025 it rose by 26.34 ppm, so 2.63 ppm a year, about three times as fast.
Now look up the year you were born. For 2011 the average was 391.85 ppm, so by 2025 the air had gained 35.50 ppm.
Between December 2022 and 4 July 2023, after the eruption of the Mauna Loa volcano, the air was measured at the observatories on Maunakea, about 34 km to the north. The graph shows the concentration of one gas at a single place, far from cities. It does not show temperature directly, nor how much a particular country has emitted.
In Romania
The year 2024 and the tiger mosquito
According to the National Meteorological Administration (ANM), Romania’s weather service, the average temperature across the country in 2024 was 11.6 °C, 2.0 °C above the median of the 1991–2020 reference period. That puts it first in the ranking of the warmest years, drawn up from the data of 129 weather stations with complete measurements since 1961.
In the autumn of 2012, 45 tiger mosquitoes (Aedes albopictus) were caught in the south of Bucharest, the first record of the species in Romania. The species reached Europe as eggs carried in used tyres and in ornamental plants. Milder winters, longer summers and higher temperatures help it settle further and further north. In August 2025 the European Centre for Disease Prevention and Control reported the tiger mosquito established in 369 regions of 16 European countries, against 114 regions a decade earlier.
In short
- Weather is the state of the atmosphere at one moment; climate is the usual weather of a place, worked out from observations over decades, usually 30 years.
- The greenhouse effect is the trapping, by gases such as CO2, CH4, N2O and water vapour, of part of the infrared radiation given off by the Earth’s surface; the natural effect keeps the planet’s average at around 15 °C.
- At Mauna Loa, the annual average of CO2 rose from 315.98 ppm in 1959 to 427.35 ppm in 2025, mainly because of the burning of fossil fuels and deforestation.
- According to the IPCC, in 2011–2020 the global average temperature was 1.09 °C above that of 1850–1900, and the warming is unequivocally caused by humans.
- Organisms respond through changes in phenology, range shifts towards the poles and to higher altitudes, and coral bleaching; the ocean is becoming more acidic.
- Mitigation cuts emissions or increases the uptake of carbon; adaptation prepares people and ecosystems for the changed climate.
Common mistakes
WrongThis winter was freezing, so global warming does not exist.
RightA winter is weather. Global warming shows up in averages over decades, and these have risen even though some winters are cold.
WrongGlobal warming is caused by the hole in the ozone layer.
RightThey are two different phenomena. The ozone layer stops part of the ultraviolet radiation; the warming comes from the rise in the gases that trap the infrared radiation given off by the Earth.
WrongThe greenhouse effect is entirely bad and should disappear.
RightThe natural greenhouse effect keeps the planet’s average at around 15 °C and makes life possible. The problem is its intensification by the gases humans add.
Check yourself
Seven questions. For the first six you see the explanation at once, with the paragraph of the lesson that supports it; for the written ones you compare with a good answer.
This winter a city had three days at −20 °C. What can you say from them about global warming?
Answer
b) Nothing: three days are weather, and climate is judged from averages over decades. Climate is worked out from observations over many years, usually 30. A few cold days are a variation in the weather.
What does a value of 427 ppm for CO2 mean?
Answer
c) Out of a million molecules of dry air, 427 are CO2. ppm is a concentration: a number of molecules per million. It is neither a temperature nor an annual emission.
Which of these gases has increased the most, in percentage terms, since 1750?
Answer
d) Methane. Methane has risen by 156%, carbon dioxide by 47%, nitrous oxide by 23%. Oxygen is not a greenhouse gas.
What change in range did the IPCC document for about half of the species assessed?
Answer
a) A shift towards the poles or to higher altitudes. Species follow the temperatures that suit them, and these are moving towards the poles and up mountains.
A pupil was born in 2011, when the annual average at Mauna Loa was 391.85 ppm. In 2025 the average was 427.35 ppm. By how many ppm has the CO2 concentration risen since the pupil was born?
ppmAnswer
35.5 ppm. 427.35 − 391.85 = 35.50 ppm.
The CO2 average at Mauna Loa was 401.01 ppm in 2015 and 427.35 ppm in 2025. By how many ppm did it rise, on average, each year? Round to two decimal places.
ppm/yearAnswer
2.63 ppm/year. (427.35 − 401.01) ÷ 10 = 26.34 ÷ 10 = 2.634, or about 2.63 ppm a year.
The council of a town in the Bărăgan plain wants to plant trees along the streets and replace its diesel buses with electric ones. Which measure is mitigation and which is adaptation? Explain.
A good answer
Electric buses cut the emissions from burning diesel in the town, so they are a mitigation measure, and a better one the more of the electricity comes from low-emission sources. Trees shade the streets and lower the temperature during heatwaves, so they are first of all adaptation; while they grow they also take up carbon, so they help a little with mitigation too.
A complete answer defines mitigation (fewer emissions or more carbon taken up) and adaptation (preparing for the changed climate) and notices that one measure can serve both.
Terms
- climate
- The usual weather of a place, worked out from observations over many years, usually 30.
- greenhouse effect
- The trapping in the atmosphere, by certain gases, of part of the infrared radiation given off by the Earth’s surface.
- greenhouse gases
- Gases that absorb and emit infrared radiation: carbon dioxide, methane, nitrous oxide, water vapour and others.
- global warming
- The long-term rise in the average temperature of the Earth’s surface.
- phenology
- The calendar of recurring events in the lives of organisms, such as flowering, migration or the emergence of insects.
- coral bleaching
- The expulsion by corals, in water that is too warm, of the microscopic algae that live in their tissues.
- mitigation
- Cutting greenhouse gas emissions or increasing the carbon held by reservoirs.
- adaptation
- Preparing people and ecosystems for the changed climate, so that the damage is smaller.
Sources and link to the programme
- NOAA Global Monitoring Laboratory – Mauna Loa CO2 annual mean data (data accessed on 15 November 2026) – annual averages for 1959 (315.98), 1969 (324.62), 2011 (391.85), 2015 (401.01), 2025 (427.35 ppm)
- NOAA Global Monitoring Laboratory – Trends in Atmospheric Carbon Dioxide – the Mauna Loa measurements were started by C. David Keeling (Scripps) in March 1958; ppm as a mole fraction in dry air; the observations from December 2022 to 4 July 2023 come from Maunakea, about 21 miles (34 km) to the north, after the Mauna Loa eruption
- WMO – Weather – standard climate values are calculated over 30 years
- NASA Science – What is the greenhouse effect? – greenhouse gases; the natural greenhouse effect and the 15 °C average; water vapour as a feedback
- IPCC AR6 WGI (2021) – Summary for Policymakers – A.1 (unequivocal), A.1.2 (1.09 °C in 2011–2020; land 1.59, ocean 0.88), A.1.3 (1.07 °C caused by humans), A.1.6 (acidification), A.1.7 (0.20 m), A.1.8 (the growing season, up to two days per decade), A.2.1 (+47% CO2, +156% CH4, +23% N2O since 1750)
- IPCC AR6 WGII (2022) – Summary for Policymakers – B.1.2: about half of the species assessed have shifted towards the poles or to higher altitudes; local losses; B.1.1: coral bleaching; the definition of adaptation (footnote 10); C.3.3: some coral reefs and some polar and mountain ecosystems have reached their natural limits of adaptation
- NOAA Coral Reef Watch – Global Bleaching: Status Update (updated 2 June 2026) – the fourth global event confirmed on 15 April 2024; ~84.4% of reef area affected by heat stress between 1 January 2023 and 30 September 2025
- NOAA Ocean Service – What is coral bleaching? – corals expel the symbiotic algae (zooxanthellae) from their tissues when the water is too warm; the algae are the corals’ main source of food and give them their colour; prolonged stress kills the coral
- NOAA Ocean Service – What is ocean acidification? – the fall in carbonate ions makes it harder to build shells and skeletons of calcium carbonate (oysters, clams, sea urchins, corals, calcareous plankton)
- ANM – Caracterizarea climatică a anului 2024 – 11.6 °C; +2.0 °C against the 1991–2020 median; first place in the ranking based on 129 stations with a complete series for 1961–2024
- Prioteasa et al., Journal of the American Mosquito Control Association 31(2), 2015 – Established population of Aedes albopictus in Romania, 2012–14 – autumn 2012: 45 adult Aedes albopictus in the south of Bucharest; an established population
- ECDC – Aedes albopictus, factsheet for experts – spread through used tyres and “lucky bamboo”; the first record in Europe (Albania, 1979)
- ECDC – World Mosquito Day 2025 (August 2025) – 369 regions in 16 countries, against 114 a decade earlier; higher temperatures, longer summers, milder winters
From the programme: “Climate change – global warming; the ecological footprint – the two perspectives: footprint and handprint (the ecological footprint and the positive ecological footprint)” (common core). Specific competences addressed: 2.1, 2.2, 4.2.