Chapter 10 · Humans in living systems
Where does the carbon people burn end up, and how does a whole planet breathe?
- Size
- from 6 km to 12,742 km
- Level
- biosphere
- Time
- from 1958 to today
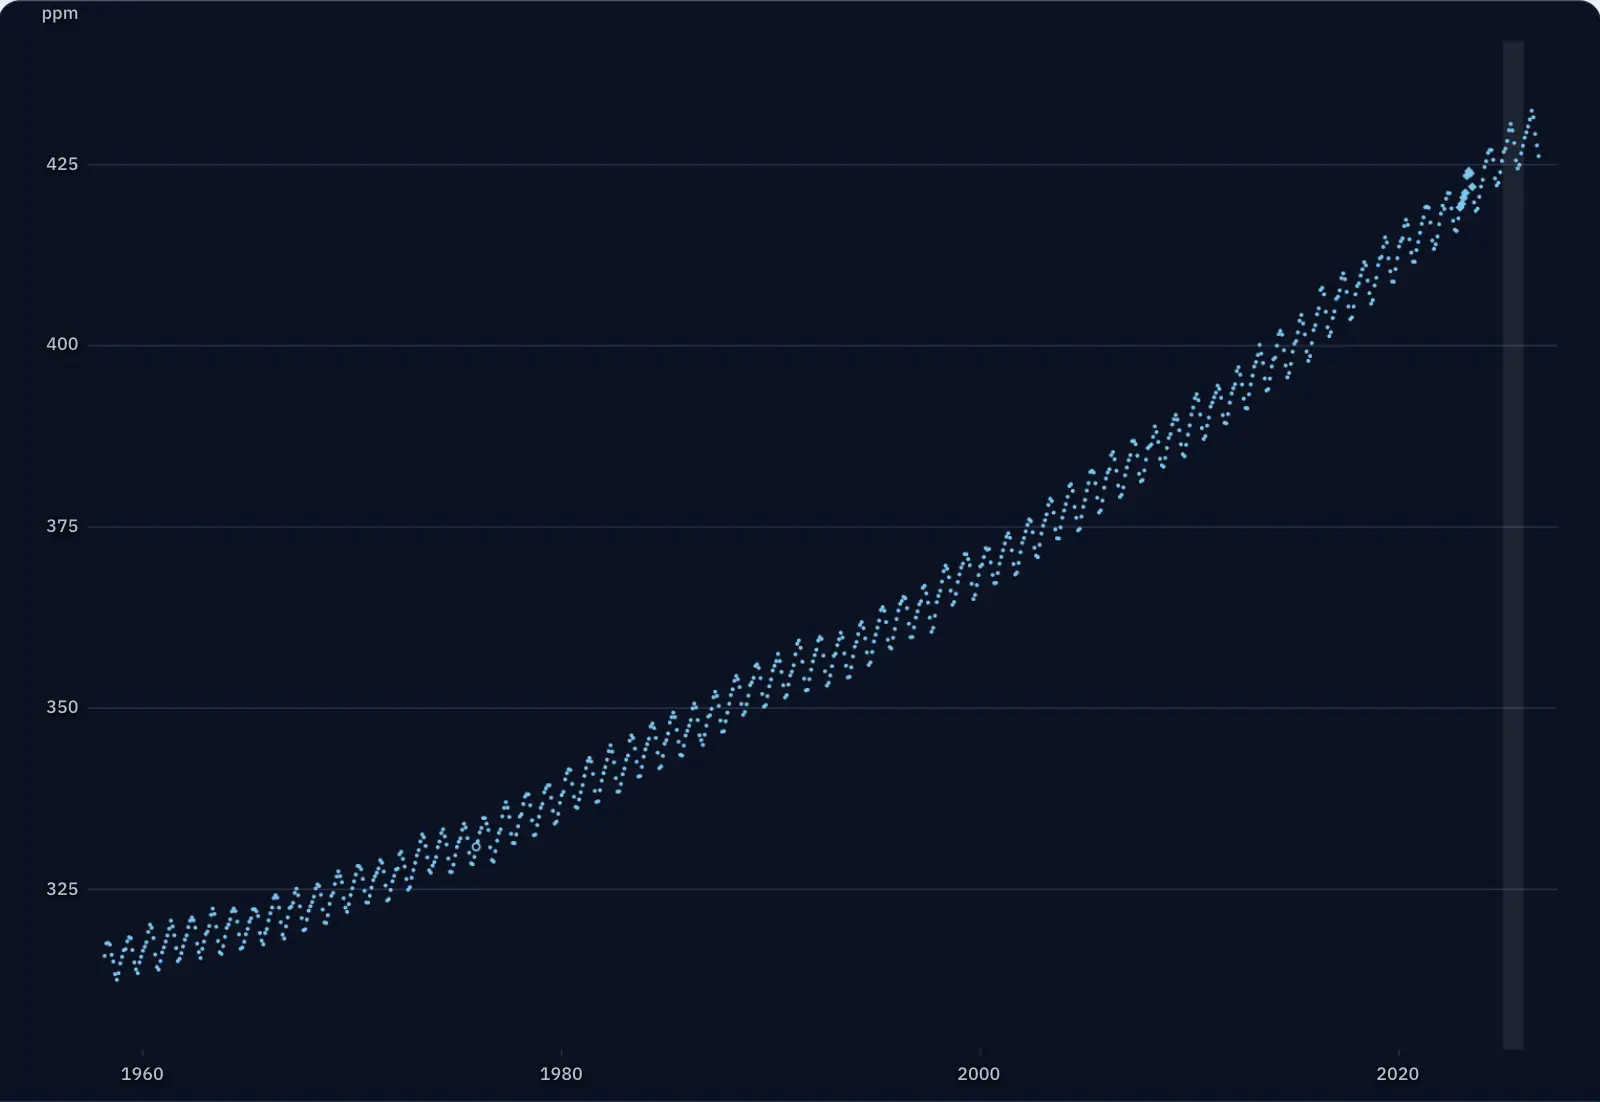
The dots beside the text are the monthly means of carbon dioxide in the air above the Mauna Loa volcano in Hawaii, 3,400 metres up and far from cities, calculated from measurements: 823 months, from March 1958 to September 2026. Watch what the carbon in the air does from one season to the next and from one decade to the next.
The curve has a sawtooth every year
The bright band covers a single year, 2025. Inside it, the points rise and then fall, and the sawtooth repeats year after year, from 1958 to today.
In which month of the year do you think the air at Mauna Loa has the most CO₂?
First monthly mean: March 1958, 315.71 ppm
The measurements at Mauna Loa were begun in March 1958 by Charles David Keeling of the Scripps Institution of Oceanography in California. NOAA, the American agency for ocean and atmosphere, has also made them since May 1974.
The first monthly mean in the NOAA file is 315.71 ppm: of every million molecules of dry air, almost 316 were CO₂. The last, from September 2026, is 426.07 ppm.
Every year, CO₂ rises until the end of spring and falls until autumn
Here is the year 2025 up close: the most CO₂ in May (430.51 ppm), the least in September (424.37 ppm). In 61 of the 67 full years (1959–2025), the highest monthly mean was in May; in the others, in April (four years) or June (two years); the lowest, in September (40 years) or in October (27 years).
The swing comes from the plants on land. In the growing season, photosynthesis takes more CO₂ out of the air than respiration releases; in autumn and winter, respiration and the decay of leaves and roots give it back. Most of the land lies in the northern hemisphere, so the air at Mauna Loa follows its seasons.
If the rise from year to year is taken out of each month, the difference between the month richest in CO₂ and the month poorest in it averaged 6.39 ppm a year in 1959–2025.
Without the seasons, a faster and faster rise remains
The green squares are the same months, with NOAA’s mean seasonal swing taken out. What remains rises: the annual mean was higher than in the year before in every year from 1960 to 2025.
Between 1959 and 1969, the mean rose by 8.64 ppm, that is 0.86 ppm per year. Between 2015 and 2025 it rose by 26.34 ppm, that is 2.63 ppm per year, about three times as fast.
The rise follows the burning of coal, oil and natural gas, with deforestation added.
In the year you were born, the air had less CO₂
Type the year you were born. The dotted line marks it on the curve, and below appear the mean of that year, the mean of 2025 and the difference.
For example, for 2011 the mean was 391.85 ppm, so by 2025 the air had gained 35.50 ppm.
One kilogram of carbon burned gives 3.67 kilograms of CO₂
A carbon atom has a mass of 12, and a CO₂ molecule, with its two oxygen atoms, has a mass of 44. When carbon burns, the mass grows by a factor of 44/12: 1 kg C becomes 3.67 kg CO₂.
This is how large numbers are read. According to the Global Carbon Project’s estimate, burning fossil fuels and making cement added about 10.3 billion tonnes of carbon to the air in 2024 (with a margin of ±0.5 billion tonnes), which is 37.8 billion tonnes of CO₂.
A worked example: 1 ppm in the whole atmosphere means 2.124 billion tonnes of carbon. The mean at Mauna Loa rose from 2024 to 2025 by 2.74 ppm; if all the air on the planet had risen by the same amount, it would have gained 5.8 billion tonnes of carbon, that is 21.3 billion tonnes of CO₂. The kilogram of CO₂e, used in carbon footprint calculations, is a third quantity: it adds up other gases too, weighted by how much they warm.
Now you explain: why are the seasons barely visible at the South Pole?
The triangles are the monthly means at the South Pole, measured continuously by NOAA (Pétron and colleagues, 2026). For each year in 2016–2025, the rise during the year was removed (the straight line that passes closest to the 12 months) and what remains was measured. The mean swing is 0.95 ppm at the South Pole and 5.06 ppm at Mauna Loa, more than five times larger. This calculation differs from the one that gives the mean swing of 6.39 ppm, which is why Mauna Loa has a different value here.
What does the northern hemisphere have that the southern one lacks? Use what you have learned about photosynthesis and respiration.
Compare with an answer
The yearly swing comes from the imbalance, from one season to the next, between photosynthesis and respiration in plants on land. The northern hemisphere has most of the continents, and so most of the forests and grasslands that take CO₂ out of the air in summer and release it in winter. The southern hemisphere is covered mostly by ocean, and the South Pole lies far from any vegetation, so the air there barely moves with the seasons. The rise from year to year shows in both places, however.
The lesson on climate change, with the worked example and questions