Chapter 5 · Levels of organisationLesson 5.3CS
The population: size, density, natality, mortality, migration
Between 2014 and 2019, the free-roaming bison of Vânători-Neamț Nature Park, in north-eastern Romania, went from 20 to 47. Where did the 27 extra animals come from, and how far can the herd grow?
- Size
- from 10 µm to 20 km
- Level
- from tissue to ecosystem
- Time
- a season
Before you read: what do you think?
Between 2014 and 2019, the free-roaming bison of Vânători-Neamț went from 20 to 47. What happened to their density, that is, the number of bison per 1,000 hectares of the area used by the herd?
See the answer
It fell, from 2.9 to 1.6 bison per 1,000 ha. The herd grew, but the area it uses grew even faster, from about 6,800 ha to 30,100 ha. Density is population size divided by area, so it depends on both.
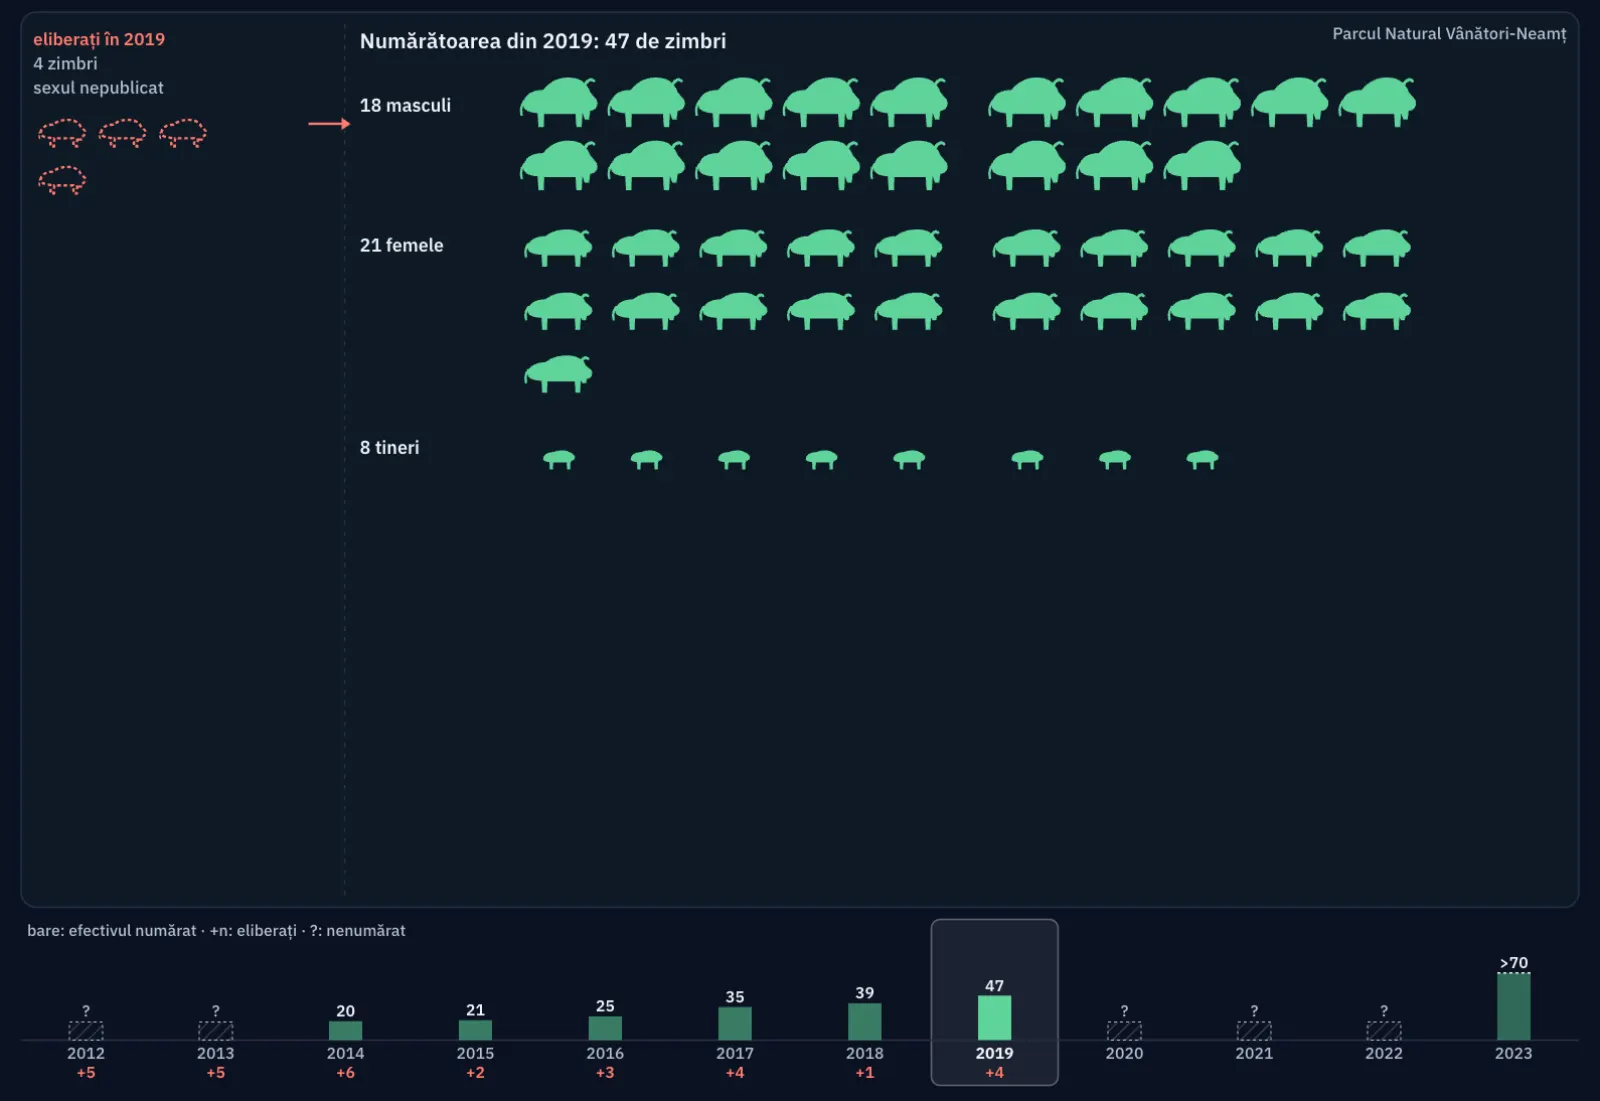
On 22 March 2012, the first five bison were released in Vânători-Neamț Nature Park. Another 25 were brought in by 2019; in 2019 the free-roaming herd numbered 47 bison, and by 2023 it was over 70. Every change in this number comes down to four kinds of event: births, deaths, arrivals and departures.
How big a population is and how it is made up
Population size is the total number of individuals, written N. Density is population size per unit of area or volume: bison per 1,000 hectares, algae per litre of water. In 2019, the 47 bison of Vânători-Neamț used about 30,100 ha, which works out at 1.6 bison per 1,000 ha. In 2014, density had been 2.9 bison per 1,000 ha, with 20 bison on about 6,800 ha. Population size went up, but density went down, because the area used by the herd grew even faster.
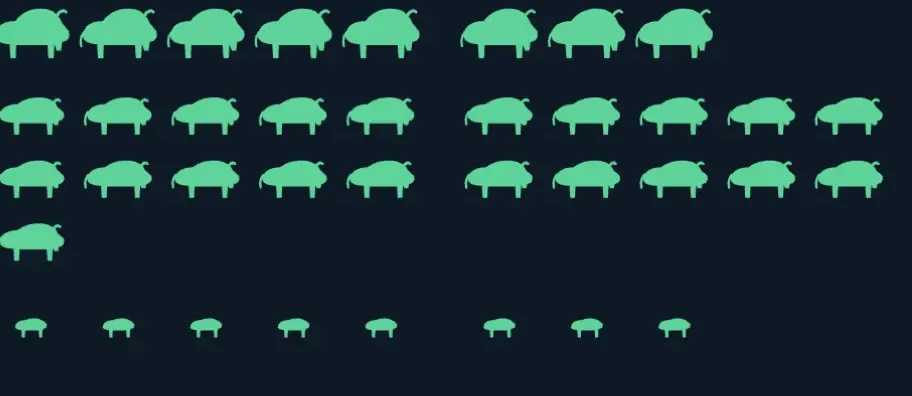
Age and sex structure shows how many individuals are young, adult or old, and how many are males and how many females. In 2019, the free-roaming herd at Vânători-Neamț had 18 males, 21 females and 8 young. A population with many adult females and many young can grow fast; one made up mostly of old individuals shrinks.
Spatial distribution shows how the individuals are spread out. It can be uniform, when individuals keep almost equal distances, like penguins defending their nest sites; random, like dandelions, whose seeds land wherever the wind carries them; or clumped, like bison, which live in herds led by adult females.
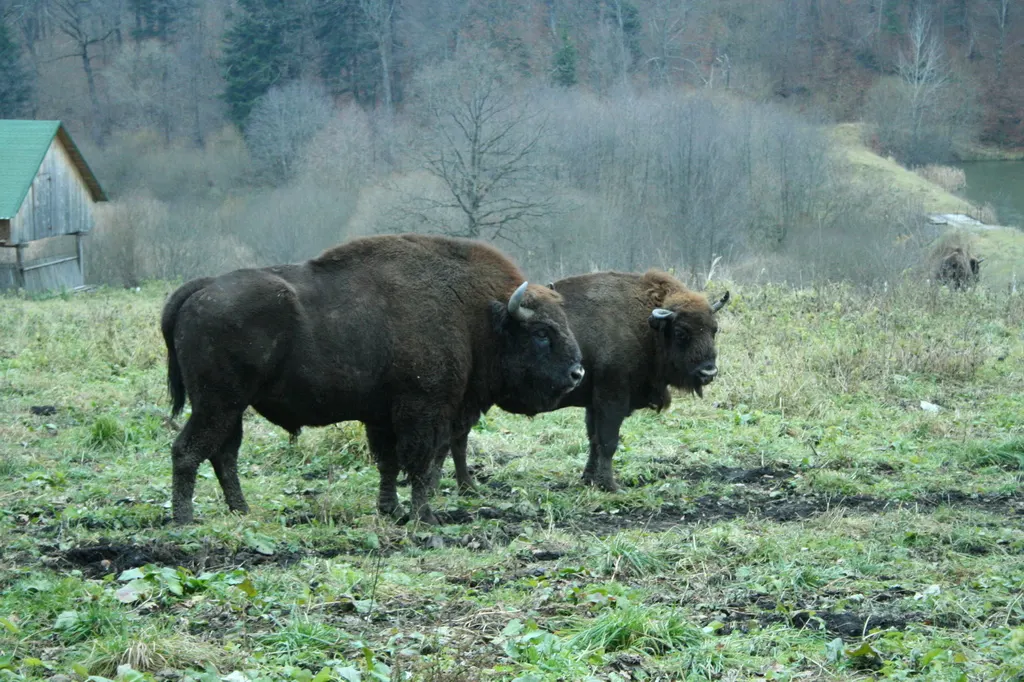
Photo: Ccezar2004, Public domain, source. Unchanged.

Four flows change population size
Natality is the number of individuals born in a given interval, usually a year; mortality is the number of individuals that die in the same interval. Both can also be expressed as a rate, for example per 1,000 individuals. Immigration means individuals entering the population from elsewhere; emigration means individuals leaving it. The bison brought from zoos and reserves and released in the park are, for the free-roaming population, immigrants.
The balance of a population over an interval is written: N₁ = N₀ + n − d + i − e, where N₀ is the population size at the start, N₁ the size at the end, n the number of births, d the number of deaths, i the number of immigrants and e the number of emigrants. All of them are numbers of individuals, counted over the same interval and in the same area.
A population size that stays the same does not prove that nothing happened. If ten individuals are born and ten die, N₁ = N₀, even though part of the population has been replaced.
| Interval | Released (i) | Herd counted (N₁) | Males / females / young | With releases only | n − d − e (calculated) |
|---|---|---|---|---|---|
| 2012 | 5 (3 males, 2 females) | not published | – | – | unknown |
| 2013 | 5 | not published | – | – | unknown |
| 2012–2014 | 16 | 20 | 6 / 10 / 4 | 16 | +4 |
| 2015 | 2 | 21 | 8 / 12 / 1 | 22 | −1 |
| 2016 | 3 | 25 | 11 / 13 / 1 | 24 | +1 |
| 2017 | 4 | 35 | 13 / 16 / 6 | 29 | +6 |
| 2018 | 1 | 39 | 16 / 20 / 3 | 36 | +3 |
| 2019 | 4 | 47 | 18 / 21 / 8 | 43 | +4 |
| 2020–2023 | 0 | over 70 | not published | 47 | over 23 |
| 2012–2023, totals | 30 | over 70 | not published | n almost 50, d = 7, e unknown; worked example with n = 50 and e = 0: N₁ = 73 | |
| Țarcu Mountains, 17 May 2014 | 17 | – | – | 3 dead within a few months; of those brought in, 14 were left; May 2026: over 250, almost half born in the wild | |
N₀ of the first interval is 0: before 22 March 2012 there was not a single free-ranging bison in the park. No counts were published for 2012, 2013 and 2020–2022.
Measurements and calculation. Herd size by year (males, females, young) for 2014–2019 and releases by year: Dănilă, Cătănoiu, Roșca and Coșofreț (2024), Geographia Technica 19(1), table 3 and p. 136. Totals for 2012–2023 (almost 50 births, seven deaths, over 70 bison) and the sex of the first five: the administration of Vânători-Neamț Nature Park. Țarcu Mountains: Rewilding Europe (2014, 2026). The term n − d − e is calculated from these numbers; years with no published count stay empty. The silhouettes are drawings, one mark for each bison.
What limits growth: factors and carrying capacity
Population size depends on factors that change natality, mortality and migration: food and water, space, predators, disease and parasites, climate, and people, through hunting, poaching, roads or, as with the bison, reintroduction. Some factors hit harder when the population is dense: food is shared among more individuals, and diseases pass more easily from one to another. Others act regardless of population density: a very harsh winter, a flood.
With plenty of food and few enemies, a population grows faster and faster, and the graph of its size takes the shape of the letter J. As resources are shared among more individuals, growth slows and population size approaches a ceiling: the graph takes the shape of the letter S. The ceiling is the carrying capacity, the largest number of individuals the environment can feed over a long period.
For the bison in the Carpathians, carrying capacity has been estimated at about 4 bison per 1,000 ha. In the Białowieża forest in Poland, densities above 5–6 bison per 1,000 ha call for extra feeding, and the females calve less often.
Worked example
The balance of the Vânători-Neamț bison
The park administration reports for 2012–2023: 30 bison released (all of them by 2019), nearly 50 calvings in the wild and 7 deaths, all from natural causes. Before 22 March 2012 there were no free-roaming bison at all, so N₀ = 0.
Taking emigration as zero: N₁ = 0 + 50 − 7 + 30 − 0 = 73. The park reports that in 2023 the free-roaming population was over 70, so the balance fits.
Now a single year. At the 2014 count the herd had 20 bison, in 2015 another 2 were released, and at the 2015 count the herd had 21. From the balance, n − d − e = 21 − 20 − 2 = −1. If both counts are complete and done the same way, and both bison were released before the 2015 count, then, even if calves were born, at least one bison died or left between the two counts.
The number of calvings is approximate (“nearly 50”), and the time of year of each count is not given, so the result is a check, not an exact measurement.
In Romania
The bison of the Țarcu Mountains
On 17 May 2014, 17 bison were brought to Armeniș, in the Țarcu Mountains, to an area where they gradually got used to life in the wild. Within a few months three of them had died, and at least two had been infected with bluetongue virus. The virus is passed on by the bites of small insects, biting midges, and transmission usually falls with the first frosts, when many of these insects die. The disease was a mortality factor; the insects were only its carrier.
In the years that followed, more bison were brought in, and calves born in the wild raised natality. In May 2026, more than 250 bison were living free in the Țarcu Mountains, and almost half of them had been born in the wild. The population now grows from two sources: immigrants brought by people, and births.
In short
- Population size is the total number of individuals in the population; density is population size per unit of area or volume.
- Age and sex structure and spatial distribution (uniform, random, clumped) are characteristics of the population.
- Natality and immigration increase population size; mortality and emigration decrease it: N₁ = N₀ + n − d + i − e.
- A constant population size does not mean there were no births, deaths or migrations; they can cancel each other out.
- Food, space, predators, disease and parasites, climate and people influence population size.
- Carrying capacity is the largest population size the environment can sustain over a long period; close to it, growth slows down.
Common mistakes
WrongIf population size stayed the same, nobody was born and nobody died.
RightBirths can be offset by deaths, and immigration by emigration. Population size shows only the net result of the four flows.
WrongIf a population grows, its density always grows.
RightDensity also depends on area. At Vânători-Neamț, the herd grew from 20 to 47 bison, but density fell from 2.9 to 1.6 per 1,000 ha, because the area used grew even more.
WrongA population with plenty of food grows for ever.
RightAs individuals multiply, resources are shared among more of them, and diseases spread more easily. Growth slows as population size approaches the carrying capacity.
Check yourself
Seven questions. For the first six you see the explanation at once, with the paragraph of the lesson that supports it; for the written ones you compare with a good answer.
Which two processes increase population size?
Answer
b) Natality and immigration. Births and arrivals from elsewhere add individuals. Deaths and departures take them away.
Between the 2014 and 2015 counts, the Vânători-Neamț herd received 2 released bison, yet its size rose only from 20 to 21. Assume the counts are complete. What can you conclude?
Answer
c) That at least one bison died or left between the two counts. From the balance, n − d − e = 21 − 20 − 2 = −1. If the counts are complete and done the same way, and the releases happened between them, the negative difference shows that deaths and departures outnumbered births, so at least one bison left the population. You do not know, however, how many calves were born.
In 2014, at Armeniș, at least two bison were infected with bluetongue virus. What role did the biting midges play?
Answer
b) They carried the virus from one animal to another through their bites. The disease, caused by a virus, was the mortality factor; the midges were only the carrier that took the virus from one animal to another.
In 2014, the 20 bison of Vânători-Neamț used about 6,811 ha. How many bison was that per 1,000 ha? Round to one decimal place.
bison per 1,000 haAnswer
2.9 bison per 1,000 ha. Density is population size divided by area: 20 ÷ 6,811 × 1,000 ≈ 2.9 bison per 1,000 ha. In 2019 it was 1.6, even though population size had grown.
Use the park’s data for 2012–2023: N₀ = 0, 30 bison released, 50 calvings, 7 deaths, no emigration. What is the calculated population size at the end?
bisonAnswer
73 bison. N₁ = N₀ + n − d + i − e = 0 + 50 − 7 + 30 − 0 = 73. The park reports more than 70 free-roaming bison in 2023.
For each event, choose how it changes the size of the free-roaming herd.
Answer
Increases population size: a female gives birth to a calf in the forest; four females brought from Germany are released into the herd.
Decreases population size: a bison dies of bluetongue disease; a young male leaves for a neighbouring region and never comes back; a calf is killed by stray dogs.
Births and immigration add individuals; deaths, from any cause, and emigration take them away.
The carrying capacity for the bison in the Carpathians has been estimated at about 4 bison per 1,000 ha. What do you think would happen if the Vânători-Neamț herd kept growing while the area it uses stayed the same? Explain using natality and mortality.
A good answer
As density approached 4 bison per 1,000 ha, the food would be shared among more and more bison. Females would calve less often, so natality would fall, and weakened animals would die more easily, including from diseases, which spread faster in a dense herd. Growth would slow until births were balanced by deaths, or the bison would move to new areas (emigration).
A complete answer links density to resources, shows the effect on natality and mortality, and says that population size approaches a ceiling or that emigration begins.
Practical work for this lesson
- The same species, different proportions – Ecological case study, 40–50 minutes (CS)
Terms
- population size
- The total number of individuals in a population at a given moment.
- density
- The size of a population per unit of area or volume.
- natality
- The number of individuals born in a population over a period of time.
- mortality
- The number of individuals that die in a population over a period of time.
- immigration
- The arrival in a population of individuals from elsewhere.
- emigration
- The departure of individuals from a population to somewhere else.
- carrying capacity
- The largest population size that an environment can sustain over a long period.
- age and sex structure
- The division of a population’s individuals into age groups and by sex.
Sources and link to the programme
- Dănilă, Cătănoiu, Roșca, Coșofreț (2024), Geographia Technica 19(1):135–150 – GIS analysis of the spatial distribution of European bison in Vânători Neamț Natural Park, 2014–2019 – releases by year, 2012–2019 (5, 5, 6, 2, 3, 4, 1, 4 = 30; 14 males, 16 females); table 3, population size by year, 2014–2019, with males, females and young (20, 21, 25, 35, 39, 47); 47 bison in 2019, of which 30 released and 17 born in the wild; density of 2.9 (20 on 6.8 thousand ha, 2014) and 1.6 (47 on 30.1 thousand ha, 2019) per 1,000 ha; area of 6,811 ha in 2014 and 30,110 ha in 2019; herds led by adult females; carrying capacity of 4 bison per 1,000 ha in the Carpathians (Kuemmerle et al. 2011; Perzanowski et al. 2005); Białowieża: above 5–6 bison per 1,000 ha, supplementary feeding and lower fertility (Krasińska et al. 2013); over 70 bison in 2023
- Administrația Parcului Natural Vânători-Neamț – Zimbrul: perspective – 22 March 2012, the first group of five bison (3 males, 2 females) released; releases in 2013–2019; in 2012–2023, nearly 50 calvings in the wild and 7 deaths, all from natural causes; free-roaming population over 70
- Rewilding Europe – First wild bison in Romania after 160 years (2012) – the release of five bison in Vânători-Neamț Nature Park, 22 March 2012
- Rewilding Europe – Finally back on stage after more than 250 years! (17 May 2014) – 17 bison brought to Armeniș, in the Țarcu Mountains, on 17 May 2014
- Rewilding Europe – Bluetongue disease outbreak proves the importance of new large wild herds of European bison (17 October 2014) – three of the 17 bison died, at least two infected with bluetongue virus; the virus spreads through the bites of midges; frost tends to kill the insects, and outbreaks usually end then
- World Organisation for Animal Health (WOAH) – Bluetongue – the activity of the midge vectors falls with the first frost or severe cold; the virus persists where midges survive the winter
- Rewilding Europe – Bison ambassadors to champion wildlife comeback in the Southern Carpathians (28 May 2026) – more than 250 free-roaming bison in the Țarcu Mountains, almost half of them born in the wild
- OpenStax – Biology 2e, 45.1 Population Demography – population size and density; uniform (penguins), random (dandelions) and clumped distribution; age structure
- OpenStax – Biology 2e, 45.3 Environmental Limits to Population Growth – exponential growth (J curve), logistic growth (S curve), carrying capacity
- OpenStax – Biology 2e, 45.4 Population Dynamics and Regulation – density-dependent factors (food, disease) and density-independent factors (weather, natural disasters)
From the programme: “Characteristics of the population. Factors that influence population size” (specialism, Natural Sciences). Specific competences addressed: 1.2, 2.1, 2.2.