Chapter 10 · Humans and the biosphereLesson 10.4CS
The carbon cycle and the greenhouse effect: how human activities change it
Why does the carbon dioxide in the air fall every summer and rise again every winter, yet still climb from one year to the next?
- Size
- from 6 km to 12,742 km
- Level
- biosphere
- Time
- from 1958 to today
Before you read: what do you think?
At Mauna Loa in 2025, the average for May was 430.51 ppm CO2. What had happened by September?
See the answer
It fell to 424.37 ppm, a drop of 6.14 ppm. In summer, the forests, grasslands and crops of the northern hemisphere take up more CO2 through photosynthesis than they release through respiration and decomposition. In autumn and winter the balance reverses and the concentration climbs again.
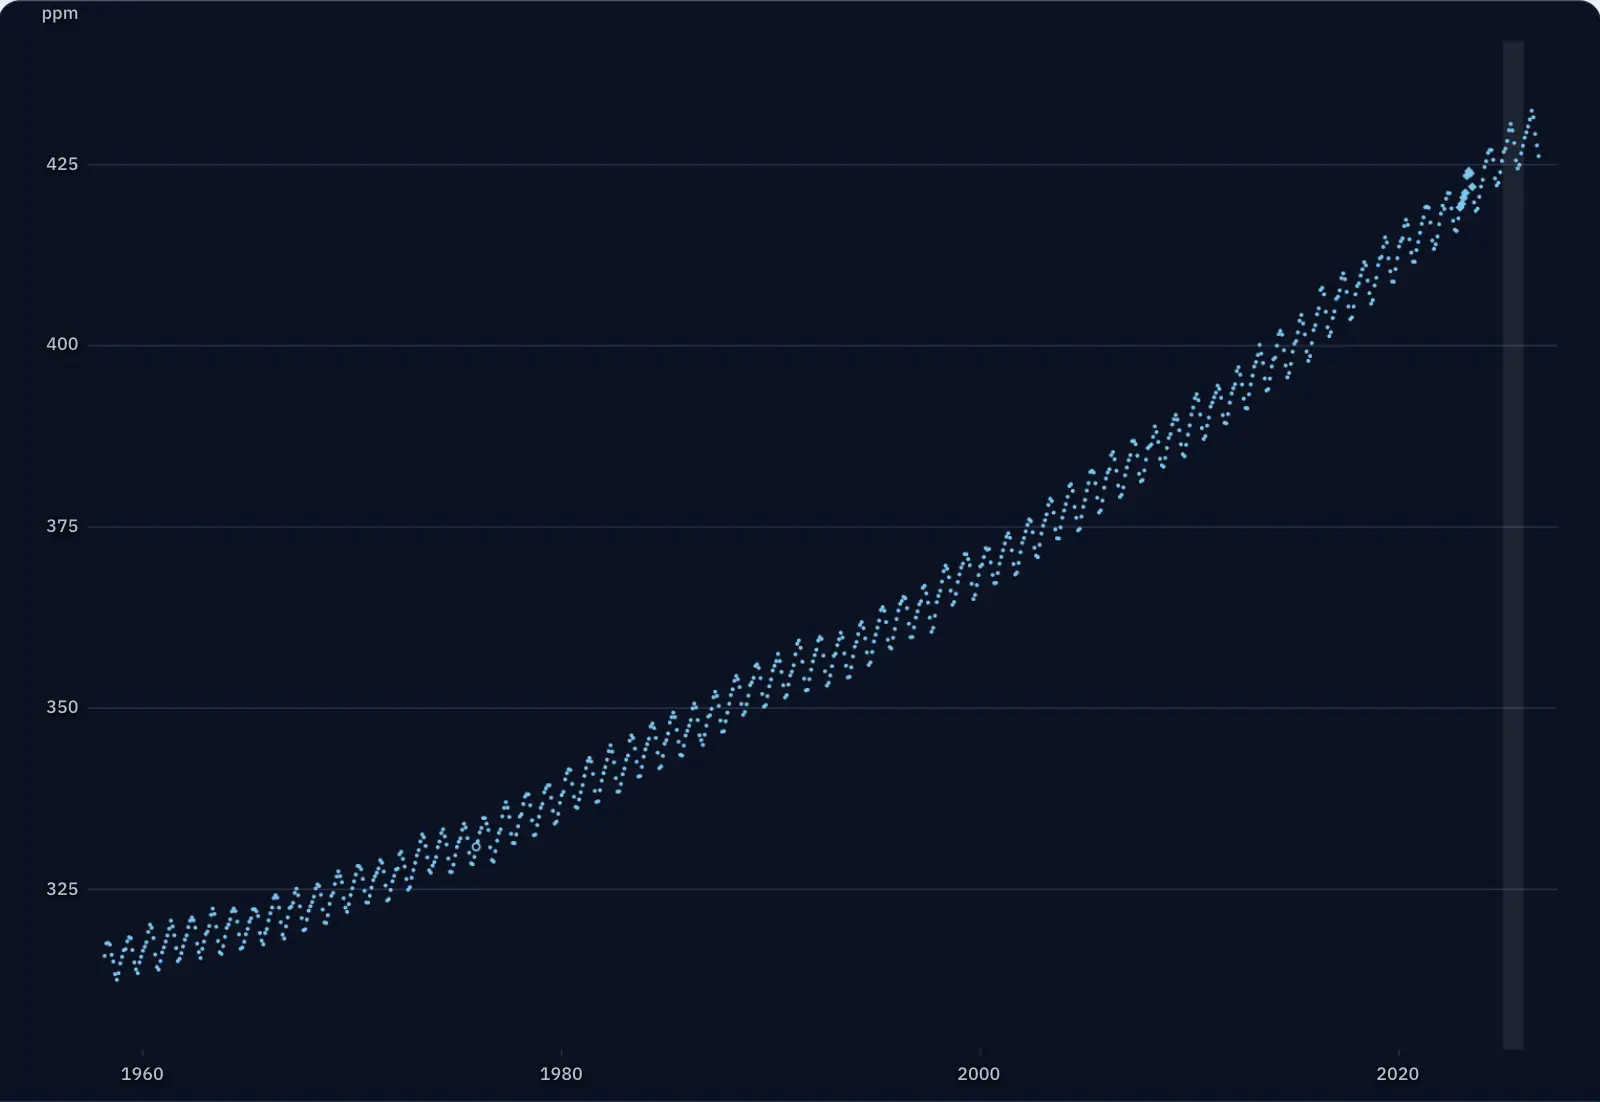
Plot the CO2 concentration measured at Mauna Loa month by month and the curve does not climb in a straight line: it zigzags. In 2025 the average for May was 430.51 ppm, and for September, 424.37 ppm. The summer dip is the photosynthesis of the vegetation of the northern hemisphere, and the climb from year to year comes from carbon dug out of the ground and burnt.
Carbon sits in reservoirs and moves from one to another
The carbon cycle is the movement of carbon atoms between the atmosphere, living things, soil, ocean and rocks. Every place where carbon is held is a reservoir, and the amount of carbon moved in a year from one reservoir to another is a flux. The amounts are measured in billions of tonnes of carbon (Gt C), that is, the mass of the carbon atoms alone.
According to the IPCC, before the industrial era the atmosphere held about 591 Gt C, and by 2019 humans had added another 279 Gt C. Vegetation holds about 450 Gt C, soils 1,700, the permanently frozen soils of cold regions (permafrost) 1,200, and the ocean more than 38,000, most of it in deep water. The known reserves of coal, oil and natural gas hold about 930 Gt C. The largest reservoir is rock, with about 65,500 Gt C.
The fluxes: photosynthesis, respiration, decomposition, burning, dissolving
Through photosynthesis, plants, algae and cyanobacteria fix the carbon in CO2 into organic substances, using the energy of light. Through respiration, plants, animals, fungi and many microorganisms break down organic substances and release CO2. Decomposers (bacteria and fungi) do the same with dead remains. Burning wood or fossil fuels also releases CO2. At the ocean surface CO2 dissolves, and more than 90% of the carbon in the ocean is in the form of bicarbonate ions.
These exchanges make up the fast cycle: carbon passes through them in days, years or centuries. The slow cycle moves carbon between rocks, soil, ocean and atmosphere over 100–200 million years, through the dissolution of rocks, the deposition of carbonates on the sea floor and volcanic eruptions. Fossil fuels are the remains of organisms transformed over millions of years. Burning them moves this carbon from the slow cycle into the atmosphere within a few generations.
The yearly zigzag: northern vegetation takes up carbon in summer and releases it in winter
In spring and summer the great land masses of the northern hemisphere turn green, and photosynthesis removes more CO2 from the air than respiration and decomposition add. In autumn and winter many plants lose their leaves or go dormant, decomposition carries on, and CO2 builds up again. At Mauna Loa the yearly maximum usually falls in May, and the minimum in September–October. In the southern hemisphere, which has less land, the cycle is reversed.
The zigzag shows that the fast cycle is almost balanced from one year to the next. The rise from year to year shows what is being added from outside it.
| Year | Annual mean | Rise per year | Mean yearly swing |
|---|---|---|---|
| 1959 | 315.98 | 1959–1969: 0.86 | 1959–1968: 5.93 |
| 1969 | 324.62 | 1969–1979: 1.22 | 1969–1978: 6.14 |
| 1979 | 336.84 | 1979–1989: 1.64 | 1979–1988: 6.39 |
| 1989 | 353.20 | 1989–1999: 1.53 | 1989–1998: 6.45 |
| 1999 | 368.54 | 1999–2009: 1.91 | 1999–2008: 6.36 |
| 2009 | 387.64 | 2009–2019: 2.40 | 2009–2018: 6.81 |
| 2019 | 411.65 | 2019–2025: 2.62 | 2019–2025: 6.74 |
| 2025 | 427.35 | – | – |
First monthly mean: 315.71 ppm (March 1958); last: 426.07 ppm (September 2026). In 61 of the 67 full years (1959–2025), the highest monthly mean was in May; in the others, in April (four years) or June (two years); the lowest, in September (40 years) or in October (27 years). Mean swing over 2016–2025, calculated against the straight line of each year: 5.06 ppm at Mauna Loa, 0.95 ppm at the South Pole.
Measurements and calculation. Each dot is a monthly mean calculated from measurements; a few missing months are filled in by NOAA by interpolation; the annual means are those published by NOAA. The yearly swing (the month’s mean minus the seasonally corrected value calculated by NOAA, the largest minus the smallest within a year), the rates per decade and the differences are calculated from them. Data: NOAA Global Monitoring Laboratory (Xin Lan) and Scripps Institution of Oceanography (Ralph Keeling), the Mauna Loa monthly file of 9 October 2026; the measurements from March 1958 to April 1974 are by C. David Keeling (Scripps). Because of the Mauna Loa eruption, the months December 2022 to July 2023 were measured at Maunakea, about 34 km to the north (diamonds; until 4 July 2023). Empty circles are months filled in by NOAA by interpolation (only one after 1974, December 1975); for 1958–1974 the file does not say which months were filled in. South Pole: NOAA GML, continuous in situ measurements (Pétron et al., 2026, doi:10.15138/yaf1-bk21). NOAA data are freely available to the public (South Pole series: CC0 1.0, waiver of rights); the Scripps data (1958–1974) are licensed CC BY 4.0, with credit to the Scripps Institution of Oceanography, UC San Diego.
The natural greenhouse effect and the enhanced greenhouse effect
The greenhouse effect, described in the lesson on climate, starts from the infrared radiation given off by the ground and the ocean once the Sun has warmed them. Molecules of CO2, CH4, N2O and water vapour absorb part of this radiation and emit it in all directions, including back towards the surface.
When humans add CO2 and other gases, a larger share of the infrared radiation is trapped, and the surface warms until the planet once again sends out to space as much as it receives from the Sun. This is the enhanced greenhouse effect, the cause of the current warming.
The carbon budget: where the emitted carbon ends up
The global carbon budget compares the carbon emitted by humans with the places where it ends up. According to the IPCC, in 2010–2019 humans emitted on average 10.9 Gt C a year: 9.4 from fossil fuels and cement and 1.6 from land-use change, mostly deforestation. Each year, 5.1 Gt C stayed in the atmosphere, 2.5 were taken up by the ocean and 3.4 by vegetation and soils on land.
The Global Carbon Project estimates total emissions for 2026 at 43.3 billion tonnes of CO2, that is, the mass of the whole molecule, oxygen included. In 2016–2025 the land took up 22% of emissions and the ocean 27%. The remaining half or so built up in the atmosphere.
Worked example
The balance of an average year in 2010–2019
Inputs to the atmosphere from human activities: 9.4 + 1.6 = 11.0 Gt C; the IPCC gives the total as 10.9 Gt C a year, because it adds the values before rounding. Outputs from the atmosphere: the ocean 2.5 and the land 3.4, a total of 5.9 Gt C a year.
What stays in the atmosphere is 10.9 − 5.9 = 5.0 Gt C, close to the measured rise of 5.1 Gt C. The small difference is what the IPCC calls the budget imbalance, that is, the error in the estimates.
The fraction left in the air is 5.1 ÷ 10.9 = 0.47, or 47%. The mass of CO2 that corresponds to the 5.1 Gt C is 5.1 × 44 ÷ 12 = 18.7 billion tonnes of CO2 a year.
Carbon has neither appeared nor disappeared: the planet’s total is the same. The distribution has changed, and the reservoir that has grown, the atmosphere, is the one that warms the planet.
In Romania
How much carbon the forests hold
The greenhouse gas inventory that Romania reports to the European Union has a sector for forests and land use. According to Eurostat, in 2024 forest land took up 24.55 million tonnes of CO2 equivalent from the atmosphere, more than in 2022 (22.82) and in 2023 (24.05). The sector as a whole took up 31.01 million tonnes.
For comparison, Romania’s emissions without this sector were 95.59 million tonnes of CO2 equivalent in 2024. The forests therefore offset roughly a quarter of them. If almost all of the forest figure is CO2, the carbon taken up in 2024 is 24.55 × 12 ÷ 44 ≈ 6.7 million tonnes of carbon. The reservoir stays full only as long as the forest grows at least as fast as it is felled or burnt.
In short
- The carbon cycle moves carbon between reservoirs (atmosphere, vegetation, soil, ocean, rocks, fossil fuels) through fluxes: photosynthesis, respiration, decomposition, burning, dissolving in the ocean.
- The fast cycle takes days, years or centuries; the slow cycle, through rocks, takes 100–200 million years, and burning fossil fuels short-circuits the slow cycle.
- The yearly CO2 zigzag at Mauna Loa (in 2025, from 430.51 ppm in May to 424.37 ppm in September) comes from the summer photosynthesis and winter decomposition of the vegetation of the northern hemisphere.
- The enhanced greenhouse effect occurs when the gases added by humans trap more of the infrared radiation given off by the Earth’s surface.
- In 2010–2019, of the 10.9 Gt C emitted by humans each year, 5.1 stayed in the atmosphere, 2.5 went into the ocean and 3.4 onto land.
Common mistakes
WrongPlants only take up CO2; they never release it.
RightPlants respire day and night and release CO2. In summer, photosynthesis outweighs respiration, which is why their net balance is uptake.
WrongBurnt fossil carbon quickly turns back into coal and oil.
RightFossil fuels formed over millions of years. The burnt carbon ends up in the atmosphere, ocean and vegetation and does not return to the deposits on the timescale of a human life.
WrongIf the planet’s total carbon is constant, emissions cannot change the climate.
RightThe total is constant, but the distribution changes. Carbon moved from deposits into the atmosphere strengthens the greenhouse effect.
Check yourself
Seven questions. For the first six you see the explanation at once, with the paragraph of the lesson that supports it; for the written ones you compare with a good answer.
Why does the CO2 concentration at Mauna Loa fall between May and September?
Answer
c) The vegetation of the northern hemisphere takes up more CO2 through photosynthesis than is released. The cycle follows the seasons of the vegetation on the great land masses of the north. Emissions from fuels go on all year.
Which reservoir holds the most carbon?
Answer
c) Rocks. Rocks hold about 65,500 Gt C; the ocean, more than 38,000; the atmosphere, less than 1,000.
For each process, choose the cycle it belongs to.
Answer
Fast cycle: Photosynthesis in an oak tree; Respiration in a cow; Decomposition of fallen leaves.
Slow cycle: Rocks dissolved by rainwater; Carbonates deposited on the sea floor; Volcanic eruptions.
The processes of living things move carbon in days or years; rocks, sediments and volcanoes move it over 100–200 million years.
What does a greenhouse gas do?
Answer
b) It absorbs the infrared radiation given off by the surface and emits some of it back towards it. Sunlight passes through; it is the infrared radiation given off by the ground that is partly trapped.
In 2010–2019 humans emitted 10.9 Gt C a year, and 5.1 Gt C a year stayed in the atmosphere. What percentage of the emissions stayed in the atmosphere? Round to a whole number.
%Answer
47 %. 5.1 ÷ 10.9 = 0.468, or about 47%. The rest was taken up by the ocean and the land.
At Mauna Loa in 2025, the average for May was 430.51 ppm, and for September 424.37 ppm. By how many ppm did the concentration fall?
ppmAnswer
6.14 ppm. 430.51 − 424.37 = 6.14 ppm, the drop produced by summer photosynthesis in the northern hemisphere.
A forest in the Carpathians is clear-felled, and the wood is burnt for heating. Follow the carbon in the wood and explain what changes in the carbon budget, in the short term and in the long term.
A good answer
When it burns, the carbon in the wood becomes CO2 and passes quickly into the atmosphere, and the forest no longer takes up carbon through photosynthesis. Part of this CO2 is taken up over time by the ocean and by other ecosystems. If a new forest grows in its place, it fixes carbon again, but it needs decades to reach the stock of the old one; if the land is put to another use, the forest no longer rebuilds that carbon stock.
A complete answer names burning and photosynthesis as fluxes, compares how fast the carbon is lost with how fast it is restored, and says which reservoirs gain and which lose.
Terms
- carbon cycle
- The movement of carbon atoms between the atmosphere, living things, soil, ocean and rocks.
- reservoir
- A place where carbon is stored, for example the atmosphere, the ocean or the soil.
- flux
- The amount of carbon moved in a given time from one reservoir to another.
- fast cycle
- The exchanges of carbon between the atmosphere, living things, soil and surface waters, which take days, years or centuries.
- slow cycle
- The movement of carbon through rocks, sediments and volcanoes, over 100–200 million years.
- enhanced greenhouse effect
- The strengthening of the greenhouse effect caused by the gases that human activities add to the atmosphere.
- global carbon budget
- The balance between the carbon emitted by humans and the carbon that stays in the atmosphere, is taken up by the ocean and is taken up by the land.
Sources and link to the programme
- NOAA Global Monitoring Laboratory – Mauna Loa CO2 monthly mean data (data accessed on 16 November 2026) – monthly averages for 2025: May 430.51 ppm, September 424.37 ppm; the yearly maximum usually in May, the minimum in September–October (in 2024 the maximum was in June)
- NOAA Global Monitoring Laboratory – Carbon Cycle Science Toolkit – the clear seasonal cycle of CO2, produced by photosynthesis in the growing season; the seasonal exchanges between the land biosphere and the atmosphere
- Scripps Institution of Oceanography – Annual carbon dioxide peak passes another milestone (5 June 2025) – the May maximum, the fall during the growing season and the rise in autumn; the reversed cycle in the southern hemisphere
- NASA Earth Observatory – The Carbon Cycle – the great land masses of the northern hemisphere draw down carbon in spring and summer; the slow cycle of 100–200 million years; about 65,500 billion tonnes of carbon in rocks; volcanoes
- OpenStax – Biology 2e, 46.3 Biogeochemical Cycles – the carbon reservoirs; more than 90% of ocean carbon as bicarbonate; fossil fuels form over millions of years; burning by humans
- IPCC AR6 WGI (2021) – Chapter 5, Figure 5.12 and Table 5.1 – stocks (atmosphere 591 + 279, vegetation 450, soils 1,700, permafrost 1,200, ocean 900 + 37,100, fossil reserves 580 + 230 + 118 Gt C); the 2010–2019 budget: 9.4 + 1.6, total 10.9; atmosphere 5.1, ocean 2.5, land 3.4 Gt C a year
- NASA Science – What is the greenhouse effect? – the 15 °C average due to the natural greenhouse effect; greenhouse gases
- Global Carbon Project – Fossil CO2 emissions decrease in 2026 (Global Carbon Budget 2026) – total emissions projected for 2026: 43.3 billion tonnes of CO2 (38.2 fossil)
- Global Carbon Project – Key messages, Global Carbon Budget 2026 – in 2016–2025 the land took up 22% and the ocean 27% of human emissions (49% in total)
- Eurostat – Greenhouse gas emissions by source sector (env_air_gge), updated 2 June 2026 – Romania: forest land −22.82 (2022), −24.05 (2023), −24.55 (2024) Mt CO2e; LULUCF −31.01 Mt (2024); total without LULUCF 95.59 Mt CO2e (2024)
- OpenStax – Microbiology, 8.4 Fermentation – many cells cannot respire; some prokaryotes, for example Streptococcus, are permanently unable to respire and use fermentation
From the programme: “The influence of human activities on the natural carbon cycle. The carbon footprint. The greenhouse effect” (specialism, Natural Sciences). Specific competences addressed: 2.1, 2.2, 4.1.